HAL Id: hal-01976612
https://hal.sorbonne-universite.fr/hal-01976612
Submitted on 10 Jan 2019
HAL is a multi-disciplinary open access
archive for the deposit and dissemination of
sci-entific research documents, whether they are
pub-lished or not. The documents may come from
teaching and research institutions in France or
abroad, or from public or private research centers.
L’archive ouverte pluridisciplinaire HAL, est
destinée au dépôt et à la diffusion de documents
scientifiques de niveau recherche, publiés ou non,
émanant des établissements d’enseignement et de
recherche français ou étrangers, des laboratoires
publics ou privés.
T cells in the tumor-draining lymph node
Ruby Alonso, Héloïse Flament, Sébastien Lemoine, Christine Sedlik, Emanuel
Bottasso, Isabel Péguillet, Virginie Premel, Jordan Denizeau, Marion Salou,
Aurélie Darbois, et al.
To cite this version:
Ruby Alonso, Héloïse Flament, Sébastien Lemoine, Christine Sedlik, Emanuel Bottasso, et al..
In-duction of anergic or regulatory tumor-specific CD4+ T cells in the tumor-draining lymph node.
Nature Communications, Nature Publishing Group, 2018, 9, pp.2113. �10.1038/s41467-018-04524-x�.
�hal-01976612�
Induction of anergic or regulatory tumor-speci
fic
CD4
+
T cells in the tumor-draining lymph node
Ruby Alonso
1, Héloïse Flament
1, Sébastien Lemoine
2, Christine Sedlik
1, Emanuel Bottasso
1, Isabel Péguillet
3,
Virginie Prémel
1, Jordan Denizeau
1, Marion Salou
1, Aurélie Darbois
1, Nicolás Gonzalo Núñez
1, Benoit Salomon
4,
David Gross
2, Eliane Piaggio
1& Olivier Lantz
1,3,5CD4+ T cell antitumor responses have mostly been studied in transplanted tumors
expressing secreted model antigens (Ags), while most mutated proteins in human cancers
are not secreted. The fate of Ag-specific CD4+T cells recognizing a cytoplasmic Ag in mice
bearing autochthonous tumors is still unclear. Here we show, using a genetically engineered
lung adenocarcinoma mouse model, that naive tumor-specific CD4+T cells are activated and
proliferate in the tumor-draining lymph node (TdLN) but do not differentiate into effectors or
accumulate in tumors. Instead, these CD4+T cells are driven toward anergy or
peripherally-induced Treg (pTreg) differentiation, from the early stage of tumor development. This bias toward immune suppression is restricted to the TdLN, and is maintained by Tregs enriched in
the tumor Ag-specific cell population. Thus, tumors may enforce a dominant inhibition of the
anti-tumor CD4 response in the TdLN by recapitulating peripheral self-tolerance mechanisms.
DOI: 10.1038/s41467-018-04524-x OPEN
1Inserm U932, PSL University, Institut Curie, Paris 75005, France.2Inserm U1151, Institut Necker Enfants Malades, Paris 75015, France.3Laboratoire
d’immunologie clinique, Institut Curie, Paris 75005, France.4Sorbonne Universités, UPMC Univ Paris 06, UMR-S CR7, Centre d’Immunologie et des
Maladies Infectieuses (CIMI), INSERM U1135, CNRS ERL 8255 Paris, France.5Centre d’investigation Clinique en Biothérapie Gustave-Roussy Institut Curie
(CIC-BT1428), Institut Curie, Paris 75005, France. These authors contributed equally: Ruby Alonso, Héloïse Flament, Sébastien Lemoine. Correspondence
and requests for materials should be addressed to O.L. (email:[email protected])
123456789
T
he T cells specific for tumor neoantigens (neoAgs), exclusively expressed by tumor cells, are not affected bycentral tolerance1. Although tumor neoAgs are often
recognized by the immune system, tumors grow progressively in
immunocompetent individuals2. The absence of clinically
effec-tive antitumor responses against tumor neoAgs may represent a particular case of peripheral tolerance. All the mechanisms that normally drive peripheral self-tolerance could be involved: dele-tion of T cells specific for neoAgs, immune deviadele-tion or
sup-pression of the immune response3–6. In addition, tumors could
initially be ignored in the absence of sufficient Ag in lymphoid
organs7, the only location to which naive T cells have access8.
Therefore, tumor Ag-specific T cells would encounter their Ags
when tumor burden is overwhelming7. Alternatively, tumor
Ag-specific naive T cells might be primed in the tumor-draining lymph node (TdLN), but resistance and escape mechanisms
within the tumor would prevent its destruction9. Thus, the
respective impact of inefficient priming in the TdLN or resistance mechanisms in the tumor bed are not fully understood.
A lot of emphasis has been put to date on antitumor CD8+T
cell response. CD4+ T cells as direct mediators of antitumor
responses are just beginning to be appreciated. CD4+ T cells
participate to tumor rejection by helping CD8+T cell priming or
migration to the tumor bed, recruiting innate cells or directly
killing tumor cells10. Accordingly, chronically activated effector
CD4+ T cell expansion and tumor regression are correlated
during neo-adjuvant chemotherapy of patients with breast
can-cer11. Adoptive transfer of in vitro expanded tumor-specific
autologous CD4+T cells can induce long-term complete
remis-sion in cancer patients12,13. On the contrary, CD4+T cells can
also have protumoral effects through the immumodulatory capacity of Treg cells (Tregs). The number of Tregs is increased in the blood, TdLN and at the tumor site in mouse tumor models as well as in cancer patients. In addition, systemic or local depletion
of Tregs can enhance antitumor immunity14,15.
Several mechanisms can contribute to the increased number of Tregs found in cancer patients and mouse tumor models: recruitment/expansion of thymus-derived Tregs (tTregs) in the tumor site and/or the de novo generation of peripherally-induced Tregs (pTregs) within the tumor or TdLN. The respective con-tribution of these 2 susbsets have been seldom studied due to the
lack of reliable markers to distinguish them16. tTregs recognizing
self-Ags expand earlier and faster than effector T cells and inhibit the development of T cell responses against tumor-specific
Ags17,18. Moreover, conversion of Ag-specific naive CD4+T cells
into pTregs has been observed in two transplanted tumor models: a B-cell lymphoma expressing hemaglutinin A (HA), and a
melanoma expressing ovalbumin (OVA)19,20. However, a
lym-phoma is in direct contact with the immune system since the earliest stage and OVA is in part secreted due to an internal signal
sequence21. It is thus unclear whether pTregs specific for a
non-secreted Ag expressed in slowly growing solid tumors may
develop de novo from naive CD4+T cells.
Anergy of tumor Ag experienced CD4+T cells has also been
evoked as a mechanism of immune tolerance22,23but its
defini-tion remained vague until recently. The expression of high level of
FR4 and CD73 on FOXP3−CD44hi CD4+ T cell represents a
positive definition of anergic T cells24. These anergic T cells
would also represent a pTreg precursor reservoir for the
main-tenance of peripheral self-tolerance24. So far, the presence and/or
mechanisms of CD4+T cell anergy in the context of solid tumors
have not yet been addressed.
Transplantation of tumor cells expressing a nominal Ag into mice is frequently used to study the way a tumor neoAg is recognized by naive T cells. However, these models do not recapitulate the slow growth of tumors in cancer patients and the
large amounts of Ag released in an inflammatory context at the
time of implantation artificially prime the immune system25. This
caveat is particularly important for CD4+ T cell responses
because MHC-II peptide complexes can last in vivo for several
weeks25,26. Thus, how the natural antitumor CD4+ T cell
response develops is still unclear. Genetically induced tumors
represent more physiological models27but to our knowledge, they
have not yet been used to study the CD4+T cell response against
a cytoplasmic neoAg expressed by solid tumors, the most fre-quent situation in humans.
In this work, we use an improved lentivirus (LV) based genetically engineered lung adenocarcinoma model to
char-acterize the fate of naive CD4+T cells following the recognition
of a tumor-specific cytoplasmic Ag. The tumor Ag reaches the
TdLN and activates naive CD4+T cells but the response is not
efficient as the activated tumor Ag-specific CD4+ T cells are
anergized or converted into pTregs. Depletion of host Tregs and immunization at a distant site from the tumor indicates a key role for the TdLN in which Tregs locally inhibit the priming of tumor
Ag-specific naive CD4+T cells in a dominant manner.
Results
Impaired antitumor CD4 response during tumor development. We initially used a model of genetically engineered lung
adeno-carcinoma that had previously been described28: a bi-cistronic LV
encoding both a Luciferase fused to an Ag chosen at will and a
Cre recombinase is injected intratracheally (i.t.) into Kras
LSL-G12D/+Trp53flox/flox(KP) mice. We appended the sequence of the
MHC-II-restricted DBY Ag to the Luciferase as a model cyto-plasmic tumor Ag. Adoptive transfer of DBY-specific TCR transgenic Marilyn T cells allows monitoring of tumor Ag-specific
CD4+T cell response, mimicking naive T cells that have exited
the thymus and encounter tumor Ags in the TdLN.
Because the LV may transduce Ag presenting cells (APCs), and the stability of MHC-II peptide complexes on mature dendritic
cells (DCs) can last for several weeks in vivo26, an immune
response against DBY may be induced in the presence of virus-induced signals, at the time of inoculation, independently of Ag expression by tumor cells. Indeed, CFSE-labeled Marilyn cells transferred intravenously (i.v.) into KP, as well as in C57Bl/6 (B6) mice, soon after LV inoculation, were strongly activated and proliferated in the mediastinal (Med) dLNs (Supplementary
Fig.1a, b), suggesting that lung APCs are transduced by the LV.
To reduce expression of DBY by APCs after virus inoculation, we inserted four tandem target sequences of the hematopoietic-specific mir142-3p after the Luciferase-DBY cassette to induce its
degradation specifically in hematopoietic cells29(Supplementary
Fig.1c). Use of the modified LV (Mod-LV) successfully reduced
the expression of Luciferase-DBY by the monocytic cell line U937, while it did not in the epithelial HEK-293LTV cells
(Supplementary Fig. 1d). The activation and proliferation of
Marilyn cells transferred into B6 mice receiving the Mod-LV were significantly reduced and became undetectable after 4 weeks
(Supplementary Fig.1e). The DBY-specific polyclonal
endogen-ous CD4 response was also transient and limited. In the
Med-dLN, the low number of endogenous DBY-specific CD4+T cells
observed 9 days after Mod-LV inoculation virtually disappeared within 2 weeks. This early response was accompanied by a limited recirculation to the lung that did not increase over time and did
not generate DBY-specific host Tregs (Supplementary Fig.1f-h).
Thus, APCs having captured DBY Ag from transduced cells or expressing residual Ag in the absence of complete silencing by the mir142-3p generate inefficient priming that rapidly vanishes without giving rise to Treg or memory cells.
The LV modification did not significantly change tumor
growth (Supplementary Fig.2a). The first tumors were detected
by bioluminescence 10–12 weeks after inoculation with the Mod-LV whereas the tumors imaged at 20–24 weeks were tenfold bigger and often associated with metastasis in the TdLN
(Med-dLNs). These stages are refered as “early stage” (ES) and
“advanced stage” (AS) according to immunohistochemistry
analyses (Supplementary Fig. 2b, c and Supplementary Data 1).
Although lymphocytic aggregates were observed at all stages of
tumor development, as previously described30 (Supplementary
Fig. 2d-f), bona fide tertiary lymphoid structures expressing
PNAd (a marker of High Endothelial Venules) were only
observed at the most advanced stages in the invaded thoracic
wall (Supplementary Fig.2d-iv-vii).
To assess the quality of the tumor Ag-specific CD4+ T cell
response during tumor development, CFSE-labeled Marilyn cells were transferred into KP mice bearing ES or AS tumors. Their activation and proliferation were analyzed 7 and 14 days later
(Fig.1a) in comparison with tumor-free mice inoculated i.t. with
DBY peptide and CpG adjuvant. Marilyn cells proliferated in the TdLN at both stages of tumor development. The significant proliferation of Marilyn cells observed in the ES group indicates that a MHC-II-restricted tumor Ag is not ignored even in small tumors. However, the proliferation of Marilyn cells was lower in
CFSE-Marilyn cells CD45.1+ (i.v.) Group ES (X=10–12 weeks) Group AS (X=20–24 weeks) Analysis (TdLN, lung) d0 KP CD45.2+ Mod-LV (i.t.) TdLN Lung a b d e CFSE CD44 TdLN Lung Gate: Marilyn (Day X+7)
Early stage Tumor-free DBY+CpG (i.t.) 34.1 75.7 Day X+7 TdLN Lung Day X+7 Day X+7 c 0 25 50 75 100 125 Early stage Advanced stage Tumor-free: DBY+CpG ns *
% divided Marilyn cells (# div
≥ 5) 0 25 50 75 100 ns ns
% divided Marilyn cells (# div
≥ 5) w/o Ag * ns # Marilyn cells Early stage Advanced stage Tumor-free: DBY+CpG * * dX dX+7/+14 days Advanced stage 106 105 104 103 102 101 # Marilyn cells 105 104 103 102 101 Day X+14 Day X+14 104 104 103 103 0 0 –103 105 104 103 0 –103 105 104 103 0 –103 105 104 103 0 –103 105 104 103 0 –103 105 104 103 0 –103 105 105 104 103 0 105 104 103 0 105 104 103 0 105 104 103 0 105 104 103 0 105 49.2 91.5 71.2 98.7 0.30 CFSE IFN-γ Early stage Tumor-free DBY+CpG (i.t.) Gate: Marilyn (Day X+7)
TdLN Lung 0 104 103 0 –103 105 104 103 0 –103 105 104 103 0 –103 105 104 103 0 –103 105 104 103 0 –103 105 104 103 0 105 104 103 0 105 104 103 0 105 104 103 0 105 104 103 0 105 104 103 0 105 104 103 0 105 Advanced stage 1.68 17.4 1.18 7.29 Day X+14 Day X+7 Day X+14 20 15 10 5 0 % IFN-γ-producing Marilyn cells f TdLN Early stage Advanced stage Tumor-free: DBY+CpG Lung
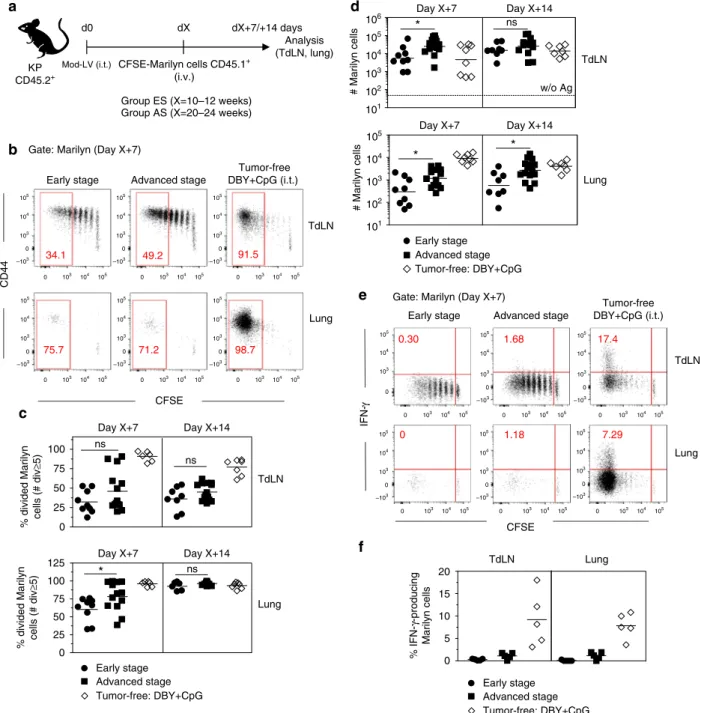
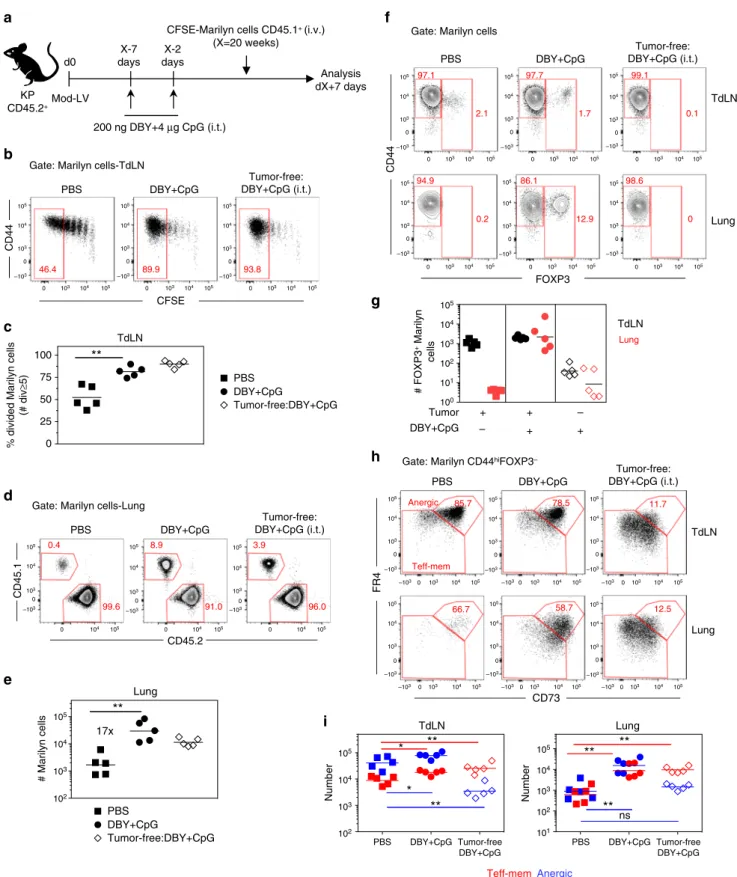
Fig. 1 Priming of tumor Ag-specific naive CD4+T cells is not sufficient for full activation and migration to tumor site. a CFSE-labeled naive Marilyn cells
were transferred into mice bearing ES or AS tumors. Their activation and proliferation were assessed 7 and 14 days after transfer in the TdLN and in the
lung.b, c Pattern of proliferation and quantification (frequency of ≥5 divisions). Red gates indicate ≥5 cell divisions. Tumor-free B6 mice receiving 200 ng
of DBY+CpG i.t. were used as controls. d Number of recovered Marilyn cells. Dashed line: basal number in the absence of Ag. Pooled data from three
independent experiments. ns: non-significant, *p<0.05 Mann–Whitney U test. e Example of IFN-γ-producing Marilyn cell staining according to cell division
both tumor groups in comparison to the DBY+CpG controls. In the TdLN, 7 or 14 days after transfer, <50% of Marilyn cells
underwent ≥5 divisions in the tumor groups contrasting with
90% in the DBY+CpG group (Fig.1b, c). In the lung, most of
Marilyn cells were fully divided (Fig. 1b, c) but lung infiltration
was strongly reduced as compared to controls at day 7 (Fig.1d).
The number of Marilyn cells increased slightly between the ES and AS in both the lung and the TdLN likely due to the higher
tumor burden (Fig. 1d). As the pattern of Marilyn T cell
proliferation was similar at both time points, we will thereafter focus on the day 7 after adoptive transfer.
After a short in vitro re-stimulation, only fully divided cells from the dLN and the lung of the control group produced IFN-γ
(Fig. 1e, f). In line with our previous data31, poorly divided
Marilyn cells from tumor-bearing mice did not produce IFN-γ
(Fig. 1e, f). Thus, tumor Ag reaches the TdLN in sufficient
amount to induce activation and proliferation of tumor
Ag-specific naive CD4+ T cells, but the resulting priming is not
efficient enough to induce full activation and migration of the
tumor Ag-specific CD4+T cells to the tumor site, independently
of tumor size.
Tumor-specific pTregs arise early during tumor development.
We then characterized the tumor Ag-specific CD4+ T cell
response at ES and AS using gene expression profiling on total Marilyn cells from TdLN 7 days after transfer. Naive or activated Marilyn cells from tumor-free mice inoculated with male sple-nocytes or the Mod-LV were used as controls. Hierarchical clustering of most differentially expressed genes evidenced a set of genes specifically enriched in Marilyn cells activated in the tumor context. Interestingly, this cluster includes genes known as being
expressed by Tregs, such as Helios and Foxp3 (Fig. 2a and
Sup-plementary Fig.3). Notably, the whole transcriptome of activated
Marilyn cells was identical in ES and or AS groups (Fig. 2b). A
previously described canonical Treg signature32was enriched in
both tumor groups in comparison with the LV control group (67.8% in ES and 64.4% in AS), as shown by the significant expression of canonical Treg genes such as Foxp3, Il2ra, Nt5e, and
Ebi3 (Supplementary Fig. 4a). Gene set enrichment analysis
(GSEA) evidenced the presence of multiple Treg signatures in the Marilyn T cells from the ES and AS groups in comparison with
the LV control group (Fig.2c). Intracellular staining for FOXP3
confirmed the presence of Tregs in the TdLN 7 and 14 days after adoptive transfer. While FOXP3 expression could barely be detected in tumor-free mice receiving DBY+CpG, 3–5% of Marilyn cells expressed FOXP3 in the TdLN of both tumor
groups. Similar numbers of FOXP3+Marilyn cells were found at
ES and AS (Fig.2d, e).
Importantly, Marilyn Tregs were derived from naive T cells since the transferred Marilyn cells were exclusively CD62L
+CD44lowand did not express FOXP3 nor CD25 (Supplementary
Fig.4b). Peripheral induction of Tregs was further confirmed by
transfer of FACS sorted FOXP3-GFPNeg Marilyn cells into
tumor-bearing mice (Supplementary Fig. 4c, d). FOXP3 was
observed only in Marilyn cells that were undivided or had divided 1-3 times in the TdLN and was barely detected in the >5 divided
cells that had migrated into the lung (Supplementary Fig. 4e).
Most of Marilyn pTregs expressed CD62L, PD1, GITR, CTLA-4, and Helios and some of them expressed CD25 and Nrp-1
(Supplementary Fig. 4f). Thus, when primed in the TdLN a
significant proportion of naive CD4+T cells is rapidly converted
into pTregs in both ES and AS tumors despite wide differences in Ag load between these two groups.
Although pTregs appear similar to tTregs with regard to gene
expression and suppressive functions33, the pTreg transcriptome
in a tumor context has not been characterized. To determine whether tumor-induced pTregs have a specific gene signature, we compared the transcriptomes of tumor-induced Marilyn pTregs and pTregs generated in tumor-free mice receiving i.t. DBY
peptide alone (Supplementary Fig. 5) to natural Tregs (nTregs)
from unmanipulated mice (Fig.2f). 156 genes were differentially
expressed in pTregs from tumor-free mice receiving DBY peptide as compared to 332 in ES and 498 in AS. 106 upregulated genes that were shared by ES and AS groups represent the
tumor-induced pTreg signature (Fig. 2g and Supplementary Data 2)
including genes associated with pTreg generation (Pdcd1 and Nfkbid), Treg homeostasis (Pdcd1), and TGFβ sensitivity (Tgfbr2
and Tgfbr3)34–36. Notably, pTregs generated by providing
the DBY peptide in the absence of adjuvant in tumor-free mice were closer to nTregs than were pTregs generated in the tumor context suggesting that the latter may be more differentiated or activated.
Tumor-specific CD4+T cells rapidly become anergic. Although
a significant fraction of tumor-Ag experienced Marilyn cells was
converted into pTregs, most of them remained FOXP3Neg. As
pTregs can be generated together with FOXP3-CD44hi
CD73-hiFR4hi anergic CD4+ T cells24, we looked for anergic Marilyn
cells in TdLN and the lung of mice bearing ES and AS tumors. The vast majority of activated Marilyn cells in the TdLN dis-played an anergic phenotype whereas an effector-memory
(Teff-mem) phenotype (FR4low/dimCD73low/dim) predominated in
Marilyn cells activated in tumor-free mice receiving DBY+ CpG
(Fig.3a). The frequency of CD73hiFR4hianergic cells in the TdLN
was higher at AS than at ES, reaching up to 90% of the FOXP3
−CD44hi Marilyn cells. Notably, most of the Marilyn cells that
had accumulated in the lung displayed an anergic phenotype in
both tumor groups (Fig. 3b). We then assessed cytokine
pro-duction by the transferred Marilyn cells after in vitro restimula-tion with DBY Ag. Activated Marilyn cells in the tumor context did not produce IFN-γ or IL 10. Regarding IL-2, we did observe some level of secretion in the TdLN. However, the frequency of
IL-2+ cells within the tumor was much lower than in the control
(Fig.3c, d). To better characterize the anergic Marilyn cells, we
analyzed their transcriptome after isolation from the TdLN of mice bearing early or advanced tumors as compared to several control subsets. The anergic Marilyn cells were similar to Marilyn
pTregs or to bulk Marilyn cells from our first data set (Fig.2a),
when compared to naive Marilyn cells or activated Marilyn cells from tumor-free mice receiving either the Mod-LV alone or
immunized with DBY+ CpG i.t. (Supplementary Fig.6a). At the
gene level, a very low number of genes were upregulated in anergic Marilyn cells (55 and 73 for early and advanced stage, respectively) when compared to pTregs. Conversely, the expres-sion of a high number of genes was increased in pTregs (515 and 440 for early and advanced stage, respectively) when compared to
the anergic cells (Supplementary Fig. 6b). These results suggest
that pTregs and anergic Marilyn T cells share many character-istics, but anergic cells lack many important mediators of Treg functions such as Foxp3, Il2ra, and Lrrc32 (GARP Glycoprotein A repetitions predominant) whose expression is highly decreased in anergic cells.
The anergic phenotype of FR4hiCD73hi cells was further
confirmed by a lower Ki67 expression. In the TdLN, anergic cells
were CFSElow and few cells were Ki67+ in contrast with
Teff-mem cells from tumor-bearing mice or tumor-free mice receving
DBY+ CpG (Fig.3e, f). The low Ki67 on anergic cells in
tumor-bearing mice indicates that they have stopped to proliferate after
several divisions (Fig.3e) whereas most pTregs were undivided or
unlikely that Marilyn pTregs derive from anergic cells. However, the anergic cells may derive from the effector/memory subset as
in the TdLN, CD73hiFR4hianergic cells were more divided than
the effector memory subset according to CFSE profile. Overall, the surface phenotype, cytokine production and proliferation profile of Marilyn T cells fit with the known features of anergic cells.
To further assess thefiliation between the anergic and pTreg
Marilyn cells, and to evaluate the stability of the anergic
phenotype, CD44hiFOXP3-GFPNegFR4hiCD73hi Marilyn cells
were purified from tumor-bearing mice and transferred into
another set of tumor-bearing hosts (Fig. 4a). Fifteen days later,
the transferred anergic cells were only found in the TdLN and not in the lung, inguinal/mesenteric LNs, spleen or bone marrow
101 102 103 104 # FOXP3 + Marilyn cells Day X+7 Day X+14 0 1 2 3 4 5 6 Day X+7 2.0 0 –2.0 Tumor-specific cluster Foxp3 Helios Advanced stage Early stage b 1000 1000 0 0 100 100 10 10 1 1
Enriched in first class Enriched in second class
3.1 2.1
<0.0025 <0.025
Color intensity= FDR Circle area = NES
c Naive Male Spl. Mod-LV ES AS a Early stage Tumor-free DBY+CpG (i.t.) Gate: Marilyn cells (Day X+7)-TdLN
FOXP3 d 88.6 3.3 88.5 4.6 93.9 0.1 e
Early stage Advanced stage Tumor-free:DBY+CpG
Log 2 (fold change) Marilyn FOXP3-GFPpos/Host nTregs
–log 10 ( q value) –log 10 ( q value) –log 10 ( q value)
Early tumor Advanced tumor
Tumor-free: DBY (i.t.)
f Early tumor Advanced tumor
Tumor-free: DBY (i.t.)
g Upregulated genes
83
73 71 261 90 408
GSE20366 TREG VS NAIVE CD4 DEC205 CONVERSION UP
ES/LV AS/LV
GSE7852 TREG VS TCONV LN UP GSE20366 TREG VS NAIVE CD4 TCELL UP GSE7460 TREG VS TCONV ACT UP
GSE7852 TREG VS TCONV DN GSE7860 TCONV VS TREG THYMUS UP GSE7852 TREG VS TCONV LN DN GSE7460 TCONV VS TREG LN UP
CD44 104 104 103 103 0 0 105 105 104 103 0 105 104 103 0 105 104 103 0 105 104 103 0 105 6 4 2 0 –5.0 –2.5 0.0 2.5 5.0 6 4 2 0 –5.0 –2.5 0.0 2.5 5.0 6 4 2 0 –5.0 –2.5 2.5 5.0 89 106 240 58 4 13 8 0.0 Advanced stage Day X+14 % FOXP3 + Marilyn cells <0.13 ns 1.5 1.0
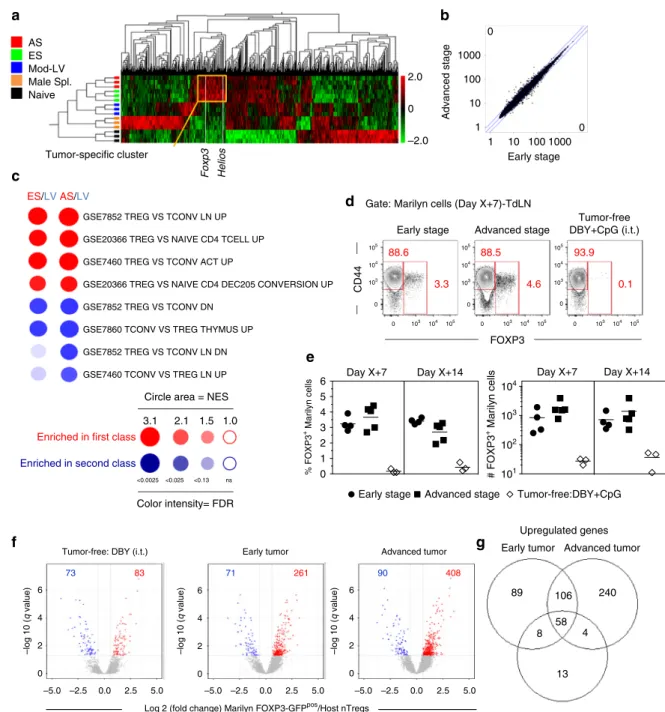
Fig. 2 Activated tumor Ag-specific CD4+T cells display a Treg phenotype.a–c Gene expression profile of FACS-purified total Marilyn cells harvested
7 days after transfer from the TdLN of mice bearing ES or AS tumors. Controls are naive Marilyn cells (Naive) and activated Marilyn cells from tumor-free
B6 mice primed with male splenocytes (Male Spl.) injected into the footpad (f.p.) or injected with the Mod-LV i.t. (Mod-LV).a Heat map and hierarchical
clustering of the most differentially expressed genes (q = 0.05). The yellow square indicates the tumor-specific cluster. b Gene expression level
comparison between Marilyn cells from mice bearing ES or AS tumors (no difference atq = 0.05). c Bubblemap of gene set enrichment analysis of ES vs.
LV, or AS vs. LV conditions. NES, Normalized enrichment score, FDR, False discovery rate.d FOXP3 expression by Marilyn cells. e Frequency and number
of FOXP3+Marilyn cells. Representative of one out of three independent experiments.f Volcano plots representing the q value against fold-change gene
expression for FACS-purified Marilyn pTregs (FOXP3-GFPpos) vs. polyclonal host nTregs from unmanipulated mice (CD4+CD25hi). Marilyn pTregs were
purified from the Med-LNs of tumor-free mice receiving 200 ng of DBY i.t. or mice bearing early or advanced tumors, 7 days after the adoptive transfer of
the naive cells. Upregulated or downregulated genes (Fold change>1.5,q < 0.05) are highlighted in red and blue, respectively. g Venn diagram of genes
(Fig.4b). A low frequency (<20%) of transferred cells expressed Ki67 and all of them maintained the anergic phenotype
(FR4hiCD73hi) without acquisition of FOXP3 (Fig. 4c, d). This
formally demonstrates that anergic T cells do not convert into pTregs in this tumoral setting. However, after transfer into tumor-free B6 mice kept untreated or immunized with DBY
+CpG i.t. or f.p, former anergic cells were found in the lymph nodes draining the site of immunization and an important
fraction also recirculated to the spleen and the lung (Fig.4e, f).
Moreover, up to 90% of Marilyn cells were cycling according to
Ki67 expression (Fig. 4g) contrasting with the low proliferation
observed in tumor-bearing mice (Fig. 4c, d). Importantly, the
TdLN Lung CD73 FR4 Early stage 105 105 104 104 103 –103 –103 0 105 104 103 –103 0 105 104 103 –103 0 103 0 –1030103 104 105 –1030103 104 105 105 104 –1030 103 –1030 103 104 105 –1030 103 104 105 105 104 103 –103 0 105 104 103 –103 0 105 104 103 –103 0 Tumor-free DBY+CpG (i.t.) Gate: Marilyn CD44hiFOXP3– (Day X+7)
a
Anergic 49.2
Teff-mem
65.4
e
Gate: Marilyn CD44hiFOXP3– (Day X+7)-TdLN
Anergic Tumor-free DBY+CpG (i.t.) Advanced stage CFSE Ki67 13.8 Teff-mem TdLN 0 20 40 60 80 100 % Anergic cells Early stage Advanced stage Tumor-free: DBY+CpG b IL-2 IL-10 CFSE Tumor-free: DBY+CpG (i.t.) Tumor-free: DBY+CpG (i.t.) 0.6 8.7 0 3.2 0 3.3 13.6 0.1 0.8 17.6 0 29 29.8 0.8 Gate: Marilyn cells
c d IL-2 0 1 2 3 4 5 10 20 30 40 % Cytokine-producing Marilyn cells Advanced stage Tumor free: DBY+CpG Advanced stage Tumor free: DBY+CpG
TdLN Lung f 0 20 40 60 80 Advanced stage TdLN Anergic Teff-mem Advanced stage 84.3 5.5 52.7 1.5 IFN-γ IL-10 Teff-mem 39.2 50.3 105 104 103 0 0 103 104 105 0 103 104 105 105 104 103 0 105 104 103 0 105 104 103 0 Lung % Ki67 + Tumor-free DBY+CpG Lung TdLN 105 105 104 104 103 103 –103 0 0 0 103 104 105 0 103 104 105 0 103 104 105 105 104 103 0 0 103 104 105 0 103 104 105 0 103 104 105 105 104 103 0 0 103 104 105 0 103 104 105 0 103 104 105 105 104 103 –103 0 105 104 103 –103 0 105 104 103 –103 0 105 104 103 –103 0 105 104 103 –103 0 105 104 103 –103 0 105 104 103 –103 0 105 104 103 0 105 104 103 0 105 104 103 0 105 104 103 0
Advanced stage Advanced stage
0.2 0.1 0 0.04 IFN-γ 0.3 4.2 0.7 0 0 0
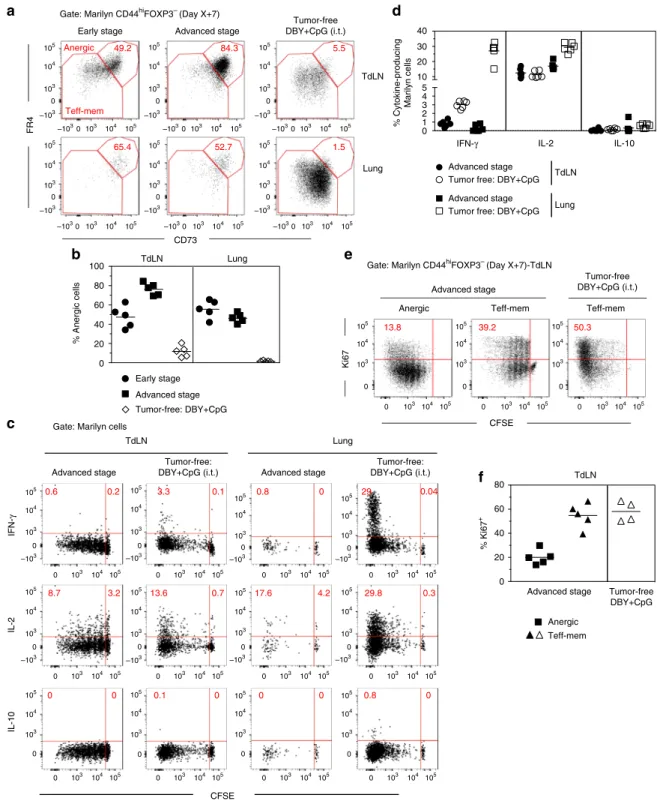
Fig. 3 Most of activated tumor Ag-specific CD4+T cells becomes anergic.a CD73 and FR4 expression by CD44hiFOXP3-Marilyn cells in tumor-bearing
mice or tumor-free B6 mice inoculated with DBY+ CpG (i.t.); b frequency of FR4hiCD73hi(anergic) Marilyn cells.c, d Marilyn cells were harvested 7 days
after transfer from TdLNs or lung of mice bearing advanced tumors. Cells were restimulated in vitro with CD3ε-/-female splenocytes pulsed with DBY
peptide (10 nM). Controls were tumor-free mice i.t. injected with DBY+ CpG. c Representative IFN-γ, IL-2 and IL-10 production by Marilyn cells according
to cell division.d Quantification (frequency). e Representative Ki67 expression by anergic and effector cells in tumor-bearing or tumor-free mice. f
recovery of proliferation by the ex-anergic cells was associated
with a loss of the FR4hiCD73hianergic phenotype (Fig.4h). Their
loss was also observed in untreated B6 mice although to a lower level than in the Ag restimulated mice. Thus, tumor-induced CD4
+T cell anergy requires continuous Ag presentation in a tumor
context and can be reversed by Ag restimulation in the absence of tumor.
TLR triggering does not rescue CD4+T cell functions. We then
studied the mechanisms leading to the generation of anergic and pTregs. Anergy induction and pTreg conversion observed in
activated tumor-specific CD4+T cells could be the consequence
of a lack of inflammatory signals in the tumor microenvironment leading to incomplete maturation of the APCs carrying the DBY Ag from the tumor to the TdLN. Intrapulmonary administration
KP CD45.2+
(Advanced tumor)
Naive Marilyn cells FOXP3-GFPNeg d0 d7 KP mice (Advanced tumor) Analysis +15 days 0 50 100 150 200 250 # Marilyn cells Med-LNs (TdLN) Pool Ing+Mes-LNs Lung BM Spleen c a b FOXP3 CD44 CD73 FR4 Gate: Marilyn CD44hiFOXP3– Gate: Marilyn 100 0 98.0 TdLN Ki67 CD4 Gate: Marilyn CD44hiFOXP3– FR4hiCD73hi d 19.0 f Sorted anergic CD44hiFOXP3–FR4hiCD73hi Marilyn (TdLNs) g 0 25 50 75 100 % in Marilyn cells Ki67 h Untreated CD73 Gate: Marilyn CD44hiFOXP3–
Anergic Teff-mem Intratracheal Med-LNs Pop-LNs 0 6.6 0 Lung 33 0.9 1.6 17 2.2 DBY+CpG 0 20 40 60 80 100 % Ki67 + cells in Marilyn cells d0 B6 mice Analysis e Untreated DBY+CpG (intratracheal) DBY+CpG (footpad) +7 days d7 Med-LNs 104 103 102 101 100 10–1 # Marilyn cells FR4 Spleen Untreated Intratracheal Footpad DBY+CpG Pop-LNs Spleen Lung
Med-LNs Pop-LNs Spleen Lung
CD44 hiFOXP3 – FR4 hiCD73 hi FOXP3 + Sorted anergic CD44hiFOXP3–FR4hiCD73hi Marilyn (TdLNs)
Naive Marilyn cells FOXP3-GFPNeg KP CD45.2+ (Advanced tumor) 105 105 104 104 103 103 –103 0 0 0103 104 105 105 104 103 –103 –103 105 104 103 0 –103 0 105 104 103 –103 0 105 104 103 0 –103 105 104 103 –103 0 105 104 103 0 –103 105 104 103 –103 0 105 104 103 0 –103 105 104 103 –103 0 105 104 103 0 –103 105 104 103 –103 0 105 104 103 0 –103 105 104 103 –103 0 105 104 103 0 –103 105 104 103 –103 0 105 104 103 0 –103 105 104 103 –103 0 105 104 103 0 –103 105 104 103 –103 0 105 104 103 0 –103 105 104 103 –103 0 105 104 103 0 –103 105 104 103 –103 0 0.4 6.3 Footpad
Fig. 4 The persistence of the anergic phenotype requires Ag restimulation in the tumoral context. a FACS sorted CD44hiFOXP3-GFPnegFR4hiCD73hi
Marilyn cells from TdLN of mice bearing advanced tumors were transferred into a second cohort of tumor-bearing hosts.b Number of recovered Marilyn
cells in the indicated organs (inguinal (Ing) or mesenteric (Mes) LNs, lung, bone-marrow (BM) and spleen) andc, d phenotype of Marilyn cells 15 days
after transfer.c Representative dot plots. d Quantification (frequency). e FACS sorted CD44hiFOXP3-GFPnegFR4hiCD73hiMarilyn cells from TdLN of mice
bearing advanced tumors were transferred into tumor-free mice left untreated or treated i.t. or f.p. with DBY peptide and CpG.f Number of Marilyn cells
of the CpG adjuvant was sufficient to abolish pTreg induction in tumor-free mice receiving DBY peptide alone i.t. (Supplementary
Fig.5). We therefore injected CpG into the lung to induce
opti-mal maturation of the APCs in mice bearing advanced tumors. To increase the likelihood that mature APCs would be present in the TdLN at the time of Marilyn T cell transfer, CpG was injected into the lung twice, 5 days apart, prior transferring CFSE-labeled
Marilyn cells (Fig.5a). In the lung, CpG administration induced
the upregulation of CD86 by both CD11b+ and CD103+
conventional DCs (cDCs) subsets in tumor-bearing mice. In the TdLN, both migratory and resident cDCs displayed increased
expression of CD86 (Supplementary Fig. 7). However, Marilyn
cell proliferation in the TdLN or their migration to the lung was
not restored (Fig.5b–e). Moreover, CpG administration did not
prevent Marilyn pTreg induction in the TdLN (Fig.5f, g) and did
not significantly modify the frequency and number of anergic
Marilyn cells in the TdLN and in the lung (Fig.5h, i). Thus, either
CD4+ T cell unresponsiveness is not due to a lack of
102 103 104 105 ns # Marilyn cells 0 25 50 75 100 ns
% divided Marilyn cells (# div
≥
5)
FR4
Gate: Marilyn cells-TdLN
b d Gate: TCRβ+ CD4+ cells-Lung CD44 CFSE PBS 49.4 c e
Gate: Marilyn cells-TdLN
f g TdLN TdLN Lung 4 μg CpG (i.t.) Analysis dX+7 days d0 daysX-7 Mod-LV
CFSE-Marilyn cells CD45.1+ (i.v.)
(X=20 weeks) X-2 days KP CD45.2+ a 84.3 Tumor-free:
DBY+CpG (i.t.) FOXP3
95.7 PBS CD44 2.8 91.9 2.6 95.6 0.2 CD73
Gate: Marilyn CD44hiFOXP3–
7.2 79.7 TdLN Lung Anergic Teff-mem h PBS CD45.1 CD45.2 0.4 99.3 4.43 95.2 PBS 46.7 PBS CpG Tumor-Free: DBY+CpG i PBS CpG Tumor-Free: DBY+CpG 101 102 103 104 ns # FOXP3 + Marilyn cells PBS CpG Tumor-Free: DBY+CpG Teff-mem Anergic 101 102 103 104 105 101 100 102 103 104 105 Number ns ** PBS ns ns Tumor-free DBY+CpG Number ** ns * ns Lung TdLN Tumor-free: DBY+CpG (i.t.) Tumor-free: DBY+CpG (i.t.) Tumor-free: DBY+CpG (i.t.) CpG PBS Tumor-free DBY+CpG CpG 48.4 105 105 104 104 103 103 –103 0 105 105 104 104 103 –103 0 105 104 103 –103 0 105 104 103 –103 0 105 105 104 104 103 103 –103 –103 0 105 104 103 –103 0 105 104 103 –103 0 105 104 103 –103 0 0 –1030 103 104 105 –1030 103 104 105 105 104 103 –1030 105 104 103 –1030 –1030 103 104 105 105 104 103 –103 0 105 104 103 –103 0 0 0 104 105 0 104 105 105 104 103 –103 0 0 0 103 104 105 0 103 104 105 105 104 103 –103 0 105 105 104 104 103 103 –103 0 0 0 103 104 105 0 103 104 105 105 104 103 –103 0 105 104 103 –103 0 CpG 0.3 99.4 CpG CpG CpG 76.0 45.4 0.4
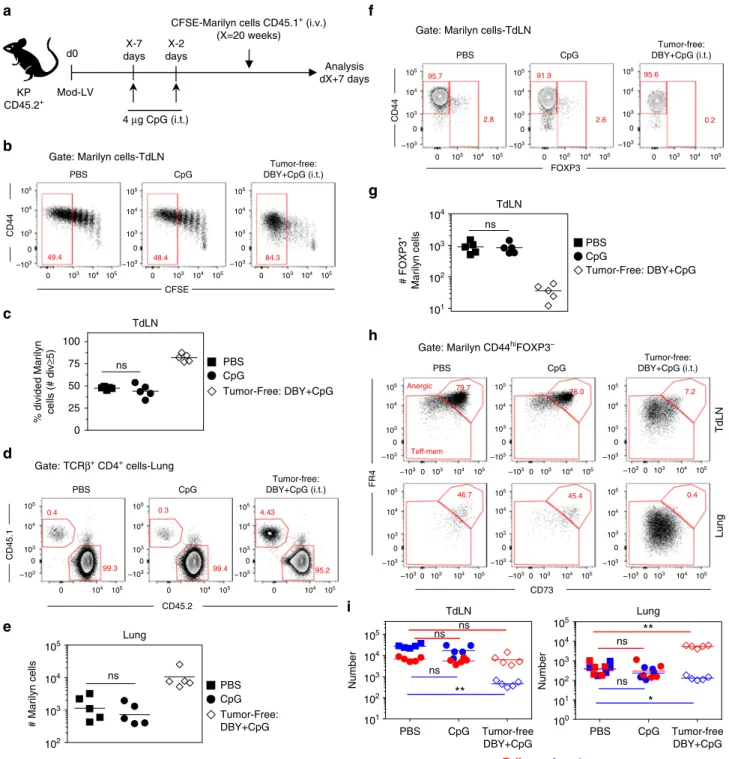
Fig. 5 CpG administration at the tumor site does not restore an effector CD4+T cell response.a Mice bearing advanced tumors received 4μg of CpG
twice, at 5-day interval, 2 days before Marilyn cell transfer.b Proliferation profile of Marilyn cells in the TdLN of tumor-bearing mice receiving or not CpG. c
Frequency of≥5 times divided Marilyn cells. d Representative plots showing the frequency of Marilyn cells in the lung and e quantification (number). f
Representative plots showing the frequency of FOXP3+Marilyn cells in the TdLN andg quantification (number). h Representative plots of FR4 and CD73
expression on CD44hiFOXP3−Marilyn cells, andi quantification (number of anergic or Teff-mem cells). ns: non-significant, *p<0.05, **p<0.01
inflammatory signal or tumor-related signals are dominant over the effect of CpG.
Providing more tumor Ag does not restore CD4 response. An efficient antitumor response requires that sufficient amount of tumor Ag reaches the TdLN. Non-secreted forms of tumor neoAg
may only poorly stimulate specific naive CD4+ T cells37. As
Luciferase-DBY is a cytoplasmic Ag, we checked whether increasing availability of DBY at the tumor site would improve
the CD4+ T cell response. Tumor-bearing mice received DBY
and CpG i.t., twice 5 days apart, before Marilyn transfer (Fig.6a).
Providing additional DBY Ag successfully restored Marilyn cell
proliferation as well as migration to the lung (Fig. 6b–e).
How-ever, DBY+CpG administration led to an accumulation of
Marilyn pTregs in the lung (Fig. 6f, g), without modifying the
frequencies of anergic Marilyn cells in the TdLN and the lung
(Fig. 6h). As the number of both Teff-mem and anergic cells
increased in the same proportion, the ratio of Teff-mem/anergic
cells remained unchanged in the TdLN and lung (Fig.6i). Thus,
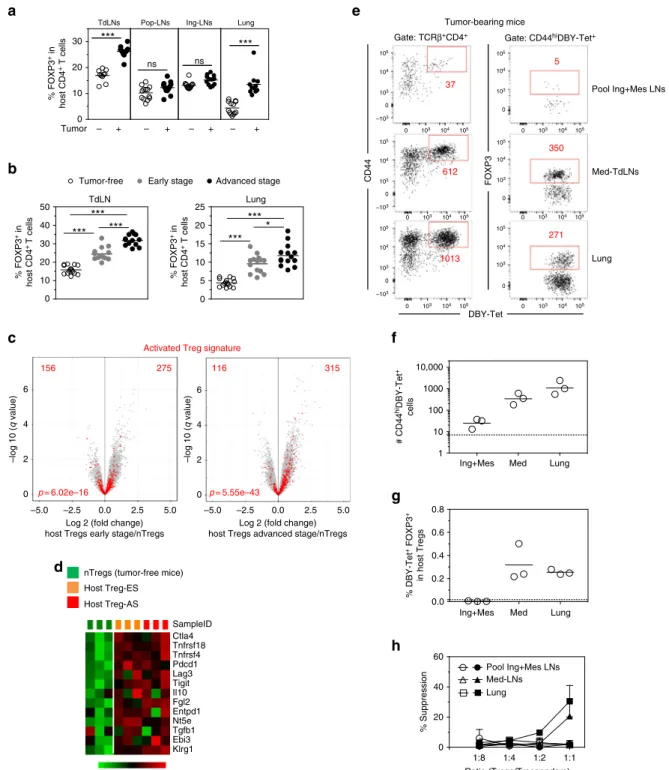
increasing tumor Ag availability at the tumor site even in the presence of adjuvant expands both effector and suppressor cells. Host Tregs control anergy & pTreg conversion of CD4 T cells. The frequency of host Tregs was higher in the TdLN and in the lung of tumor-bearing mice with a gradual increase from ES to
AS (Fig.7a, b). Gene expression profiling of host Tregs from mice
bearing ES or AS tumors showed an enrichment of the recently
described activated Treg signature38 as compared to nTregs of
unmanipulated mice (Fig.7c). Many of the genes involved in Treg
function were upregulated in Tregs from tumor-bearing mice
(Fig. 7d). Importantly, in the TdLN and in the lung of mice
bearing advanced tumors, host FOXP3+Tregs were enriched in
T cells labeled with a DBY:I-Ab-tetramer (Tet). However, the
frequency of this population in tumor non-draining LNs (pool of inguinal and mesenteric LNs) was comparable between
tumor-bearing and tumor-free mice (Fig.7e–g). Importantly, host
DBY-specific Tregs were undetectable in the Med-LN of tumor-free mice whereas they were already present at early stage of tumor growth and subsequently accumulated during tumor develop-ment. At the tumor site, endogenous DBY-specific Tregs were found since the early stage without change in number at later
time points (Supplementary Fig.8). In line with these results, host
Tregs from the TdLN and from the lung of mice bearing tumors but not from other locations were able to suppress Marilyn T cell proliferation in an in vitro Ag-specific suppression
assay (Fig. 7h). These results suggest a potential role for tumor
Ag-specific host Tregs in inducing de novo naive T cell conver-sion and the acquisition of an anergic phenotype.
To examine the role of host Tregs, we depleted these cells at the
time of Marilyn T cell transfer using KP RAG2−/−/DEREG bone
marrow chimera. Host Tregs were depleted in tumor-bearing mice by 3 diphteria toxin (DT) administrations intraperitoneally (i.p.) at 2-day intervals. Naive Marilyn cells were transferred 1 day
after thefirst DT dose (Fig.8a). Following host Treg depletion the
proliferation of Marilyn cells in the TdLN was significantly
increased with 50–90% of the cells dividing ≥5 times (Fig.8b, c)
and was associated with higher infiltration in the lung (Fig.8d, e).
Host Treg depletion also significantly reduced the frequency and
number of Marilyn pTregs in the TdLN (Fig.8f, g), as well as the
frequency of anergic cells both in the TdLN and the lung (Fig.8h,
i). DT administration reduced the number of anergic Marilyn cells in the TdLN to a level similar to that observed in the DBY +CpG control mice. On the contrary, in the lung, the number of anergic cells remained constant but was associated with a large
increase of the Teff-mem pool (Fig. 8j). Therefore, in both
compartments the ratio of Teff-mem to anergic Marilyn cells turned in favor of the Teff-mem cells. Importantly, these results were the consequence of Treg depletion and not DT-associated inflammation as KP non-DEREG mice did not recapitulate the
previous observations (Supplementary Fig.9). Although activated
host Tregs in tumor-bearing mice displayed an increased level of cell surface LAP (TGF-β complexed to latency-associated peptide) as compared to tumor-free mice, accompanied with GARP expression, TGF-β signaling was probably not involved in the de novo generation of tumor-specific Tregs or anergy induction
(Supplementary Fig. 10a, b) since the administration of an
anti-mouse TGF-β neutralizing antibody to mice bearing tumors did not modify Marilyn pTreg conversion or anergy induction
(Supplementary Fig. 10c-e). Overall, these data suggest that host
Tregs, enriched in tumor Ag-specific cells, generated/expanded during tumor development participate in the induction of anergy and the conversion of newly arriving tumor Ag-specific naive CD4
+T cells into pTregs in the TdLN.
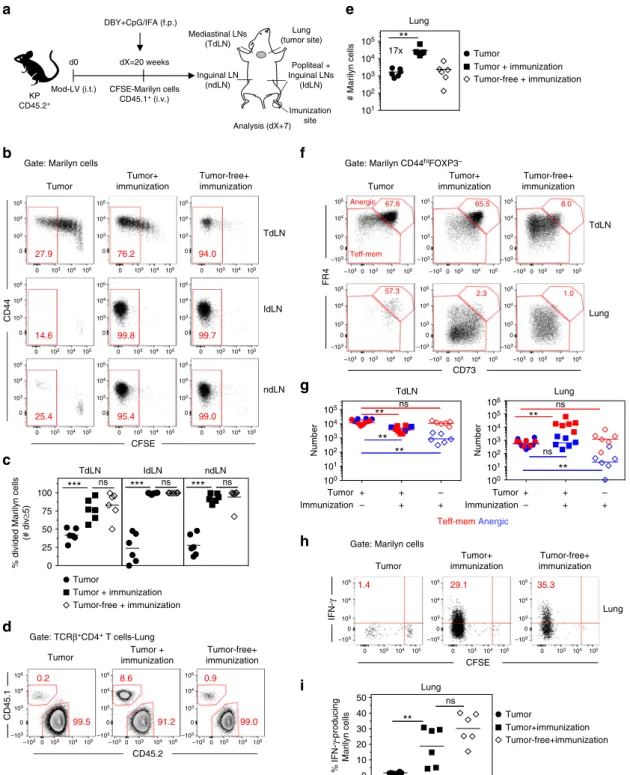
TdLN is the specific site of tumor-induced tolerance. These results suggest that the tumor establishes a state of dominant tolerance through the recruitment and generation of Tregs that
hijack the priming of newly arriving Ag-specific CD4+T cells in
the TdLN, ultimately affecting their accumulation at the tumor site. To confirm the predominant role of the TdLN in the induction of tolerance by the tumor, we set up a model where
Ag-specific CD4+T cells are immunized in a distant LN (popliteal)
by f.p. immunization with DBY+CpG in incomplete Freund's
adjuvant (IFA) (Fig. 9a). Less than 50% of the Marilyn cells
activated in the TdLN displayed a fully divided phenotype in unprimed mice. In contrast, all Marilyn cells from the lymph
nodes draining the Ag injection site (IdLN) divided≥ 7 times
following immunization in tumor-bearing mice. In the TdLN of immunized tumor-bearing mice, the frequency of fully divided
Marilyn cells was largely increased (Fig.9b, c). This could reflect
recirculation of activated Marilyn cells from the IdLNs or a positive feedback of those cells that would provide a pro-inflammatory environment ultimately promoting priming of CD4
+T cells in the TdLN. The efficient priming of naive Marilyn cells
in a non-tumor draining LN also led to a large increase of
Marilyn cells in the lung (Fig.9d, e). The priming at a distant site
of the tumor did not modify the frequency of anergic Marilyn cells nor the ratio of Teff-mem/anergic cells in the TdLN. However, the immunization induced a large accumulation of
Teff-mem Marilyn cells over anergic cells in the lung (Fig. 9f, g)
and restored their IFN-γ production (Fig.9h, i). Altogether, these
results highlight the key role of the TdLN in establishing toler-ance to tumor-specific Ags and the absence of systemic-specific immunosuppression.
Discussion
In this work, we demonstrate that tumors may set a dominant inhibitory environment in the TdLN, preventing efficient priming
of tumor Ag-specific naive CD4+ T cells that instead become
anergic or pTregs. This effect is local and cannot be overcome by providing additional Ag and costimulation signals that would have efficiently primed otherwise in the absence of tumor. This effect is mediated at least in part by tumor Ag-specific host Tregs since their depletion leads to efficient priming and migration of
effector CD4+T cells to the tumor. To our knowledge, our data
provide the first comprehensive study of the CD4+ T cell
response toward a cytoplasmic tumor model neoAg expressed by
newly transformed normal cells in a solid tumor. This is thefirst
report of indisputable pTreg conversion and anergy induction of
0 25 50 75
100 **
% divided Marilyn cells
(# div ≥ 5) # Marilyn cells ** a 200 ng DBY+4 μg CpG (i.t.) Analysis dX+7 days d0 X-7 days Mod-LV
CFSE-Marilyn cells CD45.1+(i.v.) (X=20 weeks) X-2
days
KP CD45.2+
Gate: Marilyn cells-TdLN PBS CFSE CD44 46.4 b CD45.1 CD45.2 0.4 99.6 3.9 96.0
Gate: Marilyn cells-Lung PBS d Lung FOXP3 94.9 0.2 86.1 12.9 98.6 0
Gate: Marilyn cells
97.1 2.1 97.7 1.7 99.1 0.1 PBS CD44 TdLN f PBS CD73 FR4
Gate: Marilyn CD44hiFOXP3–
66.7 11.7 12.5 85.7 TdLN Lung h c e 17x g i TdLN Lung 100 101 102 103 104 Tumor + + – DBY+CpG – + + # FOXP3 + Marilyn cells Teff-memAnergic TdLN Anergic Teff-mem Lung PBS DBY+CpG Tumor-free:DBY+CpG PBS DBY+CpG Tumor-free:DBY+CpG Number * ** * ** PBS Tumor-free DBY+CpG DBY+CpG PBS Tumor-free DBY+CpG DBY+CpG Number ** ns ** ** Tumor-free: DBY+CpG (i.t.) Tumor-free: DBY+CpG (i.t.) Tumor-free: DBY+CpG (i.t.) Tumor-free: DBY+CpG (i.t.) 105 105 104 104 103 103 0 0 0 103 104 105 0 103 104 105 105 104 103 0 105 104 103 0 105 104 103 0 105 104 103 –103 0 –1030 103 104 105 –103 0 103 104 105 105 104 103 –103 0 105 104 103 –103 0 105 104 103 –103 0 105 104 103 0 105 104 103 0 0 103 104 105 –103 105 104 103 0 –103 105 104 103 0 –103 105 104 103 0 –103 105 104 103 0 –103 105 104 103 0 –103 105 104 103 0 –103 105 104 103 0 –103 105 104 103 0 –103 105 104 103 0 –103 105 105 104 104 103 0 0 0 104 105 0 104 105 –103 105 104 103 0 –103 105 104 103 0 –103 105 104 103 0 –103 105 104 103 0 –103 105 104 103 0 –103 105 104 103 0 –103 105 104 103 0 –103 DBY+CpG DBY+CpG 89.9 93.8 105 8.9 91.0 DBY+CpG DBY+CpG 78.5 58.7 105 104 103 102 105 104 103 102 105 104 103 101 102 TdLN Lung
Fig. 6 Concomitant administration of DBY and CpG at the tumor site reinforces tumor-mediated immunosuppression. a Tumor-bearing mice were i.t.
injected twice with DBY peptide (200 ng) and CpG (4μg) at 5-day interval followed 2 days after by CFSE-labeled naive Marilyn cell transfer. b Pattern of
proliferation of Marilyn cells in the TdLN andc quantification (frequency of ≥5 divisions). d Representative plots showing the frequency of Marilyn cells in
the lung ande quantification (number). f FOXP3 expression by Marilyn cells and g quantification (number). h Representative FR4 and CD73 expression on
b 0 10 20 30 40 50 *** *** *** 0 5 10 15 20 25 *** * *** Tumor-free Early stage
TdLN Lung a 0 10 20 30 *** *** ns ns Tumor – + – + – + – + TdLNs c 6 4 2 0 6 4 2 0 –5.0 –2.5 0.0 2.5 5.0 –5.0 –2.5 0.0 2.5 5.0
Log 2 (fold change) host Tregs early stage/nTregs
–log 10 (
q
value)
Activated Treg signature 275
156
–log 10 (
q
value)
Log 2 (fold change) host Tregs advanced stage/nTregs
315 116 p = 5.55e–43 p = 6.02e–16 d 2.0 0 –2.0 Host Treg-ES nTregs (tumor-free mice)
Host Treg-AS e Pool Ing+Mes LNs Med-TdLNs Lung Tumor-bearing mice DBY-Tet CD44 FOXP3 37 612 1013 5 350 271 f g Ing+Mes 1 10 100 1000 10,000 0.0 0.2 0.4 0.6 0.8 0 20 40 60 Pool Ing+Mes LNs Med-LNs Lung 1:8 Ratio (Tregs/Tresponders) % Suppression h 105 105 105 104 104 104 103 –103 103 103 0 105 104 103 –103 0 105 104 103 –103 0 105 104 103 0 105 104 103 0 105 104 103 0 0 0 105 104 103 0 0 103 104 105 105 104 103 0 105 104 103 0 SampleID Ctla4 Tnfrsf18 Tnfrsf4 Pdcd1 Lag3 Tigit Il10 Fgl2 Entpd1 Nt5e Tgfb1 Ebi3 Klrg1
Pop-LNs Ing-LNs Lung
% FOXP3 + in host CD4 + T cells Advanced stage % FOXP3 + in host CD4 + T cells % FOXP3 + in host CD4 + T cells
Gate: TCRβ+CD4+ Gate: CD44hiDBY-Tet+
# CD44
hiDBY-Tet
+
cells
Med Lung
Ing+Mes Med Lung
% DBY-Tet
+ FOXP3
+
in host Tregs
1:4 1:2 1:1
Fig. 7 Host Tregs at the tumor site are enriched in tumor Ag-specific Tregs. a Frequency of host Tregs in the Med-TdLN, tumor non-draining LNs (popliteal
= Pop-LNs or inguinal = Ing-LNs) and lung. b Frequency of host Tregs at different stages of tumor growth. ns: non-significant, *p<0.05, **p<0.01,
***p<0.001 unpaired t-test. c, d Transcriptional analysis of FACS-purified host Tregs (CD4+CD25hi) from Med-LNs of tumor-free or tumor-bearing mice.c
Volcano plots comparing theq value vs. fold-change for host Tregs from mice bearing ES or AS tumors vs. host nTregs from unmanipulated tumor-free
mice. Red dots represent the activated Treg signature. Numbers indicate the upregulated or downregulated genes among the specific signature. The
enrichmentp value is shown. d Heatmap of genes involved in Treg differentiation and function. e Representative plots of host CD4+T cells following DBY:
I-Abtetramer (Tet)-based cell enrichment of cell suspensions from mice bearing advanced tumors. Total numbers of activated CD44hiDBY:I-Ab-specific
host CD4+T cells (left) and FOXP3+among DBY:I-Ab-specific host CD4+T cells (right) are shown.f Quantification of DBY:I-Ab-specific host CD4+
T cells. Each point represents a pool of 2 mice.g Frequency of DBY:I-Ab-specific FOXP3+host CD4+T cells. Dashed lines represent the values obtained in
LNs of tumor-free mice.h Suppression assay using purified host Tregs (FOXP3-GFPpos) from tumor-free (open symbols) or tumor-bearing mice (closed
symbols). Host Tregs sorted from Med-LNs, Ing-Mes-LNs or lungs were cultured for 3 days with CFSE-labeled naive Marilyn cells (Tresponders) and CD3ε
−/−female splenocytes loaded with DBY peptide (2 nM). The graph represents the percent suppression of Marilyn cell proliferation (mean±SEM). One
these anergic CD4+T cells with regard to lymphokine secretion and phenotype stability in the presence or absence of tumor.
Tumor-induced CD4+T cell anergy has been proposed as an
immune evasion mechanism in cancer22,23. In patients, the
expression of inhibitory markers on tumor cells or APCs has been
proposed to induce anergic T cells39. Our data expand the results
obtained in the 90’s bringing both a precise phenotype and a more physiologic context to the concept of tumor-induced anergy. Our data also suggest that tumor-induced anergy is not simply due to a lack of costimulation associated with an
imma-ture state of DCs as previously thought40but dependent on host
Tregs in the TdLN as it was described for self-Ag-specific CD4+
T cell anergy in a model of autoimmune arthritis41. Thus, in
cancer, therapeutic manipulations targeting Tregs would not only release the brake from effector immune response but also impair
generation of anergic T cells, further enhancing antitumor immune responses.
Our data also provide insights regarding thefiliation between
tumor-induced pTregs, anergic and effector cells. Since Ag is
present in the TdLN and not in other LNs, new naive CD4+
T cells keep arriving at all time points in this asynchronous
priming model, making lineage filiation considerations only
tentative. Induction of FOXP3 in Marilyn cells was only observed
in CD44hiT cells, indicating that activation is a prerequisite for
Treg conversion. However, proliferation was not mandatory, as
some FOXP3+T cells were undivided and many had divided only
few times in accordance with previous reports42,43. This differs
from the highly divided Tregs observed in a transplanted A20-HA
lymphoma model19. This discrepancy could be related to the
presence in this latter model of 5–10% of CD25+T cells in the
Mod-LV (i.t) Analysis dX+8 days d0 6 weeks KP RAG2–/– CD45.2+ BM transfer from
DEREG mice DT (i.p) (50 ug/kg)
dX=20 weeks CFSE-Marilyn cells CD45.1+ (i.v)
(dX+1 day)
0 2 4
Gate: Marilyn cells-TdLN
CD44 PBS DT 19.0 80.4 CFSE PBS DT 0 20 40 60 80 100
% divided Marilyn cells
(# div ≥ 5) *** TdLN CD44
Gate: Marilyn cells-TdLN
PBS DT FOXP3 76.2 90.1 5.9 0.5 101 102 103 104 105 102 103 104 # FOXP3 + Marilyn cells PBS DT ** TdLN Anergic Teff-mem 61.7 13.5 3.3 52.1 1.1 1.2 PBS DT CD73 FR4 TdLN –103 103 104 105 0 –103 103 104 105 0 –103 –103 103 103 104 105 104 105 0 0 –103 0 103 104 105 –103 0 103 104 105 –103 0 103 104 105 –103 0 103 104 105 –103 0 103 104 105 –103 103 104 105 0 –103 103 104 105 0 –103 103 104 105 0 Lung Gate: Marilyn CD44hiFOXP3–
Teff-mem Anergic Gate: TCRβ+CD4+-Lung CD45.1 PBS DT CD45.2 0.9 7.2 98.7 92.4 PBS DT 10x *** # Marilyn cells Lung PBS ** ** ns ns Tumor-free DBY+CpG Lung 100 101 102 103 104 105 101 102 103 104 105 Number ns ns ** ** TdLN Tumor-free: DBY+CpG (i.t.) 0 20 40 60 80 100 % Anergic cells PBS Tumor-free DBY+CpG 0 20 40 60 80 100 % Anergic cells 103 104 105 0 103 103 104 104 105 105 0 0 103 104 105 0 105 104 103 –10–3 10–3 0 105 104 103 –10–3 0 103 104 105 0 10–3 103 104 105 0 103 103 104 105 104 105 0 0 0 103 104 105 103 104 105 0 DT PBS Tumor-free DBY+CpG DT DT PBS Tumor-free DBY+CpG DT Lung TdLN a h c b e d g f i j
Fig. 8 Depletion of host Tregs inhibits Marilyn T cell conversion into Tregs and restores their effector functions. a Irradiated KP RAG2-/-mice (5.5 Gy)
were reconstituted with bone marrow from DEREG mice. Once the tumors were established, host Tregs were depleted by administration of 3 doses of DT i.
p. at 2-day intervals. CFSE-labeled naive Marilyn cells were transferred 1 day after thefirst dose of DT and the analysis was performed 7 days later. b
Pattern of proliferation of Marilyn cells in the TdLN andc quantification (frequency of ≥5 divisions). d Representative plots showing the frequency of
Marilyn cells among the CD4+T cells in the lung ande quantification (number). f FOXP3 expression by Marilyn cells and g quantification (number). h
Representative expression of CD73 and FR4 by CD44hiFOXP3−Marilyn cells andi, j quantification (frequency and number). Pooled data of two
transferred tumor-specific CD4+T cells, probably corresponding
to tTregs. We used Rag2−/−TCR transgenic mice that are devoid
of any Tregs. In contrast to pTregs, anergic cells were only observed in the more divided subset suggesting that anergy does not precede pTreg conversion on the contrary to what has been
described by Mueller’s team24. This hypothesis was confirmed by
the absence of pTreg conversion after adoptive transfer of purified anergic cells in tumor-bearing mice. The origin of this dis-crepancy is still unclear. Altogether, our data suggest that tumor-induced pTregs are directly generated from recently activated naive cells and are not the progeny of the anergic cells, whereas the latter may result from effector cells.
Tumor Tumor+ immunization Tumor-free+ immunization 99.7 14.6 99.8 94.0 27.9 76.2 CFSE CD44
Gate: Marilyn cells
TdLN IdLN 99.0 25.4 95.4 Imunization site Inguinal LN (ndLN) Mediastinal LNs (TdLN) Popliteal + Inguinal LNs (IdLN) d0 dX=20 weeks KP CD45.2+ Mod-LV (i.t.) DBY+CpG/IFA (f.p.) Lung (tumor site) 0.9 0.2 8.6 99.0 99.5 91.2 Tumor CD45.2 CD45.1 Gate: TCRβ+CD4+ T cells-Lung 57.3 CD73 FR4 TdLN Lung Anergic Teff-mem 67.6 65.5 8.0
Gate: Marilyn CD44hiFOXP3–
Teff-mem Anergic 0 25 50 75 100
% divided Marilyn cells
(# div ≥ 5) *** ns *** ns *** ns TdLN h Number ** ns ns ** + Tumor Immunization + – + + – Lung Tumor Tumor+ immunization Tumor-free+ immunization 101 102 103 104 105 ** 17x # Marilyn cells Lung CFSE Tumor Tumor+ immunization Tumor-free+ immunization Lung 0 10 20 30 40 50 ** ns i Lung 100 101 102 103 104 105 100 101 102 103 104 105 106 Number ** ns ** ** + Tumor Immunization + – + + – ndLN
Gate: Marilyn cells TdLN 1.4 Tumor Tumor + immunization Tumor-free + immunization Tumor Tumor + immunization Tumor-free + immunization Tumor Tumor+immunization Tumor-free+immunization IdLN ndLN Tumor + immunization Tumor-free+ immunization % IFN-γ-producing Marilyn cells CFSE-Marilyn cells CD45.1+ (i.v.) –103 –103 103 103 104 105 104 105 0 0 –1030103 104 105 –1030103 104 105 –1030103 104 105 –1030103 104 105 –1030103 104 105 –103 103 104 105 0 –103 103 104 105 0 –103 103 104 105 104 104 105 103 103 0 105 104 103 0 105 104 103 0 105 104 103 0 105 104 103 0 105 104 103 0 105 104 103 0 105 104 103 0 105 104 103 0 0 0 103 104 105 0 103 104 105 104 105 103 0 0 103 104 105 103 104 105 104 105 103 0 0 103 104 105 103 104 105 0 0 105 0 –103 103 104 105 0 –103 103 104 105 0 29.1 35.3 –103 103 104 105 0 –103 103 104 105 0 –103 103 103 104 105 104 105 0 0 103 104 105 0 103 104 105 0 IFN-γ 2.3 1.0 105 104 103 0 105 104 103 0 105 104 103 0 104 105 103 0 104 105 103 0 104 105 103 0 a e b f g c d –103 –103 –103 –10 3 –103 –103 Analysis (dX+7)
Fig. 9 Priming of tumor Ag-specific naive CD4+T cells at distant site from the tumor restores their effector functions.a Tumor-bearing mice having
received CFSE-labeled naive Marilyn cells were immunized into the f.p. with DBY peptide (200 ng) and CpG (40μg) emulsified in IFA or left untreated.
Analysis was performed 7 days later.b Pattern of proliferation of Marilyn cells in the TdLN, lymph nodes draining the Ag injection site (IdLN= popliteal +
Inguinal-LNs) and ndLN (non-draining LN= Inguinal) and c quantification (frequency of ≥5 divisions). d Representative plots showing accumulation of
Marilyn cells in the lung of immunized tumor-bearing mice ande quantification (number). f Representative expression of CD73 and FR4 by CD44hiFOXP3
−Marilyn cells andg quantification (number of anergic or Teff-mem cells) h, i Frequency of IFN-γ-producing Marilyn cells in the lung. One representative
The relevance of ourfinding is suggested by the presence of T cells similar to anergic cells in cancer patients. Our team recently evidenced that untreated metastatic uveal melanoma (mUM) and breast cancer patients harbor an increased frequency
of CD127−CD25−CD4+ T cells in the blood as compared to
healthy donor11. This population of chronically stimulated CD4+
T cells (chCD4) displays some of the features observed in mouse anergic cells: reduced proliferation and dampened cytokine
secretion. We examined whether these chCD4+ T cells would
express a transcriptome signature similar to that of mouse anergic
cells (Supplementary Fig.11a, b and Supplementary Data3). The
tumor-induced anergic mouse gene signature was significantly
enriched in chCD4+T cells from cancer patients (p= 0.0023) but
not from healthy donors (p= 0.275) (Supplementary Fig. 11d),
suggesting that CD4+T cells may also become anergic in tumor
bearing patients including NSLC patients (Supplementary
Fig. 11c). Thus, tumor-specific anergic CD4+ T cells may also
exist in humans.
With regard to the mechanisms of anergy and pTreg induction, depletion of host Tregs inhibited conversion of naive tumor
Ag-specific CD4+T cells into pTregs and restored a typical effector
phenotype, ultimately promoting their accumulation in the tumor bed. Whether host Tregs directly modulate naive Marilyn T cell priming through T–T interactions or modify the Ag-bearing APCs is unknown. Because in another model, secretion of the
tumor Ag was necessary for tumor rejection by CD4+ T cells
alone37, it is likely that the high number of CD4+effector cells
generated by host Treg depletion will not be sufficient by them-selves to reject the tumors in our model.
In contrast with the TdLN, the frequency of host Tregs in non-tumor dLNs was not increased. Notably, administration of DBY peptide with CpG at a distant site from the tumor but not at the tumor site led to strong Marilyn T cell activation with subsequent migration to the tumor site. These results demonstrate the key role of the TdLN in establishing a state of tolerance. The different frequency of host Tregs between TdLN and tumor ndLNs may account for the expansion of host Tregs-specific for tumor Ag(s) and/or self-Ag(s) from the organ where the tumor develops. The presence of DBY-specific Tregs in the TdLN and not in other LNs supports a role in anergy/pTreg conversion for tumor Ag-specific Tregs expanded/converted during the slow growth of the tumor. Presumably, Treg mediated suppression whose primary func-tion is to avoid organ-specific autoimmunity, also contribute to tumor tolerance. Accordingly, self-specific memory Tregs impair antitumor response by proliferating earlier than antitumor
effector cells17. In our model, an early activation/expansion of
host Tregs could occur at the stage of premalignant lesions as a normal host immune response to control autoimmune reactions. This Treg population presumably enriched in self and tumor Ag specificities would establish a state of tolerance avoiding the emergence of an effector response against tumor neoAgs. In a genetically induced prostate tumor model, Aire-dependent Tregs
at the tumor site were mainly specific for a self-Ag18. However, in
light of our results, tumor-specific pTregs also contribute to the enlarged Treg population found in the TdLN and at the tumor site.
Altogether, our data indicate that a non-secreted tumor Ag, that represents well most of the mutated proteins in cancer cells,
is detected by tumor Ag-specific CD4+T cells. The responding
CD4+T cells are not deleted but converted into anergic cells or
pTregs. It will be important to better characterize and determine the life span of these subsets in humans as similar cells are detected in cancer patients. It is probable that the localized nature of the imprinting and the reversibility of the anergic state are dependent upon a priming or a boost in the absence of tumor Ag-specific Tregs. This opens the possibility of therapeutic actions.
Indeed, because in humans the thymic output is usually negligible in adults, the ability to therapeutically re-invigorate tumor
Ag-specific CD4+T cells is necessary to use their direct antitumor
properties and to avoid further downregulation of antitumor CD8
+T cell responses due to an absence of help44.
Methods
Mice. Female KrasLSL-G12D/+Trp53flox/floxmice (referred to as KP mice) generously
provided by Dr. Tyler Jacks (Massachusetts Institute of Technology, Cambridge) had been backcrossed in house to a B6 background for >10 generations and used in this study as a genetically engineered mouse model of lung adenocarcinoma. They
were used at 8 to 12 weeks of age. Female B6 Rag2-/-KP mice were used as
recipients of bone marrow cell transfer. Around 8–12 weeks old female B6 CD45.1
+Rag2−/−Marilyn mice45, whose transgenic TCR recognizes the I-Ab-restricted
male DBY peptide (NAGFNSNRANSSRSS) were used as a source of monoclonal
specific naive CD4+T cells. The three mouse strains described above were bred at
CNRS Central Animal Facility (Orléans, France). Female B6 CD45.1/2+Rag2−/−
FOXP3GFPMarilyn mice were from the Inserm U1151 at Necker hospital. B6
FOXP3DTRmice coexpressing human diphtheria toxin (DT) receptor (DTR) plus
GFP with FOXP3 (DEREG mice) were used as bone marrow cell donor mice46.
Male B6 CD3ε−/−mice were the source of splenocytes harboring the DBY Ag and
were bred in-house at Institut Curie. Wild type B6 mice were purchased from Charles River Laboratories (L’Abresles, France). All mice were housed in specific-pathogen free (SPF) conditions in full accordance with FELASA recommendations. All procedures had received approval from Institutional and Regional Ethical Review Boards.
Patient samples. Blood were obtained from metastatic uveal melanoma and non-small cell lung cancer patients before treatment in clinical trials IC-2004-01 and ALCINA IC-2015-02, respectively conducted at Curie Hospital. These studies were approved by the regional ethics board and all patients signed an informed consent form. Sodium-heparinized blood was collected and peripheral mononuclear cells (PBMCs) isolated using a standard Ficoll cell separation protocol. Healthy donor blood samples were obtained from the blood bank in accordance with French institutional regulations.
Lentiviral particle production and titration. A second-generation LV was pro-duced by transfection of HEK-293LTV cell line (Cell Biolabs, Inc) with psPAX2 (packaging plasmid, Addgene), pCMV-VSV-G (envelope plasmid, Addgene) and Luciferase and recombinase Cre-expressing plasmid. The latter was generously provided by Dr. T. Jacks and modified in our laboratory to express the DBY
epitope fused to the C-terminal end of Luciferase protein. Particles were purified
through sucrose cushion as described47. Functional particles were quantified using
a Cre activity readout system based on the reporter cell line 3TZ expressing -galactosidase upon Cre-mediated recombination.
Preventing Luciferase-DBY expression in hematopoietic cells. To restrict the
expression of DBY to the non hematopoietic cell lineage29, four tandem sequences
of 23-bp complementary to the miRNA 142-3p (5′-TCCATAAAGTAGGAAA-CACTACA-3′), were inserted into the 3′untranslated region of Luciferase-DBY fusion protein cassette included in the Cre-expressing plasmid. The 4 × -mirT-142-3p were ligated to the previously digested Cre-expressing plasmid with NotI and XmaI enzymes.
In vitro Luciferase signal detection. U937 human monocytic cell line and
HEK-293LTV human kidney cell line expressing or not miRNA 142-3p respectively29,
were transduced with serial dilutions of lentiviral particles. Luciferase expression was determined after 72 h in cellular lysates, using a Luciferase Reporter Assay (Promega) and expressed as relative light units (RLU) according to the
manu-facturer’s instructions.
In vivo tumor model and immunohistochemistry analyses (IHC). Lung
ade-nocarcinoma was induced in KP mice by intratracheal injection of 2 × 10⁴lentiviral
particles expressing the fusion protein Luciferase-DBY and Cre-recombinase as
described28. In vivo tumor growth was measured by bioluminescence. Briefly,
tumor-bearing mice were shaved and anesthetized with Isoflurane
(Sigma-Aldrich).D-luciferin substrate (150 mg per kg, Promega) dissolved in PBS
was injected i.p. 15 min before imaging in IVIS Spectrum (Perkin Elmer). Photon fluxes were transformed into pseudocolor images using the Living Image software (Perkin Elmer). Early and advanced tumor stages corresponding to 10–12 weeks and 20–24 weeks after lentiviral infection, respectively were validated by IHC
analysis. Lung and TdLN werefixed in 4% paraformaldehyde, dehydrated and
embedded in paraffin. Four µm sections were generated(Thermo Scientific Microtome) and used for further processing.
Sections were stained with Hematoxylin/Eosin, scanned (Philips Ultra Fast Scanner 1.6 RA) and digitally analyzed through a computerized image analyzer system (Philips Digital Pathology Solutions). The number of tumoral foci, their