Compact High-Performance Continuous-Wave
Double-Resonance Rubidium Standard
With 1.4 × 10
−13
τ
−1/2
Stability
Thejesh bandi, christoph affolderbach, camillo stefanucci, Francesco merli, anja K. skrivervik, and Gaetano mileti
Abstract—We present our studies on a compact
high-perfor-mance continuous wave (CW) double-resonance (DR) rubidi-um frequency standard in view of future portable applications. Our clock exhibits a short-term stability of 1.4 × 10⁻¹³ τ −1/2, consistent with the short-term noise budget for an optimized DR signal. The metrological studies on the medium- to long-term stability of our Rb standard with measured stabilities are presented. The dependence of microwave power shift on light intensity, and the possibility to suppress the microwave power shift is demonstrated. The instabilities arising from the vapor cell geometric effect are evaluated, and are found to act on two different time scales (fast and slow stem effects). The resulting medium- to long-term stability limit is around 5.5 × 10⁻¹⁴. Further required improvements, particularly focusing on medium- to long-term clock performance, are discussed.
I. Introduction
c
ompact rubidium (rb) frequency standards form the backbone of today’s satellite navigation systems [1]. recently developed laser-pumped rb cell standards ex-hibit short-term frequency stabilities at least one order of magnitude better than the commercial lamp-pumped standards [2], [3].We are developing a compact laser-pumped high-per-formance rb cell standard exhibiting the perhigh-per-formances of a passive H-maser [4], but with a reduced volume (by a factor of <10), mass (by a factor of <5) and power consumption (by a factor of <4). our rb cell standard is based on the continuous-wave (cW) double-resonance (dr) principle [5], [6]. The cW dr spectroscopy involves two resonant electromagnetic fields that are operated si-multaneously to interrogate the atoms—the optical field to polarize the atoms by optical pumping, and the microwave
field to drive the ground-state hyperfine clock transition that serves as an atomic frequency reference. This cW ap-proach is simple in its operation and requires no acousto-optical modulators (aom), unlike a pulsed-acousto-optical pump-ing (PoP) scheme, and has lower design complexity than cold atom clocks, thereby also reducing the volume of the clock. The PoP method has stringent requirements on the microwave local oscillator phase noise, but these require-ments are less stringent in the cW method. Furthermore, rubidium standards have been tested for reliability in on-board satellite- and deep-space navigation systems [7].
This paper is divided into following sections. section II explains the details of the experimental setup. section III gives the details on the dr signal and short-term stability noise budget. a systematic metrological characterization of the physical effects perturbing the medium- to long-term clock frequency stability, such as the second-order Zeeman shift, light-shifts, microwave power shift, cavity pulling, spin-exchange shift, and the temperature coeffi-cient shifts are presented in section Iv. In section v, we estimate the limits resulting from the vapor cell geomet-ric effect. In section vI, we present the short-, medium-, and long-term frequency stabilities of our rb standard. Finally, in section vII conclusions are drawn, with future prospects required to improve our clock performances.
II. Experimental setup
The details of our experimental clock setup were previ-ously presented in [2] and [5]. The setup consists of three main components, 1) the frequency stabilized compact la-ser head (lH), with overall volume and mass of <0.9 dm3
and <0.6 kg, respectively; 2) the physics package (PP), with overall volume and mass of <0.8 dm3 and <1.4 kg,
respectively; and 3) the low-noise microwave synthesizer (local oscillator, lo), which is presently a rack-mount device. The laser is a distributed feedback (dFb) diode emitting at 780 nm (rb d2 transition). The laser is fre-quency stabilized using an evacuated rb reference cell that is integrated in the lH assembly. Further details on the laser head were reported in [8]. The details on the PP were reported in [5], [6]. The core of this PP consists of a glass cell of 25 mm diameter that contains rb vapor and a mixture of argon and nitrogen buffer gases with a pressure ratio of P(ar)/P(n2) = 1.6. our rb cell has two distinct
parts: the cell volume, where the 87rb vapor is
interro-T. bandi, c. affolderbach, and G. mileti are with the laboratoire Temps-Fréquence (lTF), Institut de Physique, Université de neuchâ-tel, neuchâneuchâ-tel, switzerland (e-mail: [email protected], gaetano. [email protected]).
T. bandi is currently with quantum sciences and Technology Group (qsTG), Jet Propulsion laboratory (JPl), california Institute of Tech-nology, Pasadena, ca.
c. stefanucci, F. merli, and a. K. skrivervik are with the labora-tory of Electromagnetics and acoustics (lEma), École Polytechnique Fédérale de lausanne (EPFl), lausanne, switzerland.
F. merli is currently with the rF division, Huber+suhner aG, Heri-sau, switzerland.
doI http://dx.doi.org/10.1109/TUFFc.2013.005955
gated with laser and microwave to obtain the dr signal, and the cell stem that acts as a reservoir for metallic rb. This cell is situated inside a newly developed compact magnetron-type microwave resonator (volume <45 cm3)
[9]. This resonator assembly is mounted inside a solenoid (c-field coils) to lift the degeneracy of 87rb hyperfine
ground states into their respective Zeeman levels, such that we can selectively interrogate the clock transition: 5
2S
1/2 | Fg = 1, mF = 0〉 ↔ | Fg = 2, mF = 0〉 that has an
unperturbed frequency of νrb = 6834682610.90429(9) Hz [10]. This whole assembly is mounted inside two μ-metal magnetic shields to suppress perturbations caused by ex-ternal magnetic field fluctuations (cf. section Iv-a). The lo module consists of an oven controlled crystal oscillator (ocXo) and the microwave synthesis chain to generate ~6.835 GHz for 87rb clock transition interrogation. The
phase noise of the lo was measured by the cross-correla-tion method. at a carrier frequency of 6.8 GHz, it has a noise level of −70 db·rad2/Hz at 1 Hz Fourier frequency
and a noise floor of −111 db·rad2/Hz from 103 Hz to 2 ×
104 Hz. Further details on the lo including the digital
lock-in and clock loop electronics can be found in [3]. The signal that is detected using a photodetector situated at the exit of the PP is preamplified and fed to a synchro-nous detector that generates an error signal by operating at the modulation frequency fm applied to the ~6.8 GHz output frequency of the lo. This is used to lock the crys-tal oscillator to the atomic resonance frequency. The mod-ulation depth is chosen to be δ = 100 Hz, approximately 30% of the FWHm linewidth of the dr signal (see Fig. 1). once the clock loop is closed, the stabilized 10 mHz output frequency from the lo module is compared with the 10 mHz signal from an active hydrogen maser and the frequency stability is recorded using a computer interface. note that for the dr spectroscopy, the clock loop is not closed; instead, the output from the detector as a function of microwave frequency is directly monitored and recorded using an oscilloscope.
III. dr signals and short-Term stability noise budget
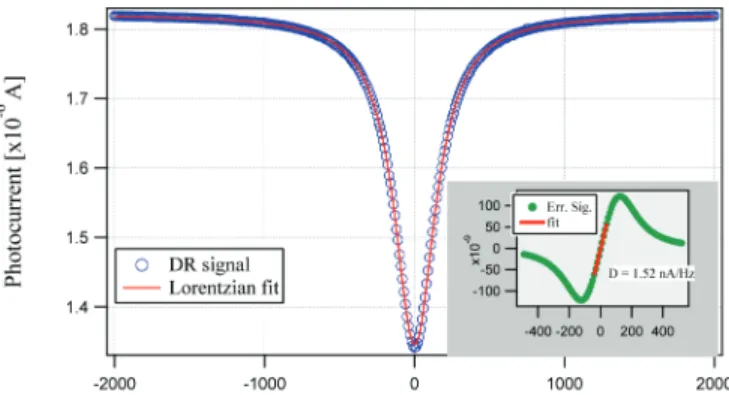
optimized dr signals shown in Fig. 1 were obtained for a laser intensity of 0.46 μW/mm2 and a microwave
input power of −34 dbm.
The dr signal has an amplitude of 0.48 μa, a back-ground level of 1.82 μa, a contrast of 26%, and a line-width (FWHm, Δν1/2) of 334 Hz. The theoretically es-timated intrinsic linewidth of 350 Hz (due to collisional relaxations of buffer gases and cell walls, and the rb-rb spin-exchange relaxation) matches well with the measured value of Δν1/2 = 334 Hz (cf. Fig. 1). The shift of the rb-hyperfine center frequency νrb resulting from buffer gas pressure (2.6 kPa) is measured as 3390 Hz, this is in excellent agreement with theoretically estimated value of 3385 Hz. The error signal corresponding to the dr
lo-rentzian is shown in the inset of Fig. 1. This is obtained by frequency modulating the microwave frequency in the closed clock-loop configuration.
The short-term stability of a passive rubidium frequen-cy standard (1 to 100 s) limited by signal-to-noise (s/n) ratio can be estimated by the formula [2]
σ τ ν τ S/N psd Rb / ( ) = 2 1 2 N D ⋅ ⋅ ⋅ − , (1)
where Npsd is the detection noise
power-spectral-densi-ty when microwave and pump laser are switched on (in closed clock-loop condition) and D is the discriminator slope of the error signal. The measured noise density, Npsd
also includes the contribution of Pm-to-am (phase noise to amplitude noise) laser noise conversion in the clock cell [11], [12].
The detection shot noise is estimated by considering the dc photocurrent, Idc ~ 1.6 μa at FWHm (Δv1/2) of
the dr signal by using the formula Nshot = 2 ⋅ ⋅e Idc,
where e is the charge of an electron. Using (1), we then estimate a shot-noise-limited clock frequency stability of 4.9 × 10⁻¹⁴ τ −1/2. However, the short-term stability of our
clock presently has an s/n limit of ~1.2 × 10⁻¹³, mainly
due to Fm-to-am conversion of laser Fm noise in the atomic vapor [11]. The resulting s/n budget limiting the short-term stability of our clock is presented in Table I.
The final limit, σy(τ ), on short-term stability also must
include the influences resulting from the intermodulation effects on the phase noise of the lo and the laser inten-sity and frequency fluctuations via the light-shifts (ls) (cf. section Iv-b). This can be estimated from sum of the squares of the individual limits by the equation
σ τy( ) = σ ( )τ 2 σ ( )τ 2 σ τ( )2
S/N + PMnoise + LS . (2)
Fig. 1. dr spectroscopic signal with the 25 mm buffer gas cell. It ex-hibits an amplitude A = 0.48 μa, background level Bk = 1.82 μa and contrast C = A/Bk = 26% and linewidth Δν1/2 = 334 Hz. The
micro-wave center frequency was set to 6.834686 GHz that is higher than νrb
by 3390 Hz due to a buffer gas pressure of 2.6 kPa. The inset shows the de-modulated error signal with a discriminator slope of D = 1.52 na/Hz. The microwave synthesizer frequency is stabilized to the center of this curve.
The additional instability arising from the lo Pm noise because of the aliasing effect is estimated by the method described in [13]. at our clock modulation frequency fm =
44 Hz, by considering the even harmonics up to 100 kHz, we estimate the contribution of the phase noise caused by the aliasing effect as σy(τ ) = 7.5 × 10⁻¹⁴ τ −1/2. The total
contribution from the laser intensity and the frequency fluctuations via ls effect is estimated to be σls = 4 ×
10−14, and from Table I, we have σs/n(τ ) = 1.17 × 10⁻¹³.
substituting these values into (2), the overall short-term clock stability is estimated as σy(τ ) ~ 1.4 × 10⁻¹³ τ −1/2.
Iv. medium- to long-Term stability studies various physical perturbations affect the medium- to long-term clock stability. They were measured and evalu-ated, and are presented in this section.
A. Second-Order Zeeman Shift on Clock Transition
although the clock transition is unaffected by the mag-netic field in first-order, the second-order perturbations caused by magnetic field variations give rise to the second-order Zeeman shift [14], and can be written as [15]
∆νZ =A0 B ⋅ ˆz 2, with A0 = 575.14 Hz/G2, (3)
where zˆ is the quantization axis direction. The magnetic field B includes the combination of contributions [15] from the applied quantization magnetic field B0, the residual
field Br, and the field related to the noise of the magnetic
shields Bs. Br is the field that remains even after the
shields are used to suppress the magnitude of an external magnetic field fluctuations. The fluctuations of these terms on clock frequency can be characterized by their respec-tive variances, σ τB0 2 ( ), σ τ Br 2( ), and σ τ Bs 2( ) as [15] σ τy2 Aν0 σ τB σ τB σ τB 2 2 2 2 ( ) = 2 B0 { 0( ) ( ) ( )} ′ + r + s . (4)
Influence on clock instability is analyzed as follows. We apply, typically, a quantization field (c-field) of B0 ≈ 40 mG, and the measured relative stability of this field re-sulting from resonator control electronics is σ∆B B0/ 0( )τ < 10−6 for time averages up to 105 s, which implies σ τ
B0( ) = 40 nG. We measured a residual magnetic field Br ≈
1.3 mG at zero external field and with a measured
shield-ing factor of 3067, we estimate σ τBr( ) ≈ 0.4 μG. From [15] and [16], for our external shield with radius r = 49 mm and thickness t = 0.8 mm, the influence resulting from the magnetic shield noise is estimated as σ τBs( ) ≈ 132 pG. From (4), and these values, the total influence resulting from magnetic variations on clock frequency resulting from second-order magnetic variation is σy(τ ) ≈ 2.7 ×
10−15 up to τ = 105 s; however, this value could degrade
to the level of 10−14 in perturbed geomagnetic conditions. B. Intensity and Frequency Light Shifts (LS)
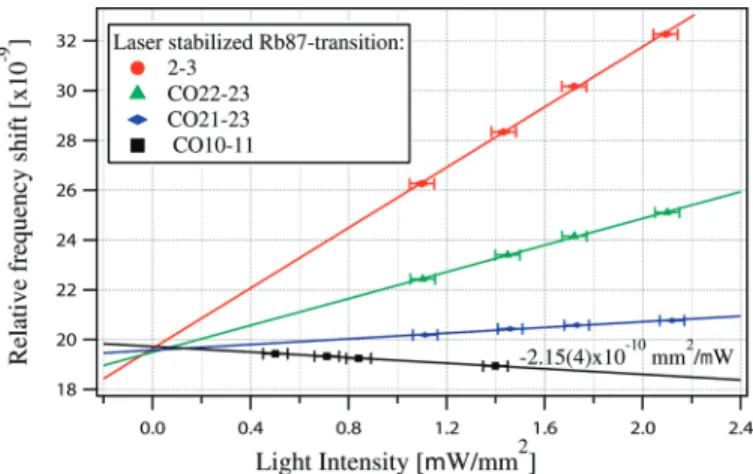
a theoretical description of the light shift (ac stark shift) can be found in [17] and [18]. at a fixed laser fre-quency (i.e., when we stabilize our laser to a particular sub-doppler transition), the clock frequency shift was measured as a function of the input laser intensity to get the intensity ls coefficient, α [18]. This method was re-peated by stabilizing to different sub-doppler transitions as shown and explained in Fig. 2. The clock frequency shift (y-scaling) is in relative frequency units, normalized to the nominal clock frequency. For the transition | Fg =
1〉 → | Fe = 01cross-over〉, we measured the lowest
inten-sity light shift coefficient, |α | = 2.15 × 10⁻¹⁰ mm2/μW =
1.46 Hz·mm2/μW.
Furthermore, when the laser intensity was kept con-stant, the clock frequency shift was measured as a func-tion of laser frequency, which gives the frequency ls coef-ficient, β [18].
by fixing the laser intensity, the value of β is evalu-ated as the slope of the line fits shown in Fig. 3(a). The frequency ls coefficient can be suppressed in the pulsed mode [19]. In the cW operation discussed here, it is not possible to completely suppress β, but the influence can be reduced by operating at low light intensities as shown in Fig. 3(b), with a linear dependence of β on Il. our
measurements showed that the dependence of β on laser input intensity has a slope of 184 mHz/mHz·mm2/μW.
TablE I. short-Term noise budget of the 25-mm-cell clock. source noise (pA/ Hz) Instability σinst(τ ) τ −1/2 detector noise 0.362 2.5 × 10⁻¹⁴ microwave noise 0.74 5.1 × 10⁻¹⁴
laser noise (microwave off) 1.46 1 × 10⁻¹³
Total s/n (calculated) 1.68 1.15 × 10⁻¹³
Total, s/n (measured) (clock loop noise) 1.7 1.17 × 10⁻¹³
Fig. 2. clock frequency shift as a function of laser intensity for the laser frequency stabilized to different rb sub-doppler transitions: 2–3: |Fg =
2〉 → |Fe = 3〉, co22–23: |Fg = 2〉 → |Fe = 2,3cross-over〉, co21–23: |Fg
= 2〉 → |Fe = 1,3cross-over〉, and co10–11: |Fg = 1〉 → |Fe =
at our input laser intensity Il = 0.46 μW/mm2, we get a
frequency ls coefficient value of β = 1.2 × 10⁻¹⁷ Hz−1 (or
82 mHz/mHz), and its effect on clock frequency instabil-ity is evaluated in Table II.
C. Microwave Power Shift and Dependence on Light Intensity
In the optical-microwave dr interrogation scheme us-ing buffer-gas cells, the microwave power shift is an un-avoidable phenomenon because the atoms are relatively well-confined in space during the microwave interaction, thereby causing the detected overall signal to be an inho-mogeneous integration over the occurring spatial gradients [14], [20], [21]. It can be attributed to the microwave mag-netic field distribution (spatial mode) inside the cavity. The observed shift is a weighted average of the ensemble of atoms that is dependent on each atom’s position inside the cell. Therefore, in a buffer gas cell, the light shift var-ies along the path of the light beam—and possibly even across its profile—thereby causing inhomogeneous broad-ening and shifts of the resonance signal [14], that can also be influenced by residual gradients in the static magnetic c-field [22]. Hence, in a dr signal, we can say that the measured resonance frequency is a function of the applied microwave (rF) power. This inhomogeneity causes a shift on the clock hyperfine frequency and is termed the power shift, |μ Ps |. The observed shift is dependent on the light intensity and mimics the light shift behavior, known as the pseudo-light-shift effect [19]. although the observed effects have been treated with numerical analysis and some theoretical approaches were undertaken [23], [24], a detailed theory that gives a complete picture still must be formalized. In this work, we focus our studies on evalu-ating the observed shift and its influence on the clock’s stability.
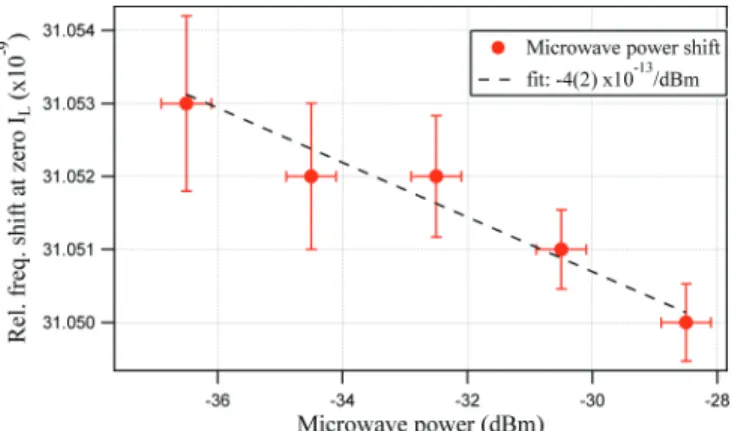
The μ Ps was measured in the following method. at each fixed microwave power injected to the cavity, the clock frequency shift was measured as a function of laser intensity. Then, the light-shift free value, meaning the pure microwave power shift value, was extracted by extrapolat-ing to zero laser intensity, Il. These extracted shift values at each microwave input power are plotted in Fig. 4, the
slope (−4 × 10⁻¹³/dbm) gives the pure microwave power
shift on the clock frequency. Its effect on medium- to long-term clock frequency is evaluated in Table II.
In addition, we evaluate the dependency of |μ Ps | on the input light intensity. at a reduced intensity ls coefficient of 1.47 Hz·mm2/μW, the dependency of microwave Ps
co-efficient (in Hz/dbm) on the interrogating light-intensity
Il is well pronounced, as shown in Fig. 5. For instance, at
Fig. 3. (a) clock frequency shift as a function of laser frequency, and (b) the frequency light-shift coefficient, β, as a function of input laser intensity.
TablE II. summary of Instability contributions From Physical Perturbations on the clock Transition for medium- to long-Term Time scales.
Physical effect coefficient variation Instability at 104 s
Intensity ls effect, |α | 1.47 Hz·mm2/μW 4.6 × 10⁻⁵ μW/mm2 9.9 × 10⁻¹⁵ Frequency ls effect, |β | 82 mHz/mHz <3.1 kHz 3.7 × 10⁻¹⁴ microwave Ps, |μPs| 15.3 mHz/μW 0.4 × 10⁻³ μW 8.9 × 10⁻¹⁶ cell volume Tc |Tcv| 1 × 10⁻¹²/K 3.5 mK 3.5 × 10⁻¹⁵ (linear fit) cell volume Tc |Tcv| 4.34 × 10⁻¹²/K2 3.5 mK2 5.3 × 10⁻¹⁷ (quadratic fit) stem Tc |Tcs| 1.22 × 10⁻¹¹/K 4.6 mK 5.6 × 10⁻¹⁴
spin exchange shift |TcsE| <5 × 10⁻¹²/K ~5 mK <2.3 × 10⁻¹⁴
cavity pulling |ΔνcP| <3.2 × 10⁻¹⁴/K ~5 mK <1.6 × 10⁻¹⁶
an input laser intensity of ≈0.1 μW/mm2, one can
sup-press the effect of microwave power shift in cW operation.
D. Temperature Coefficients (TCs)
Temperature dependence in buffer gas vapor cells arises because of the 87rb-buffer gas collisions [14]. a mixture
of buffer gases can be used to reduce the temperature coefficient. We use an appropriate mixture of argon (ar) and nitrogen (n2) as buffer gases. While n2 produces the necessary fluorescence quenching, ar counter-balances the Tc of nitrogen. moreover, ar has a negative linear temperature coefficient, whereas nitrogen has a positive linear temperature coefficient and because of their (much smaller) quadratic temperature coefficients, the mixture of these two at a certain temperature can give, in principle a zero (or inversion point) temperature coefficient [14], [25]. The equation that dictates this methodology can be writ-ten as [14], [25]
∆νBG( ) =T νRb+Pt(β′+δ′∆T +γ′∆T2), (5) where Pt = PN2 + Par is the total gas pressure, and ΔT =
T − T0 is the difference between the working temperature
and the reference temperature for which the coefficients are measured. note that the total gas pressure Pt might
vary during the cell sealing [25]. β′, δ ′, γ ′ are the pressure coefficient, the linear temperature coefficient, and the qua-dratic temperature coefficient of the mixture, respectively, for the gas mixture. Furthermore, β′ = (βN2 + rβar)/(1 +
r), δ ′ = (δN2 + rδar)/(1 + r), and γ ′ = (γN2 + rγar)/(1 +
r), with r as the pressure ratio P PAr/ N2. at a total pressure
Pt of 2.6 kPa (typical in our case), the offset shift on νrb is calculated as β′ × Pt = 3385 Hz (see Fig. 1 for the mea-sured value).
When the stem temperature Ts was fixed (321K), a temperature coefficient value for the cell volume tempera-ture (Tv) of Tcv = −1(1) × 10−12/K has been achieved
at the inversion temperature point (336K) by a linear fit (cf. Fig. 6), and the quadratic Tc gives a value of −4.34 × 10⁻¹²/K2.
The temperature coefficient was also measured as a function of the stem temperature Ts (cf. Fig. 7). at a fixed Tv of 336K, we get a slope of +1.22 × 10⁻¹¹/K. The
limits on the clock stability resulting from these tempera-ture coefficients are evaluated and presented in Table II.
The stem Tc effect is a factor of ten higher than the cell volume Tc effect. The use of buffer gas mixtures helps
Fig. 4. microwave power shift. The y-scaling shows relative frequency shift.
Fig. 5. microwave power shift dependence on the input laser intensity.
Fig. 6. Temperature coefficient of the cell volume.
Fig. 7. Temperature coefficient as a function of stem temperature variation.
only to reduce the Tc in the cell volume but not for the stem Tc. Further studies were done to vindicate the effect caused by the stem Tc (see section v).
E. Spin-Exchange Shift
as explained before, the spin-exchange collisions not only cause the line broadening, they also produce a small phase shift of the oscillating atomic magnetic moment, re-sulting in an average frequency shift of the clock transition [15], [26], [27], given as
∆νSE =−81πnvs seλ ∆, (6) where λse (= 6.9 × 10⁻¹⁵ cm2 for 87rb [26], [27]) is the
frequency-shift-related collisional cross-section, and Δ is the population difference between the two hyperfine clock levels [26], [27]. The value and sign of Δ thus depends on the optical pumping condition in which the atomic sample is prepared for clock operation, i.e., whether the optical pumping is done from either 5 2S
1/2 Fg = 1 or Fg = 2 [26],
[27]. For example, consider that the atoms are pumped from the Fg = 1 state, in which case Δ = +1/5, but if the atoms are pumped from the Fg = 2 state, Δ = −1/3 [26], [27]. The mean velocity between the two colliding rb atoms with reduced mass μ, inside the cell volume with a temperature Tv can be calculated by the formula
vs = 8k TB⋅ v/πµ, (7) where kb is the boltzmann constant.
The spin-exchange frequency shift that is dependent on local temperature of the stem Ts in an operating range
that changes the atomic density correspondingly can be calculated by the formula [26], [27]
TCSE SE Rb = δ δ ν ν ∆
(
)
Ts . (8)at an operating cell volume temperature Tv = 336K, vs ≈ 2.86 × 104 cm·s−1. at the stem temperature of T
s =
321K, the rb atomic density n = 2 × 1011 cm−3. For the
condition in which atoms are pumped from Fg = 1 state, Δ = +1/5. Therefore, with these values in (6), one gets an absolute shift of ΔνsE ≈ −0.3 Hz or (ΔνsE)/ νrb = −4.6 × 10⁻¹¹. For the dependence on stem temperatures in our
operating range around 321K, we can consider that the rb density increases by 10% per kelvin, and thus we cal-culate TcsE ≈ −5 × 10⁻¹²/K. This value is about a factor
of two smaller than the observed stem Tc shift of Tcs = 1.22 × 10⁻¹¹/K (cf. Fig. 7) and also has an opposite
coef-ficient. We call the observed stem Tc effect, which is not due to rb density changes, the stem fast effect and ana-lyze it by attributing it to the geometrical effect of the cell and stem as discussed and quantified in section v.
F. Cavity Pulling Shift
In a dr-based rb standard, the vapor cell containing the atoms and buffer gases is placed inside a microwave cavity. because of the feedback of the cavity on the atoms, any detuning Δνc of the cavity from νrb causes a cavity pulling effect. The cavity pulling shift can therefore be written as [14]
∆νCP c ∆ν
a c
≈QQ (1C+S) , (9)
where Qc is the quality factor of the cavity, and Qa = νrb/ (Δν1/2) is the atomic quality factor with the dr signal full-width at half-maximum Δν1/2. C ≈ 10−2 [14] is a
pa-rameter dependent on oscillation threshold, S = 2 is the saturation parameter for which the discriminator slope D is maximum, and Δνc is a function of temperature. There-fore, if the temperature varies, the cavity frequency also shifts, and so does Δνc, which implies that ΔνcP changes accordingly, influencing the clock frequency.
For our magnetron-type cavity used in this work, we measured a Q-factor of ≈185 [9] for the loaded cavity (af-ter a few months of continuous operation), and the atomic
Q-factor Qa ≈ 2 × 10⁷ (from Fig. 1). There might be a
degradation of cavity-Q because of migration of metallic rb [28], but this effect was not studied here. The mea-sured temperature sensitivity shift of the cavity’s reso-nance frequency is (Δνc)/(ΔT ) < +7 kHz/K. Therefore, the temperature dependent cavity pulling shift is estimat-ed to be (ΔνcP)/(ΔT ) ≤ 3.2 × 10⁻¹⁴/K.
G. Medium- to Long-Term Perturbations Summary and Contribution on Clock Instability
In Table II, all the preceding detailed perturbing ef-fects are summarized along with their contributions to the clock’s medium- to long-term instability at 104 s.
From Table II, it is clear that presently the limiting perturbations in reaching the level of 1 × 10⁻¹⁴
(equiva-lent to reach a timing accuracy <1 ns/day) are the fre-quency ls effect |β | and the stem Tc |Tcs|. It is possible to reduce the effect of |β | on clock frequency instability by operating our clock at lower input light intensities as explained in section Iv-b. However, we found that the stem Tc arises because of our vapor cell geometric effect, as explained in section v.
v. vapor cell Geometric Effects
A. Stem Fast Effect
as mentioned in section II, our rb cell has two distinct parts; the cell volume, where the 87rb vapor is
interrogat-ed with laser and microwave to get the dr signal, and the cell stem that acts as reservoir for metallic rb, as shown
in Fig. 8. The stem is also useful to better control the density of rb inside the cell volume, and helps to increase the operational lifetime of the clock.
as pointed out recently by calosso et al. [29], a simple model of the ideal gas law suggests that the temperature fluctuations in the stem result in redistribution of buffer gas particles in the entire cell; they call this effect en-hanced temperature sensitivity (ETs). This effect is due to the buffer gas density redistribution between the cell body and the stem volumes, which is purely a geometrical effect. The stem part stays outside the microwave cavity, and hence does not contribute in the microwave interro-gation. In other words, one can say that the temperature gradient between the cell volume and the stem is respon-sible for this geometric effect. We quantify this fast stem effect according to [29] as ∂ ∂ ⋅ ′ ′ ν ν ν s Rb s s Rb s s / T =n a0 Tv , (10)
where the total volume of the cell (including stem and cell body) is given as V = Vs + Vc, defining vs = Vs/V and the average buffer gas density ns = N/V. νs is the fast shift of clock frequency, in hertz. νRb′ is the center frequency of the dr signal. Ts is the stem operational temperature. In
our case, at the cell filling temperature of 293K with a total buffer gas pressure of 2.6 kPa, we have ns ≈ 1.5 × 10¹⁷/cm3 and vs = 0.029. From [29], the a0′, denotes the
buffer gas mixture in the cell volume and is related to β′ coefficient in (5) and is estimated as ≈5 × 10⁻¹⁵ Hz·cm3.
Using these values in (10), we obtain ∂(νs/νrb)/∂Ts ≈ 1.1 × 10⁻¹¹/K, in good agreement with the measured
value of stem temperature coefficient Tcs (cf. Fig. 7). It is clear from (10) that by reducing the stem volume vs (e.g., the reservoir length), one can reduce the fast stem effect, as also was pointed out in [29].
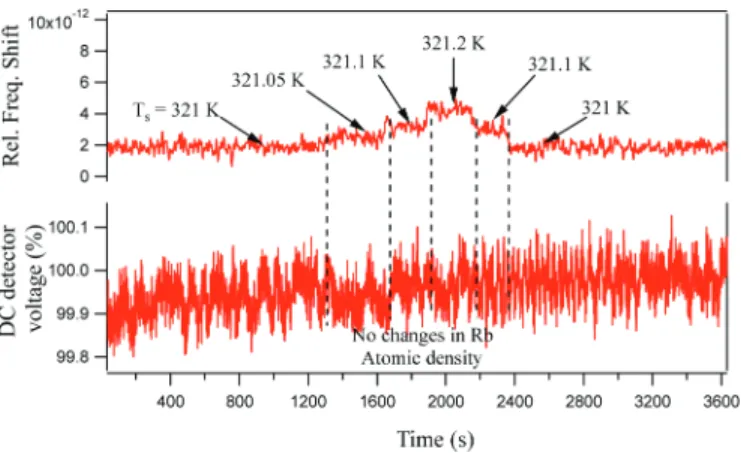
an experimental validation of the fast stem effect is shown in Fig. 9. It is evident that by changing the stem temperature, Ts, the clock frequency is affected, but the
87rb density in the clock cell (measured by the dc
detec-tor voltage in Fig. 9) does not change significantly (here by <0.1%). If the observed frequency shift was due to a
temperature-related change in rb density (of 10%/K, see section Iv-E), one would expect to also observe an ap-proximately 2% change in detector voltage, which is not the case here.
note that in [29], calosso et al. operate their phys-ics package under vacuum in well-controlled laboratory conditions; the stability level of their active temperature control is 100 μK, whereas in our case (in air, or ambient laboratory conditions) this was measured to be 4.6 mK (a factor of 46 higher).
B. Stem Slow Effect
Further investigation was done to quantify the effect of stem temperature on the clock frequency instability over a period of one day or more. by keeping the cell volume temperature Tv constant at 336K, the stem temperature Ts was changed from 330K to 323K and the
transmit-ted intensity through the clock cell along with the clock frequency were recorded (cf. Fig. 10). The fast (almost instantaneous) and the slow (over one day) stem tem-perature coefficients are clearly demonstrated, where, for instance, the light-shift and the microwave power shift re-lated effects are roughly one order of magnitude smaller than the observed clock frequency changes. The fast stem effect is due to stem geometric influence, as discussed in section v-a.
In Fig. 10, note the absence of the fast effect in dc de-tector voltage, substantiating that there is no fast change in rb atomic density in the cell volume after a change in stem temperature Ts, thus indicating that this effect
is due to buffer gas atoms. after the initial temperature step, the negative offset in clock frequency caused by the fast effect persists, but is slowly compensated by the slow effect that shows a frequency change of opposite sign. The fast effect also contributes residual frequency variations on the level of <10−13 resulting from temperature
fluc-tuations in our setup of δTs ≈ 5 mK at timescales up to
Fig. 8. vapor cell filled with 87rb and mixture of buffer gases. The stem
serves as reservoir for metallic rb. The cell volume, Vc, where 87rb
vapor interacts with laser and microwave radiation is situated inside a microwave cavity resonator.
Fig. 9. Impact of changes in Ts on clock frequency. dashed vertical lines
represent the times at which the temperature of the stem was changed. note that there is no effect on the laser intensity passing through the clock cell (denoted the dc detector voltage level, with 100% corre-sponding to 378 mv here). during these measurements, Tv was kept
few hours (cf. Table II and section vI). However, these variations are 3 orders of magnitude smaller than the ap-plied temperature step and resulting frequency excursion, and thus are not visible in Fig. 10. The slow stem effect has a time constant of ~1.3 d (30 h) and for any change in stem temperature, the rb atomic density in the cell volume takes about 4 d to reach equilibrium. In our clock conditions, an ultimate steady state is hardly ever reached because of faster (though small) thermal fluctuations on the stem temperature control, such as diurnal cycles. The effect shown in Fig. 10 over a period of 1 d timescale can thus have an influence on the clock frequency stability, by influencing the density of the rb atoms in the cell. The clock stability limitations resulting from the slow and fast effect could be improved by 1) improved stem temperature control and/or 2) a better thermal isolation of the PP (for example, by operating the PP inside a vacuum chamber).
vI. measured clock stability
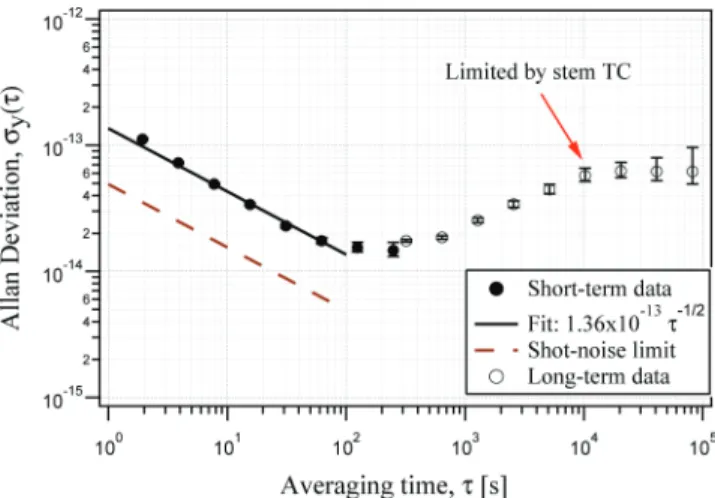
our clock was operated in typical ambient laboratory conditions, in air and not under vacuum. Fig. 11 shows the measured short-term frequency data in terms of allan deviation, exhibiting a stability level of 1.36 × 10⁻¹³ τ 1/2.
at longer integration times, stability is limited at 104 s to
5.7(6) × 10−14. This is in excellent agreement with the
es-timated limit resulting from the stem temperature coeffi-cient, |Tcs| (see Table II), which is attributed to the cell’s geometric effect. a small linear drift of +1.2 × 10⁻¹³/day
has been removed.
vII. conclusions
We have presented the performance evaluation of a high-performance cW dr clock, using a rb buffer gas cell in a custom-designed microwave resonator cavity. dr spectroscopic and metrological studies affecting the clock’s medium- to long-term frequency stability were presented. The combined volume of our lH and PP is <1.7 dm3,
with a total mass of <2 kg. our clock exhibits s/n-limited short-term stability of <1.4 × 10⁻¹³ τ 1/2, this is in
agree-ment with the estimated short-term noise budget, whose main limitation arises from the laser noise.
metrological studies on medium- to long-term perturb-ing effects were studied in detail and were presented. The microwave power shift and its dependence on laser inten-sity, especially at reduced ls coefficient condition, was demonstrated. We have shown that the frequency ls coef-ficient (β ) could be reduced by operating at lower laser input intensities. The clock’s stability at 104 integration
time is presently limited around 5.5 × 10⁻¹⁴ because of
the stem Tc, which is characterized as the vapor cell geo-metric effect. by reducing the volume of the stem, we foresee minimization of the geometric effect; furthermore, by operating our PP under vacuum we could reach stabil-ity levels below 1 × 10⁻¹⁴ as demonstrated for the
pulsed-optical-pumping (PoP) clock [3], but without the need for pulsed operation.
acknowledgments
We thank c. E. calosso (InrIm, Italy) for the micro-wave synthesizer (lo). We thank F. Gruet (laser head), m. Pellaton (vapor cells), P. scherler (cad and PP), and m. dürrenberger (electronics) for their technical support.
references
[1] l. a. mallette, P. rochat, and J. White, “Historical review of atom-ic frequency standards used in space systems—10 year update,” in
38th Annu. Precise Time and Time Interval (PTTI) Meeting, 2006,
pp. 69–80. Fig. 10. clock frequency and transmitted light through the clock cell,
after a temperature step of the resonance cell stem. The fast and slow stem effects are demonstrated. The slow stem effect has a time constant of 1.3 d. note the absence of the fast effect in dc detector voltage sub-stantiating that there is no fast change in rb atomic density in the cell volume.
Fig. 11. allan deviation showing the clock’s short-term stability of 1.36 × 10⁻¹³ τ −1/2 and a shot-noise limit of 4.9 × 10⁻¹⁴ τ −1/2. The limit
resulting from stem Tc on medium- to long-term time scales around 5.5 × 10⁻¹⁴ is seen.
[2] T. bandi, c. affolderbach, c. E. calosso, and G. mileti, “High-performance laser-pumped rubidium frequency standard for satellite navigation,” Electron. Lett., vol. 47, no. 12, pp. 698–699, 2011. [3] s. micalizio, c. E. calosso, a. Godone, and F. levi,
“metrologi-cal characterization of the pulsed rb clock with opti“metrologi-cal detection,”
Metrologia, vol. 49, no. 4, pp. 425–436, 2012.
[4] P. rochat, F. droz, P. mosset, G. barmaverain, q. Wang, d. bov-ing, l. mattioni, m. belloni, m. Gioia, U. schmidt, T. Pike, and F. Emma, “The onboard Galileo rubidium and passive maser, status & performance,” in Proc. IEEE Int. Frequency Control Symp., 2005, pp. 26–32.
[5] T. bandi, c. affolderbach, c. stefanucci, F. merli, a. K. skriver-vik, c. E. calosso, and G. mileti, “laser-pumped high-performance compact gas-cell rb standard with <3 × 10⁻¹³ τ −1/2 stability,”
in Proc. European Frequency and Time Forum (EFTF), 2012, pp. 494–496.
[6] T. bandi, m. Pellaton, d. miletic, c. affolderbach, F. Gruet, r. matthey, c. stefanucci, m. violetti, F. merli, J.-F. Zürcher, a. K. skrivervik, and G. mileti, “double-resonance in alkali vapor cells for high performance and miniature atomic clocks,” in Proc. IEEE Int.
Frequency Control Symp., 2012, pp. 686–691.
[7] l. a. mallette, P. rochat, and J. White, “an introduction to satel-lite based atomic frequency standards,” in IEEE Aerospace Conf., 2008, pp. 1–9.
[8] F. Gruet, m. Pellaton, c. affolderbach, T. bandi, r. matthey, and G. mileti, “compact and frequency stabilized laser heads for ru-bidium atomic clocks,” in Proc. Int. Conf. Space Optics, 2012, no. 48. [9] c. stefanucci, T. bandi, F. merli, m. Pellaton, c. affolderbach, G.
mileti, and a. K. skrivervik, “compact microwave cavity for high performance rubidium frequency standards,” Rev. Sci. Instrum., vol. 83, no. 10, art. no. 104706, 2012.
[10] s. bize, y. sortais, m. s. santos, c. mandache, a. clairon, and c. salomon, “High-accuracy measurement of the 87rb ground-state
hyperfine splitting in an atomic fountain,” Europhys. Lett., vol. 45, no. 5, pp. 558–564, 1999.
[11] J. c. camparo, “conversion of laser phase noise to amplitude noise in an optically thick vapor,” J. Opt. Soc. Am. B, vol. 15, no. 3, pp. 1177–1186, 1998.
[12] J. G. coffer, m. anderson, and J. c. camparo, “collisional dephas-ing and the reduction of laser phase-noise to amplitude-noise conver-sion in a resonant atomic vapor,” Phys. Rev. A, vol. 65, no. 3, art. no. 033807, 2002.
[13] J. q. deng, G. mileti, r. E. drullinger, d. a. Jennings, and F. l. Walls, “noise considerations for locking to the center of a lorentzian line,” Phys. Rev. A, vol. 59, no. 1, pp. 773–777, 1999.
[14] J. vanier and c. audoin, The Quantum Physics of Atomic Frequency
Standards, vol. 1, bristol, UK: adam Hilger, 1989.
[15] s. micalizio, a. Godone, F. levi, and c. calosso, “medium-long term frequency stability of pulsed vapor cell clocks,” IEEE Trans.
Ultrason. Ferroelectr. Freq. Control, vol. 57, no. 7, pp. 1524–1534,
2010.
[16] T. W. Kornack, s. J. smullin, s.-K. lee, and m. v. romalis, “a low-noise ferrite magnetic shield,” Appl. Phys. Lett., vol. 90, no. 22, art. no. 223501, 2007.
[17] b. s. mathur, H. Tang, and W. Happer, “light shifts in the alkali atoms,” Phys. Rev., vol. 171, no. 1, pp. 11–19, 1968.
[18] c. affolderbach, c. andreeva, s. cartaleva, T. Karaulanov, G. mileti, and d. slavov, “light shift suppression in laser optically-pumped vapour-cell atomic frequency standards,” Appl. Phys. B, vol. 80, no. 7, pp. 841–848, 2005.
[19] s. micalizio, a. Godone, F. levi, and c. calosso, “Pulsed opti-cally pumped 87rb vapor cell frequency standard: a multilevel ap-proach,” Phys. Rev. A, vol. 79, no. 1, art. no. 013403, 2009. [20] G. mileti, I. ruedi, and H. schweda, “line inhomogeneity effects
and power shift in miniaturized rubidium frequency standards,” in
Proc. 6th European Frequency and Time Forum, 1992, pp. 515–519.
[21] a. risely and G. busca, “Effect of line inhomogeneity on the fre-quency of passive rb87 frefre-quency standards,” in Proc. 32nd Annu.
Symp. Frequency Control, 1978, pp. 506–513.
[22] a. risley, s. Jarvis, and J. vanier, “The dependence of frequency upon microwave power of wall-coated and buffer-gas-filled gas cell rb87 frequency standards,” J. Appl. Phys., vol. 51, no. 9, pp. 4571– 4576, 1980.
[23] J. camparo, r. Frueholz, and c. volk, “Inhomogeneous light shift in alkali-metal atoms,” Phys. Rev. A, vol. 27, no. 4, art. no. 19194, 1983.
[24] J. camparo and r. Frueholz, “a three-dimensional model of the gas cell atomic frequency standard,” IEEE Trans. Ultrason. Ferroelectr.
Freq. Control, vol. 36, no. 2, pp. 185–190, 1989.
[25] J. vanier, r. Kunski, n. cyr, J. y. savard, and m. Tetu “on hy-perfine frequency shifts caused by buffer gases: application to the optically pumped passive rubidium frequency standard,” J. Appl.
Phys., vol. 53, no. 8, pp. 5387–5391, 1982.
[26] s. micalizio, a. Godone, F. levi, and J. vanier, “spin-exchange fre-quency shift in alkali-metal-vapor cell frefre-quency standards,” Phys.
Rev. A, vol. 73, no. 3, art. no. 033414, 2006.
[27] s. micalizio, a. Godone, F. levi, and J. vanier, “Erratum: spin-exchange frequency shift in alkali-metal-vapor cell frequency stan-dards,” Phys. Rev. A, vol. 74, no. 5, art. no. 059905, 2006.
[28] J. coffer, G. sickmiller, and J. camparo, “cavity-q aging observed via an atomic-candle signal,” IEEE Trans. Ultrason. Ferroelectr.
Freq. Control, vol. 51, no. 2, pp. 139–145, 2004.
[29] c. E. calosso, a. Godone, F. levi, and s. micalizio, “Enhanced temperature sensitivity in vapor-cell frequency standards,” IEEE
Trans. Ultrason. Ferroelectr. Freq. Control, vol. 59, no. 12, pp. 2646–
2654, 2012.
Thejesh Bandi received a master’s degree in
physics in 2004 from Kuvempu University (India), and a master’s by research degree in quantum op-tics in 2008 from the cork Institute of Technolo-gy/Tyndall national Institute, cork, Ireland. From 2004 to 2006, he was a research Fellow at the Indian Institute of science (IIsc), bengaluru, India. In 2008, he joined the laboratoire Temps-Fréquence at the University of neuchâtel, neuchâ-tel, switzerland, where he was involved in devel-oping high-performance laser-pumped rb clocks, using wall-coated cells and buffer-gas cells and custom-developed micro-wave resonators. He received the Ph.d. degree in physics from the Uni-versity of neuchâtel in 2013. currently, he is a postdoctoral fellow at nasa’s Jet Propulsion laboratory (JPl), california Institute of Tech-nology, Pasadena, ca. His research interests include atomic and molecu-lar spectroscopy and frequency standards.
Christoph Affolderbach received his diploma
and Ph.d. degrees, both in physics, from bonn University, Germany, in 1999 and 2002, respec-tively. From 2001 to 2006, he was a research scien-tist at the observatoire cantonal de neuchâtel, neuchâtel, switzerland. In 2007, he joined the laboratoire Temps-Fréquence at the University of neuchâtel, neuchâtel, switzerland, as scientific collaborator. His research interests include the de-velopment of stabilized diode laser systems, atom-ic spectroscopy, and vapor-cell atomatom-ic frequency standards, in particular, laser-pumped high-performance atomic clocks and miniaturized frequency standards.
Camillo Stefanucci received the joined m.sc.
degree in micro- and nanotechnologies for inte-grated systems in 2011 from the Polytechnic Uni-versity of Turin, Italy; the Grenoble Institute of Technology (InPG), France; and the swiss Fed-eral Institute of Technology (EPFl), switzerland; and the m.sc. degree in electronics engineering in 2012 from the Polytechnic University of milan. He is currently working toward the Ph.d. degree in microsystems and microelectronics at the elec-tronics laboratory (Elab) of EPFl. His current research interests include substrate noise modeling, cmos Ic design, and Esd protection analysis.
Francesco Merli received the laurea degree
(cum laude) in telecommunication engineering from the University of Florence, Florence, Italy, in 2006 and the Ph.d. degree in electrical engineer-ing from Ecole Polytechnique Fédérale de laus-anne (EPFl), lauslaus-anne, switzerland, in 2011. He is currently with the r&d antenna group, rF division, at Huber+suhner aG, Herisau, switzer-land. His research interests include antenna theo-ry with particular focus on implantable and ultra-wideband antennas, antenna arrays for point-to-point communications, spherical wave analysis, biomedical ap-plications, wireless sensing, and atomic watch cavities.
Anja K. Skrivervik received the electrical
engi-neering degree and the Ph.d. degree from the Ecole Polytechnique Fédérale de lausanne (EPFl), lausanne, switzerland, in 1986 and 1992, respectively. after a period at the University of rennes, rennes, France, and in industry, she returned to EPFl as an assistant Professor in 1996, where she is currently a Professeur Titulai-re. Her teaching activities include courses on mi-crowaves and on antennas. Her research activities
include electrically small antennas, multifrequency and ultra-wideband antennas, and numerical techniques for electromagnetic and microwave and millimeter-wave microelectromechanical systems (mEms). she is the author or coauthor of more than 100 scientific publications. she is very active in European collaboration and European projects.
dr. skrivervik is currently the chairperson of the swiss International scientific radio Union, the swiss representative for European coopera-tion in science and Technology accoopera-tion 297, and a member of the board of the center for High speed Wireless communications of the swedish Foundation for strategic research.
Gaetano Mileti received his engineering degree
in physics from the EPFl (switzerland) in 1990 and the Ph.d. degree in physics from the neuchâ-tel University in 1995. From 1991 to 1995 and from 1997 to 2006, he was a research scientist at the observatoire cantonal de neuchâtel. From 1995 to 1997, he was at nIsT, boulder (co). In 2007, he co-founded the laboratoire Temps-Fre-quence (lTF) at the University of neuchâtel, where he is deputy director and associate profes-sor. His research interests include atomic spectros-copy, stabilized lasers, and frequency standards.