HAL Id: halshs-00654629
https://halshs.archives-ouvertes.fr/halshs-00654629
Submitted on 3 Mar 2014
HAL is a multi-disciplinary open access archive for the deposit and dissemination of sci-entific research documents, whether they are pub-lished or not. The documents may come from teaching and research institutions in France or abroad, or from public or private research centers.
L’archive ouverte pluridisciplinaire HAL, est destinée au dépôt et à la diffusion de documents scientifiques de niveau recherche, publiés ou non, émanant des établissements d’enseignement et de recherche français ou étrangers, des laboratoires publics ou privés.
Public Employment and Political Pressure: The Case of
French Hospitals
Andrew E. Clark, Carine Milcent
To cite this version:
Andrew E. Clark, Carine Milcent. Public Employment and Political Pressure: The Case of French Hospitals. Journal of Health Economics, Elsevier, 2011, 30 (5), pp.1103-1112. �10.1016/j.jhealeco.2011.07.007�. �halshs-00654629�
Public Employment and Political Pressure: The Case of French Hospitals
A
NDREWE. C
LARK ANDC
ARINEM
ILCENT*
Paris School of Economics and IZA; Paris School of Economics
July 2011
Abstract
This paper uses an unusual administrative dataset covering the universe of French hospitals to consider hospital employment: this is consistently higher in public hospitals than in Not-For-Profit (NFP) or private hospitals, even controlling for a number of measures of hospital output. NFP hospitals serve as a benchmark, being very similar to public hospitals, but without political influence on their hiring. Public-hospital employment is positively correlated with the local unemployment rate, whereas no such relationship is found in other hospitals. This is consistent with public hospitals providing employment in depressed areas. We appeal to the Political Science literature and calculate local political allegiance, using expert evaluations on various parties’ political positions and local election results. The relationship between public-hospital employment and local unemployment is stronger the more left-wing the local municipality. This latter result holds especially when electoral races are tight, consistent with a concern for re-election.
JEL Classification Codes: D21, D72, I18, J21.
Keywords: Hospitals, Public Employment, Unemployment, Political Preferences.
* Corresponding Author: Carine Milcent, PSE, 48 Boulevard Jourdan, 75014 Paris, France. Tel: +33-1-43-13-63-21; E-mail: milcent@pse.ens.fr. We are grateful to Petri Böckerman, Florence Goffette-Nagot, Kristiaan Kerstens, Florian Mayneris, Michael McDonald, Philippe Méhaut, Meinhard Moschner, Andrew Oswald, Nicolas Sauger, Andrei Shleifer, Alois Stutzer and Paul Warwick for help and suggestions. We also thank the Editor and two anonymous referees for pertinent comments that greatly improved the paper, and seminar participants at Lyon 2, the PAI-UAP Workshop on Public Economics (Namur) and Rennes 1 for useful remarks.
Public Employment and Political Pressure: The Case of French Hospitals
Andrew E. Clark and Carine Milcent
1. Introduction
The State is present in all market economies. This is particularly the case for public goods, of which two of the best-known are health and education. While the theoretical grounds for public-sector involvement, often expressed in terms of market failure, redistribution or economies of scale, are well-known, empirical evidence on how outcomes are produced across the public and private sectors has arguably been slightly harder to come by.
Our research focuses on health production, and specifically on employment levels in public and private hospitals. A substantial literature, both theoretical and empirical, has examined the impact of hospital ownership structures. Most empirical work here covers U.S. data (see Sloan et al., 2000, for a review): however, the structure of the U.S. healthcare market makes it is hard to disentangle the pure effect of hospital ownership from other institutional features such as the segmentation of insurance or payers and payment types (Lien et al., 2008). In a number of other countries, hospitals with a certain ownership type (often non-profit or public) dominate the market, precluding hospital performance comparisons across ownership types. The rich institutional structure of the French hospital sector allows us to revisit the question of whether State-owned firms employ “too many” workers.
One advantage of looking at France in this context is that all of public, non-profit and for-profit hospitals enjoy significant market share. Another is that French National Health Insurance (the Sécurité
Sociale) is a single-payer system: this eliminates any concerns about potential cost-shifting behaviour
by providers, negotiation between providers and payers, or different reimbursement schemes for different payers. In addition, the National Health Insurance scheme sets its own fee schedule. For-profit hospitals, which are the only hospitals that can select their patients, are paid on a fee-for-service basis. This mitigates worries about patient selection in a prospective payment system, whereby hospitals may dump patients who are in worse health and are thus likely to cost more than the amount of the
reimbursement (Meltzer et al., 2002). Finally, French National Health Insurance reimburses almost all medical services in hospital, except the additional fixed fee per day for catering and accommodation claimed by for-profit hospitals.
Reimbursement for public and non-profit hospitals was (at the time of our data) on the global budget basis. Neither of these two hospital types can select their patients, and as such any incentive not to treat patients should be the same for public and non-profit hospitals. Staff status is similar in private and NFP hospitals, where workers are salaried (or self-employed). On the contrary, employees are civil servants in public hospitals (which workers are very difficult to fire). Public-hospital employment is determined by the hospital's Board of Directors, which latter includes local government representatives, and in particular the Mayor; however, the Boards of Directors of private and NFP hospitals include neither local government representatives nor the Mayor. Overall then, non-profit hospitals are reimbursed in the same way as public hospitals, but with employment determined as in for-profit hospitals. This distinction will be crucial to us below.
Some public hospitals provide preliminary basic health care. This is particularly true of local public hospitals, with relatively small numbers of beds. Other public hospitals provide more high-tech healthcare and a wider range of services in the context of a broader mission of care. This is the case of the research and teaching hospitals, which usually have more beds than other hospitals in the region. There is one such hospital in each of the French regions. Public hospitals that do not fall into these two categories are largely comparable to non-profit and for-profit hospitals, and provide the same types of healthcare. We here present results without distinguishing between public-hospital types, but do check that they are robust to dropping these research and teaching hospitals.
The French system therefore allows for a relatively clean comparison of ownership types across hospitals which arguably provide similar healthcare services. Hospital types are not randomly-distributed across the country, partly for historical reasons. Non-profit hospitals are particularly prevalent in the East of France. This reflects the 1901 Law on the separation of the church and the state, which obliged all French church hospitals to become State-owned public hospitals. However, in 1901
the East of what is now France was not French (it was German).1 When the East became French again, the 1901 Law was not applied retrospectively and church hospitals there remained non-profit.
We use administrative data covering all French hospitals in 1999, and show that employment in public-sector hospitals is greater than that in private-sector hospitals, for a given level of “health output” (as measured by the number and type of operations carried out, the care provided, and the bed capacity rate). Greater public-sector employment is more prevalent for Nurses and support staff; there is no significant difference public-private sector employment difference for Doctors.
The regressions control for factors which might explain this employment difference, such as patient type and the health services produced. The greater employment in public-sector hospitals is more pronounced in regions with weaker labour markets (a higher local unemployment rate). One reading is then that public hospitals provide employment for those who might otherwise struggle in weaker labour markets. We will argue against an alternative reading that individuals in high-unemployment regions have greater health needs (that are not picked up by our existing controls).
The introduction of local politics allows us to separate these two readings. The “Keynesian” role of public hospitals2 (providing employment in weak labour markets) is only found in communities that voted left-wing. We then appeal to the tightness of the most recent local elections. This left-wing public hospital employment effect mostly occurs when electoral races are tight, consistent with public-sector employment reflecting not only health production, but also political prerogatives.
The paper is organised as follows. Section 2 briefly discusses employment in the public and private sectors. Section 3 describes the French healthcare sector and our hospital administrative data. Section 4 then presents the regression results and underlines the role of the local labour market and political context in determining public-sector hospital employment. Last, Section 5 concludes.
1 This historical fact appears in the context of rules regarding the working week in Chemin and Wasmer (2009). 2 In this paper, Keynesian will be used in the sense of providing employment in depressed labour markets.
2. Public- and Private-Sector Employment
The broad question of the public-sector labour market is dealt with in the excellent survey by Gregory and Borland (1999) in the Handbook of Labor Economics. In this section, we will restrict ourselves to one broad question: the level of public-sector, as compared to private-sector, employment.
A number of papers have considered differences in the organisation of public- and private-sectors. Haskel and Sanchis (1995) suggest that the public sector might be inefficient in a production sense because firms there internalise the costs of workers’ effort: the public and private sectors therefore have different objective functions. Shleifer and Vishny (2002) provide a useful overview of various ways in which government intervention may be viewed. They distinguish between the “Helping Hand”, where government intervention serves to overcome market failure and raise social welfare, and the “Grabbing Hand”, where government agents act at least partly in their own self-interest.3 Boycko et al. (1996) consider efficiency and employment in the public and private sectors. As it is politically more difficult to propose subsidies to private-sector firms than to forego public-sector profits (which are more difficult to observe), privatisation will reduce political influence in production. Similarly, Keefer and Knack (2007) show that public investment across countries falls with the quality of governance, which they argue is consistent with some public investment consisting of rent-seeking.
Direct tests of which sector is the most productive are difficult to carry out cleanly. The principal difficulty is measuring output, which is particularly tough in the areas where the public sector is prevalent, such as health and education. In addition, the comparison of outcomes across heterogeneous individuals may yield biased measures of value-added. In the context of health, private hospitals may cherry-pick patients who (unobservable to the econometrician) are in better initial health, or present a lower risk of complications. Health outcomes in private hospitals, be they mortality, morbidity or some other measure of health quality, will then reflect both hospital value-added and patient selection. Public-sector enterprises typically select less, by the very nature of their mission, rendering cross-sector
3 Recalling the distinction between knights and knaves made by Le Grand (2007): “…knightly doctors, teachers or social
workers would be ones who put the needs and wants of their patients, pupils or clients above their own; whereas knavish professionals are those who prioritize their own immediate interests above those of the people they were supposed to serve”
efficiency comparisons particularly problematic. The particular structure of French healthcare is key here: we suggest below that the presence of non-profit hospitals helps to isolate selection.
We consider the different economic and political influences on inputs, here employment, across sectors. The existing empirical evidence here is slight. Gentry and Penrod (2000) use American data to show that the number of staff per bed is higher in non-profit than for-profit hospitals (with median figures of 3.30 and 2.44 respectively); this difference continues to hold in a regression analysis which controls for various factors which might be thought to affect expected profit, including the local county population.
The analysis we carry out here is related to that in Alesina et al. (2000), who argue that “public
employment is used as a way of directing income toward disadvantaged groups” (p.219). In their
model, some public employment is a disguised transfer that avoids opposition to direct transfers. They focus on income inequality and ethnic fragmentation, and consider the level of public employment in US cities (of over 25 000 inhabitants) in the early 1990s. The number of government employees per 1000 of the total population or per 1000 of the working age population (18-64) is positively correlated with both inequality and ethnic fragmentation. They also find a positive correlation between government employment and local unemployment, although this is not robust to the inclusion of State dummies. Along similar lines, Alesina et al. (2001) argue that public-sector employment is excessive in the South of Italy, as compared to the North, so that public-service production in the South is less efficient than in the North. They conclude that half of the public wage bill in the South represents redistribution, either in the form of inefficient employment or excessive wages.
3. French Hospital Employment Data
French hospitals are of three broad types: public, private not-for-profit, and private for-profit. We shall refer to these as public, NFP, and private, for simplicity.
It is instructive to compare the systems of reimbursement and patient selection in France to those in the US. In the US, hospital reimbursement depends on the type of patient. All French patients are 100% insured by the State, excluding selection by insurance type. Patients in French hospitals only
differ by their health problems; in the US they differ by both health problems and insurance. Reimbursement in France depends only on hospital type and the illnesses treated: public and NFP hospitals receive global budgets,4 whereas private hospitals are paid according to service. Public and NFP hospitals are non-profit: any profit in year t is rendered to the hospital regulator, and is subtracted from their budget in t+1. Public and NFP hospitals are legally forbidden to select patients, and the reimbursement system effectively gives them no incentive to do so. All else equal, patients generally prefer hospitals that are closer to their place of residence. As public and non-profits offer the same types of healthcare services and (as noted above), the distribution of non-profit hospitals is exogenous, the case-mix of patients (type or mix of patients treated by a hospital) is similar between these two hospital types. It should be underlined that we control for both illness severity and the cost weight in our regressions. Further, public and NFP hospitals treat a similar range of pathologies (DREES (Ministry of Health), 2008). As such, conditional on our other controls, these two hospital types should be similar in terms of reimbursement, selection and health-care services. This is not true for private-sector hospitals, where patients can be selected in order to maximise profits.
French privateand non-profit hospitals are distinct in a variety of economic and legal ways (as in the United States) in addition to differences in their reimbursement schemes. Private hospitals are managed and controlled by Doctors who own the organisation and therefore its profit; by way of comparison, NFP hospitals do not have owners but rather self-perpetuating boards that have control rights. Moreover, NFP hospitals are entitled to receive charitable contributions.
The three broad French hospital types do not only differ regarding reimbursement procedures and patient selection: there are also substantial differences in the status of their employees. Employees in NFP and private hospitals are private-sector workers, whereas those in public hospitals are civil servants (i.e. public-sector employees) who cannot be laid off for economic reasons.
The pay of civil servants in public hospitals is not determined directly by performance, but rather by employee qualifications and job tenure. Staffing levels in public hospitals are decided by the Board of Directors, consisting of representatives of the medical staff, patients, and, crucially, the local
4 A Payment-Per-Service system (widely known in the US as a Prospective Payment System - PPS) has been partially
government, including the Mayor. These latter do not appear in the Board of Directors of private and NFP hospitals. Local politics may well then influence employment in public hospitals in a way that it does not in NFP or private hospitals. As Mayors are democratically elected by the commune, they have an obvious interest in satisfying their electorate in order to conserve their position at the next election. In terms of our subject matter here, the Mayor may encourage hospital hiring to tackle local unemployment, even if the health-production case for such hirings is less clear.
NFP hospitals thus occupy something of a hybrid position: regarding budget and patient selection they are like public hospitals, but for staffing they are analogous to private hospitals. This distinction will help us to interpret the regression results: NFP hospitals are subject to the same public-health requirements as public hospitals, but without any direct political influence on staffing.
Our administrative data come from the 1999 SAE (Statistiques Annuelles des Etablissements) survey,5 which collected information on hospital staff and activities. We match in local-area information on the communal age distribution, unemployment, and nationality from the 1999 French Census. The data covers the universe of French hospitals, with 1788 establishments split up into 736 public hospitals, 193 NFP hospitals, and 859 private hospitals.
The SAE includes information on hospital size (the number of beds and the number of annual admissions), and the type of care that is provided to patients. It also provides information on the number of administrative staff, support staff, medical staff and Doctors. Support staff includes, for example, those working on buildings and grounds, or providing social assistance to patients. Medical staff consists of Nurses (including Specialised Nurses), paramedical staff (for example, physical therapists and dieticians) and nursing auxiliary staff. These four staffing groups differ notably by qualification level: support staff are the least-qualified, and Doctors the highest-qualified. Nursing and administrative staff include both qualified and unqualified workers. For example, some of the nursing auxiliaries do not have professional training (namely the ASH: “agent de service hospitalier”).
The employment levels of administrative, support and medical staff (who are salaried) are calculated from readily-available information on hours worked to produce a full-time equivalents
system and thereby to introduce a degree of competition between hospitals.
figure. This figure is comparable between the three hospital types. The situation is less clear for Doctors, who are civil servants in public hospitals but are private-sector salaried or self-employed (profession libérale) in both NFP and private hospitals. In the latter, many Doctors are self-employed and are associated with a patient rather than a specific number of hours in the hospital. Calculating full-time equivalent figures is not straightforward: working hours are known for Doctors who have an employment contract, but we have to make some hypotheses about how much time the self-employed spend in the hospital. The analysis below assumes that self-employed Doctors work at their hospital 50% of the time, and thus represent 50% of a full-time equivalent. While this is perhaps reasonable, we do check that all our results are robust to the more extreme assumptions of 0.1FTE and 0.9FTE.
We focus here on hospital staffing: as shown in the raw data in Table 1, Public hospitals employ more staff than do NFP or private hospitals. This partly reflects hospital size, as some public-sector hospitals are much larger than those in other sectors. Measuring size by the yearly number of admissions, Table 2 shows average staffing levels by hospital type and number of admissions. The latter are split up into four categories (up to 5 000, 5 000-10 000, 10 000-16 000, over 16 000), which are the size cut-points used by the French Ministry of Health in their hospital comparisons. All public research and teaching hospitals have over 16 000 admissions. Unsurprisingly, total employment rises with the number of admissions. However, even within size-class, Public-sector hospitals employ more workers than do their non-public counterparts. Equally, employment grows with admissions for all hospital types, but grows the fastest for public hospitals.6 Similar results pertain with the number of beds as the measure of hospital size.7
There are of course many reasons for employment to differ between hospitals, even conditional on hospital size. Obvious candidates here are the types of patients treated and health-care provided, perhaps resulting from patient selection by private hospitals. While this case-mix will affect employment in private hospitals compared to the others, it should not affect the comparison of NFP and public hospitals. We also formally control for hospital activity via the cost weight, from hospital
6 This is most flagrant for the largest admissions category, but it also holds in the other size groups. 7 Somewhat more recent 2004 hospital employment data also show exactly the same patterns.
administrative records. Each hospital stay is associated with a Diagnosis-Related Group (DRG)8, and each DRG is allocated a ‘weight’ depending on the average cost of the inputs (e.g. nursing, diagnostic services, procedures) required to achieve the appropriate patient outcome. The hospital cost weight is the sum of all the DRGs of the stays in the hospital over the year. This index was first used in US; it is now also used in France where it is called the ISA (“indice synthétique d’activité”). One drawback of using hospital cost-weight data is that some observations are lost in the subsequent merge. We systematically check that our results are robust to the omission of the cost-weight variable.
Cost-weight intuitively reflects differences in “what hospitals do” in terms of the types of treatment offered across hospital types. These treatment types can affect hospital employment (although some very costly procedures are not particularly labour-intensive). The analysis below will also control for illness severity (as measured by the Severity Gravity Index, SGI9), the bed occupancy rate (which will pick up any differences between patients in terms of recovery time after surgery etc.10) and a number of local population characteristics (at the municipality level).11
4. Results
4a. Hospital Employment: Labour-Market Tightness
We regress log hospital employment on the log of hospital admissions, the log of the number of beds,12 mean ISA per stay (the cost weight), illness severity, and the bed-occupancy rate.13 At the
8 The DRG divides hospital cases up into around 500 groups, which contain similar pathologies requiring similar levels of
hospital resource use.
9 We use Deyo’s adaptation of the Charlson co-morbidity index to measure the severity of co-morbidities (Deyo, 1992;
Ghali et al., 1996). The Charlson index, which is expressed as a six-level variable, is constructed for each stay. This index is greater than 0 when a surgical procedure has been carried out on the patient. Validation exercises have shown that this index predicts mortality in longitudinal data (Hamilton and Hamilton, 1997).
10 It is always possible to think that there is some additional variable, uncorrelated with all of the above, that helps explain
hospital staffing. However, it should be borne in mind that the main thrust of our paper is the different employment levels of public and NFP hospitals, neither of which can select patients. To this extent, any omitted variable would also need to be systematically different between these two hospital types. Our knowledge of the French hospital system suggests that this is not likely to be the case.
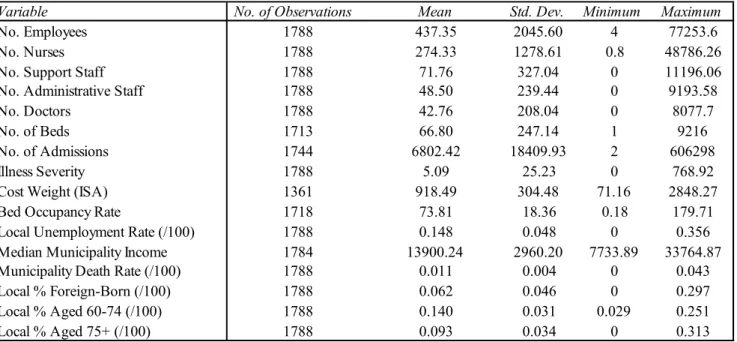
11 Table 3 shows the descriptive statistics of all of the variables used in the analysis.
12 Adding this variable actually produces no significant change in the other estimated coefficients.
13 All of our key results continue to hold in regressions where employment, number of admissions and number of beds are
municipality level, we include the population percentage in the 60-74 and 75+ age groups, the local unemployment rate,14 and the percentage of the population who are foreign-born.
In the first column of Table 4, we regress log hospital employment on the explanatory variables listed above. All of our regressions include heteroscedasticity-robust standard errors and allow observations to be clustered by municipality. The cost-weight, illness severity and bed occupancy rates are divided by 100 here to produce coefficients that are easier to read. The key variables determining employment (apart from hospital type and the number of admissions) are the number of hospital beds, which adds additional information about hospital activity, and illness severity. Conditional on the other control variables, hospital cost weight is also significantly positively correlated with log employment, although only at the ten per cent level, and the bed occupancy rate is positive but insignificant. Last, as a whole the local unemployment rate adds nothing to our understanding of hospital employment.
The estimated coefficients on hospital type conditional on all of our measures of hospital activity appear at the top of the table. These show that, ceteris paribus, public-sector hospitals employ more staff than do NFP or private hospitals.
This first regression in Table 4 posited that local labour-market conditions have the same effect on employment across all hospital types. Column 2 of the same table relaxes this assumption and shows that it is indeed not a good one: the effect of local unemployment on hospital employment depends crucially on hospital type. We thus now interact local unemployment with hospital type: these three interaction variables replace the “local unemployment rate” variable in the first column.
The estimated coefficients on public and NFP at the head of column 2 are very similar: when unemployment is low public and NFP hospitals are predicted to employ the same number of staff (at a given level of admissions, beds, hospital cost-weight and illness severity). The key coefficients in this column are the interactions. That between unemployment and the public hospital dummy is positive and significant at the 0.1 percent level. By way of contrast, that with NFP hospitals is negative and that
14 An alternative to the local unemployment rate is a dummy variable for the municipality being in an area designated as a
“Zone Urbaine Sensible” (ZUS). These latter are urban zones defined as priority targets of local politics, according to a certain number of indicators of local problems. The Law of November 14, 1996 defined a number of tax and social policies used to address these problems. All of our results with respect to unemployment can be reproduced using the ZUS dummy. As ZUS status changes less over time, it can be thought of as a more permanent indicator of local social malaise.
with private hospitals is insignificant.15 Higher local unemployment then goes hand-in-hand with higher employment levels in public-sector hospitals.16 The other explanatory variables in column 2 of Table 4 have much the same relationship with hospital employment as in column 1.
Table 5 reproduces this analysis by staff type: administrative staff, support staff, medical staff and Doctors. In the first column of each panel, local unemployment has no significant effect on the employment of any personnel category: Table 4’s aggregate insignificant coefficient does not therefore hide any personnel-specific effect. Our main results continue to hold in three out of the four staff categories: public hospitals employ more staff than do other hospital types, and hospital employment is positively correlated with local unemployment only in the public sector. The exception is for Doctors, where, conditional on the other controls, there is no staffing difference by hospital type, and no relationship between Doctor numbers and local unemployment. While more deprived areas, here with higher unemployment, likely require more health care and thus more Doctors, the hospital activity variables seem to completely capture this health demand effect: dropping the number of admissions and the cost-weight from the bottom-right panel of Table 3, produces a positive and significant effect of local unemployment on Doctor employment for all three hospital types.
Public hospitals then seem to react to local labour-market conditions in an entirely different way from non-public hospitals. The estimated coefficients in Tables 2 and 3 are consistent with public hospitals playing a Keynesian role in providing employment in depressed areas (except for the group that arguably have the best employment prospects: Doctors).
15 It may seem strange that higher unemployment is associated with lower staffing levels in NFP hospitals. However, we do
control for the number of admissions in this regression (which very likely reflect the local demand for health services). If we drop admissions as a control variable, the interaction between unemployment and NFP in Table 2 becomes insignificant.
16 That the public sector effectively provides partial insurance against unemployment is consistent with lower wages in the
public sector (via a compensating differential) and with regional unemployment reducing the life satisfaction of private-sector workers more than their public-private-sector counterparts (Luechinger et al., 2010).
Robustness
It can be argued that the local unemployment coefficient in these tables is rather picking up local morbidity (and thus the demand for healthcare). We think that this is unlikely for three reasons. First, the regressions already control for health demand via admissions, illness severity and the hospital cost weight of the procedures used: together these should supply an accurate description of what hospitals do to their patients. As an additional test of the local demand for health, we added the municipal median income and death rate to the regressions: this did not change the results.
Second, if unemployment does reflect morbidity, it only seems to do so in public hospitals. Private hospitals can cherry-pick their patients, and may thus be insulated from any general worsening of the client population’s health: this is consistent with public-hospital employment reacting to local deprivation while that in private hospitals does not. However, the estimated coefficients on NFP hospitals in Tables 4 and 5 go against the unemployment-morbidity explanation. NFP hospitals are very similar to public hospitals in that they do not select their patients and treat similar pathologies. Were local unemployment to reflect health demand, we would then expect it to have a similar impact on public and NFP hospitals: in fact it has no positive impact on employment in the latter. The cleavage in the effect of local unemployment is thus in terms of whether employment decisions are influenced by local politicians (as they are in public hospitals, but not NFP or private hospitals),17 rather than in terms of whether the hospitals can select their patients (private) or not (public and NFP).
Last, as noted above, any generalised increase in health demand should be reflected across the employment spectrum. However, while local unemployment is associated with higher levels of staffing for most groups in public hospitals, this is not the case for Doctors.
We have checked the influence of outliers by confirming that the results are robust to omitting the three very large central hospitals in our dataset: APHP (Assistance Public-Hôpitaux de Paris), APHM (Assistance Public-Hôpitaux de Marseille) and HCL (Hospices Civil de Lyon). More generally, they are robust to the omission of the research and teaching hospitals.
One last check that we carried out here relates to any difference in patient type, even conditional on illness severity, cost weight, and bed occupancy. The argument here is that public hospitals may treat individuals with less severe ailments but who require more staff care. As a test, we drop the first quartile of hospitals by average cost weight: this problem should be less prevalent in the remaining three quartiles. Our regression results do continue to apply when the first quartile is dropped.
4b. Hospital Employment: Political Allegiance
The numbers in Tables 4 and 5 are consistent with employment in public hospitals reflecting both political and health priorities. To formalise the potential role of politics, we ask whether the effect of local unemployment is mediated by local politics. A growing literature has developed around the idea of political business cycles, with a smaller empirical counterpart that explicitly considers political influences on public employment. Coelho et al. (2006) identify pre-election employment effects in Portuguese municipalities, especially for the right. In the context of the current paper, they do not relate this employment effect to local unemployment. Lamo et al. (2007) appeal to country-level data in the Euro area and find some evidence of lagged pro-cyclicality of a number of measures of public-sector activity, although the evidence with respect to public employment seems less strong.
We will here relate the size of the local unemployment effect to the political position of the local municipality. To do so, we appeal to the Political Science literature and use expert evaluations of various parties’ political positions to calculate a weighted political stance score. We will then show that the public hospital response to local unemployment is muted in more right-wing communes.
Our expert evaluation scores come from Laver et al. (2006), who show not only the positions of French parties on the most salient policy dimensions, but also the relative importance that parties attach to each dimension (for more details, see the Appendix in Laver et al., 2006). This score takes values between 2.5 to 18.9, with higher scores referring to more right-wing parties. Our data refer to the 1995 local elections. These might be thought to be distant in time from the observation of hospital employment in 1999: the results using the following 2001 local election outcomes are very similar.
We require data on the number of votes cast for each party in local elections. These data are unfortunately not available for communes with fewer than 10 000 inhabitants. For the sub-sample of larger communes we can thus match electoral outcomes directly to the hospital; for the smaller communes we will have to use the electoral results at a more aggregated level (known as the ZE, Zone
d’Emploi, level). We expect this latter imputation to introduce measurement error. There are two sets of
estimation results: one from direct matches over a smaller number of hospitals in larger communes, and the second from a larger sample where one key variable is less-accurately measured. We expect both the standard errors to be lower in the second case (due to the larger sample) and the estimated coefficients (via attenuation bias). This is in fact what we observe in the results.
Our final political variable is called “Right”. As the different parties’ positions regarding “social policy” take values between 2.5 to 18.9, so does our political variable. It should be remembered that “Right” is a continuous variable, and not binary.
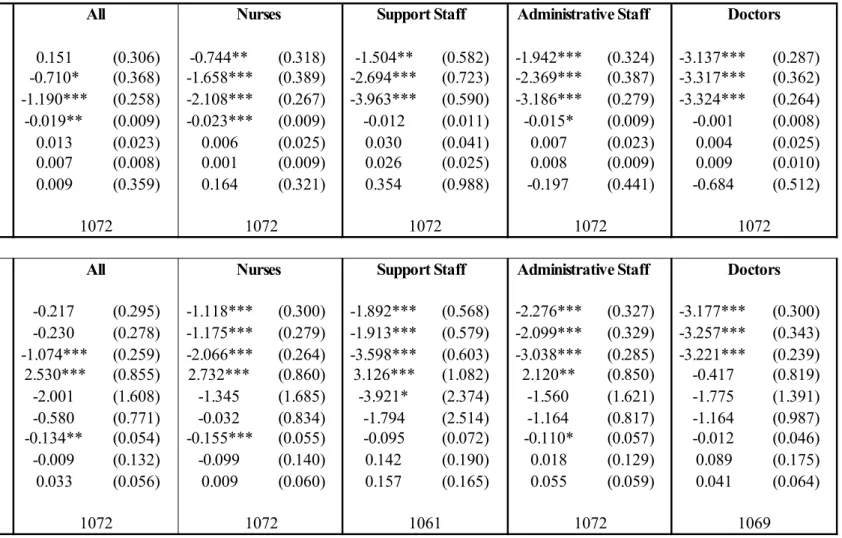
Table 6 presents the results for the smaller sample matching hospitals to voting outcomes exactly. The top half of the table shows the estimated coefficients on interactions between local political position and hospital type in an employment regression. These show that more right-wing local areas have lower employment levels in public hospitals; there is no significant effect of local politics on employment in either NFP or private hospitals. The negative significant effect of “Right” on public hospital employment is found for total employment, Nurses and administrative staff. All of the regressions in Table 6 control for all of the other explanatory variables that appeared in Tables 4 and 5.
The bottom half of Table 6 brings together the results from Table 5 (regarding local unemployment) and the top half of Table 4 (on local Politics). There are two sets of interactions here. The first (as in Table 5) interacts hospital type with local unemployment; the second then interacts this unemployment interaction with local Politics. The first set of interactions thus sets out how hospital employment moves with local unemployment, and the second tells us whether the size of the first interaction depends on the left/right position of the local municipality.
The results first show that, as in Table 5, employment in public hospitals increases with local unemployment. However, the second set of interactions show that this “Keynesian” effect is diminished
as the local municipality moves to the right. Local labour-market conditions and local politics have barely any significant effects on employment in NFP or private hospitals.
This same analysis on the larger sample of hospitals with political information matched at the ZE level produces results which are similar in terms of the signs of the interactions, but with much smaller estimated coefficients that render some of them insignificant. These results are available upon request.
Table 7 illustrates the results from the bottom panel of Table 6 via a number of simulations of employment in public hospitals. The first line shows what we call a “Baseline” level of public-sector hospital employment: this is predicted from the employment regressions,18 with hospital type set equal to public and all other variables at their sample average. In other words, this is the predicted level of employment at a public-sector hospital in a municipality with exactly average characteristics
We then effect two economic and political changes. We first change the local political tapestry by shifting 25 per cent of voters from the Parti Socialiste (left wing) to the RPR (now known as the UMP; right wing): this produces a shift in the “Right” variable of one standard deviation (of around 2.3 points). The second change consists in reducing the local unemployment rate from the sample average of just under 16 per cent19 to just under 11 per cent (which again represents one standard deviation). Both changes are predicted to reduce public-hospital employment, for almost all types of staff. However, the effect of unemployment is particularly strong amongst support staff. This is the least-educated group, and arguably that which is most at risk when the labour market sours.
Interpretations
We have suggested that public hospitals may provide employment in depressed areas, and especially in left-wing municipalities. We now consider some alternative explanations of this finding.
1) Unemployment and Wages
It is known that higher local unemployment reduces local wages (Blanchflower and Oswald, 1994). Might greater hospital employment in deprived areas then reflect lower wages? There are three
objections. First, if this were so, we would expect higher employment across all hospital types. Second, public-sector wages are largely fixed at the national level. Last, it is unclear why local politics in Table 6 should mediate any wage response to unemployment.
2) Unions
Higher employment in public hospitals might reflect stronger public-sector unions, and unions may react to local unemployment. Two remarks seem salient here. First, while French union membership is very low, collective bargaining coverage is close to universal (OECD, 1997), so there is little coverage differential between the public and private sectors. Second, union membership is far more prevalent amongst Doctors than it is amongst Nurses and less-qualified workers, yet it is in this latter group that we find the greatest employment response to local unemployment.
19 This is the average unemployment rate of the municipalities in which there is a hospital and is not weighted by
3) Helping Hand or Grabbing Hand?
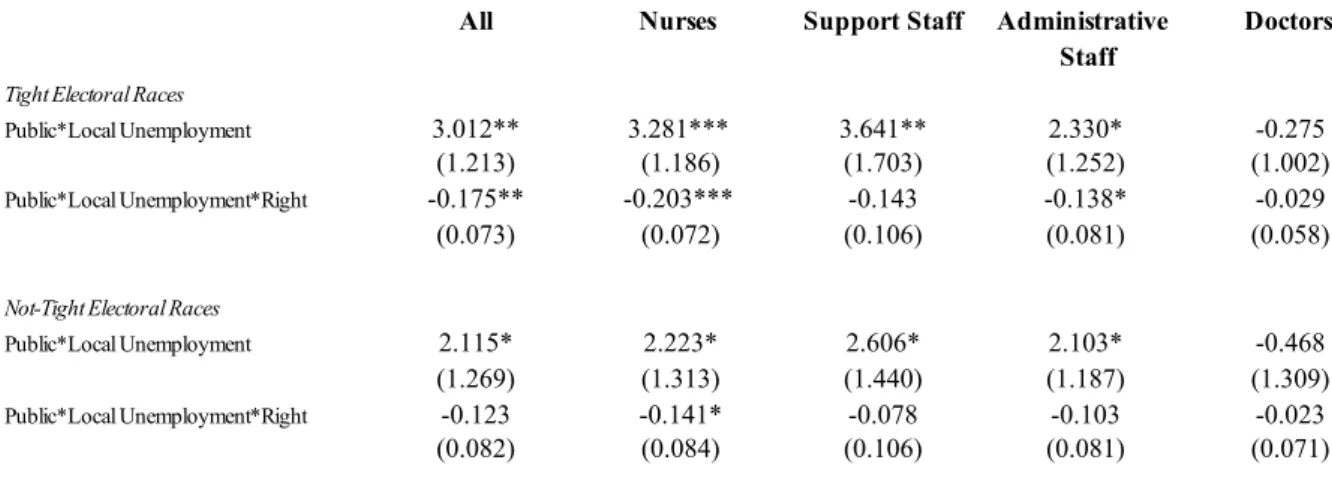
Local politicians may increase public-hospital employment as local unemployment rises for two reasons: to overcome market failure, or for their own interests. If politicians receive some rent from greater employment, then it is difficult to distinguish the grabbing from the helping hand. But if we consider that politicians’ self-interest partly reflects their desire to be re-elected, then a natural test presents itself. Levitt (1997) appealed to time differences in local elections to establish an exogenous effect of policing on crime. Here we consider a cross-section analogy: the closeness of the most recent election result. A “tight race” results if the difference between the votes cast for the winning party and the other parties was less than the median in the sample of municipalities in Table 6 above, and a not-tight race otherwise. With the helping hand, parties with a large majority have greater latitude to push through policies: the political effect on employment will then be greater in not-tight races. However, under the grabbing hand parties may try to please voters more when there is a greater chance of being voted out next election: here we expect the political effect on employment to dominate in tight races.
We thus re-estimated the bottom panel of Table 6 separately for tight and not-tight elections: the results appear in Table 8. The first line in each panel shows that public hospital employment rises with local unemployment in both tight and not-tight electoral races. The second line shows that local politics matter more significantly in tight electoral races. This is consistent with either left-wing municipalities increasing public-sector employment when unemployment is high (or right-wing municipalities reducing it in tighter labour markets). With larger political majorities, when the outcome of elections is more certain, these left-right differences broadly tend to disappear.
5. Conclusion
We here consider public employment and political pressure by looking at employment in three different types of French hospitals. Administrative data provide us with hospital-level information on the employment of four different kinds of workers, as well as hospital size, the kind of illnesses treated and so on. We first show that public hospitals employ more staff than do non-public hospitals, conditional on size and the illnesses treated.
Neither public nor NFP hospitals can cherry-pick their patients, and therefore deal with cases that are (unobservably in this dataset) more difficult to handle, and require more staff. Public and NFP hospitals may also provide different degrees of care than private hospitals. It is therefore difficult to judge any employment gap in terms of the efficiency of health-care production.
We show that this employment gap depends on local economic and political conditions. By appealing to differences between hospital types, we suggest that hospital employment is affected by political influence. Between public hospitals (where employment is decided in part by local politicians, and which cannot select patients) and private hospitals (with no political influence, and which can select patients) there is a third category of NFP hospitals. Employment in NFP hospitals is also free of political influence, but patient selection is not possible. That public hospital employment is significantly higher than that in both private and NFP hospitals is consistent with the method of deciding employment rather than patient selection playing a key role.
We provide support for this view by showing that the employment gap varies with two key local-level variables: the unemployment rate and recent election results. Public hospital employment is positively correlated with local unemployment, whereas this is not true for other hospital types. The relationship between public-hospital employment and local unemployment is moderated by local politics: the more left-wing is the local commune, the stronger is the relationship. All the correlations we identify are more significant for lower-skilled workers. Overall, the results lead us to suspect that public hospitals play a dual role, partly being used as a policy instrument to provide local employment. There are a number of implications. A straightforward one is that employment in areas which have public-sector hospitals will move differently over the economic cycle to employment in areas with non-public hospitals, or no hospitals at all.
A second policy implication concerns the debate over the introduction of competition between hospitals. The employment externalities identified in our data call for caution in comparing hospital performance across types. If public hospitals provide employment to those who would otherwise struggle in a slack labour market (a “helping hand” activity20), they may well be penalised in
20 This not only benefits those who obtain such jobs. Lower local unemployment may more broadly improve the quality of
competitive health markets. However, a broader notion of public service may include not only good service to patients, but also local community needs in terms of employment. Any comparison of the public and private sectors purely in terms of the cost efficiency of the health service provided to patients will be inherently biased against the public sector, and may tell a misleading story with respect to social welfare. The question of whether this kind of job creation is a good way of using public money is crucial, but not one that we can answer with our current data.
Shleifer and Vishny (2002) distinguished between government actions that served to increase social welfare and those designed for politicians’ self-interest: the helping and grabbing hands. Finding greater public-sector employment in high unemployment areas is arguably consistent with both readings. Greater employment may raise social welfare, or increase the resources that politicians control and their re-election chances. In this optic, it is of interest to ask why the employment response should be greater for left-wing rather than right-wing administrations. The helping hand reading is that left-wing councils believe that the externalities from unemployment are higher; the grabbing hand reading is that local politicians follow their electorates’ preferences in this matter in order to preserve their own position. The finding that local politics only matters when the previous election was relatively tight is consistent with the latter reading.
Last, and perhaps most generally, we might wonder to what extent French hospitals are a special case. It would be of great interest to see whether the same employment effects exist in other areas of public-sector activity, such as the railways, education and local administrations, and indeed whether we have uncovered an “exception française”, or whether the employment-unemployment-politics nexus is a general characteristic of the public sector in other countries.
Table 1. Employment by Hospital Type
Hospital Type No. of Hospitals No. of Employees Std. Dev. Minimum Maximum
Public 736 825.7 3143.0 17.4 77253.6
NFP 193 282.8 287.2 10.8 1906.0
Private 859 139.3 104.9 4.0 935.3
Note: Number of employees measured in FTEs.
Table 2: Number of Admissions by Hospital Type
Public NFP Private
< 5000 Admissions N=415 168.5 N=122 148.9 N=590 89.5 5000-10 000 Admissions N=110 489.2 394.3 N=54 N=218 211.8 10 000-16 000 Admissions 802.4 N=76 644.4 N=11 377.4 N=44
> 16 000 Admissions 3133.6 N=135 1339.8 N=6 578.6 N=7
Table 3. Hospital Employment Levels and Variable Means
Variable No. of Observations Mean Std. Dev. Minimum Maximum
No. Employees 1788 437.35 2045.60 4 77253.6
No. Nurses 1788 274.33 1278.61 0.8 48786.26
No. Support Staff 1788 71.76 327.04 0 11196.06
No. Administrative Staff 1788 48.50 239.44 0 9193.58
No. Doctors 1788 42.76 208.04 0 8077.7
No. of Beds 1713 66.80 247.14 1 9216
No. of Admissions 1744 6802.42 18409.93 2 606298
Illness Severity 1788 5.09 25.23 0 768.92
Cost Weight (ISA) 1361 918.49 304.48 71.16 2848.27
Bed Occupancy Rate 1718 73.81 18.36 0.18 179.71
Local Unemployment Rate (/100) 1788 0.148 0.048 0 0.356
Median Municipality Income 1784 13900.24 2960.20 7733.89 33764.87
Municipality Death Rate (/100) 1788 0.011 0.004 0 0.043
Local % Foreign-Born (/100) 1788 0.062 0.046 0 0.297
Local % Aged 60-74 (/100) 1788 0.140 0.031 0.029 0.251
Table 4. Hospital Employment and Labour-Market Tightness
Coeff. Std. Err. Coeff. Std. Err.
Public 0.745*** (0.274) 0.586** (0.276) NFP 0.207 (0.269) 0.587** (0.297) Private -0.371 (0.258) -0.285 (0.264) Public*Local Unemployment 1.298*** (0.466) NFP*Local Unemployment -2.274*** (0.674) Private*Local Unemployment -0.336 (0.436) Log Admissions 0.604*** (0.026) 0.602*** (0.026)
Log Number of Beds 0.060*** (0.015) 0.059*** (0.015)
Illness Severity (/100) 0.298*** (0.114) 0.294** (0.120)
Cost Weight (/100) 0.012* (0.006) 0.011* (0.006)
Bed Occupancy Rate (/100) 0.053 (0.070) 0.050 (0.070)
Local Unemployment Rate (/100) 0.017 (0.311)
Local % Foreign-Born (/100) 0.555* (0.284) 0.520* (0.292) Local % Aged 60-74 (/100) -1.279* (0.760) -1.316* (0.769)
Local % Aged 75+ (/100) -0.128 (0.794) -0.092 (0.801)
Number of observations 1327 1327
*** = significant at the 1% level; ** = significant at the 5% level; and * = significant at the 10% level.
Table 5. Hospital Employment and Local Deprivation: By Staff Type
Coeff. Std. Err. Coeff. Std. Err. Coeff. Std. Err. Coeff. Std. Err. Public 0.069 (0.293) -0.062 (0.295) -0.944** (0.458) -1.227*** (0.435) NFP -0.584** (0.289) -0.162 (0.310) -1.670*** (0.447) -1.096** (0.484) Private -1.125*** (0.275) -1.062*** (0.281) -2.983*** (0.444) -2.818*** (0.484) Public*Local Unemployment 1.248*** (0.463) 2.326*** (0.594) NFP*Local Unemployment -2.405*** (0.680) -3.347*** (1.286) Private*Local Unemployment -0.054 (0.435) -0.657 (1.325) Log Admissions 0.618*** (0.027) 0.616*** (0.027) 0.542*** (0.037) 0.539*** (0.037) Log Number of Beds 0.045*** (0.015) 0.044*** (0.015) 0.112*** (0.033) 0.110*** (0.033) Illness Severity (/100) 0.278** (0.111) 0.276** (0.116) 0.364*** (0.130) 0.359** (0.139) Cost Weight (/100) 0.025*** (0.007) 0.025*** (0.007) 0.026** (0.013) 0.026** (0.012) Bed Occupancy Rate (/100) 0.129* (0.078) 0.126 (0.077) 0.248 (0.216) 0.244 (0.216) Local Unemployment Rate (/100) 0.158 (0.296) 0.067 (0.806)
Local % Foreign-Born (/100) 0.102 (0.327) 0.061 (0.343) 0.140 (0.679) 0.088 (0.672) Local % Aged 60-74 (/100) -1.254 (0.829) -1.277 (0.840) -0.690 (1.363) -0.774 (1.365) Local % Aged 75+ (/100) -0.097 (0.852) -0.084 (0.864) -1.791 (1.451) -1.706 (1.439)
Number of observations 1327 1327 1313 1313
Coeff. Std. Err. Coeff. Std. Err. Coeff. Std. Err. Coeff. Std. Err. Public -1.573*** (0.292) -1.764*** (0.295) -3.387*** (0.342) -3.423*** (0.352) NFP -1.781*** (0.286) -1.585*** (0.323) -3.386*** (0.326) -3.240*** (0.394) Private -2.575*** (0.275) -2.456*** (0.281) -3.359*** (0.314) -3.345*** (0.314) Public*Local Unemployment 1.368*** (0.476) -0.236 (0.668) NFP*Local Unemployment -1.191 (0.735) -1.437 (1.389) Private*Local Unemployment -0.680 (0.530) -0.572 (0.565) Log Admissions 0.598*** (0.028) 0.596*** (0.028) 0.860*** (0.034) 0.860*** (0.034) Log Number of Beds 0.076*** (0.017) 0.074*** (0.018) 0.033 (0.023) 0.033 (0.023) Illness Severity (/100) 0.313*** (0.116) 0.309** (0.122) 0.203*** (0.079) 0.203** (0.080) Cost Weight (/100) 0.002 (0.007) 0.002 (0.007) -0.032*** (0.009) -0.033*** (0.009) Bed Occupancy Rate (/100) 0.107 (0.076) 0.105 (0.076) -0.369*** (0.130) -0.370*** (0.130) Local Unemployment Rate (/100) -0.072 (0.380) -0.540 (0.480)
Local % Foreign-Born (/100) 1.573*** (0.337) 1.559*** (0.331) 1.138*** (0.364) 1.124*** (0.365) Local % Aged 60-74 (/100) -0.051 (0.789) -0.112 (0.793) -1.678 (1.025) -1.683 (1.024) Local % Aged 75+ (/100) -1.608* (0.820) -1.526* (0.824) 0.603 (1.146) 0.603 (1.151)
Number of observations 1326 1326 1317 1317
Nurses Support Staff
Doctors Administrative Staff
Table 6. Politics, Unemployment and Hospital Staffing: Reduced Sample Public 0.151 (0.306) -0.744** (0.318) -1.504** (0.582) -1.942*** (0.324) -3.137*** (0.287) NFP -0.710* (0.368) -1.658*** (0.389) -2.694*** (0.723) -2.369*** (0.387) -3.317*** (0.362) Private -1.190*** (0.258) -2.108*** (0.267) -3.963*** (0.590) -3.186*** (0.279) -3.324*** (0.264) Public*Right -0.019** (0.009) -0.023*** (0.009) -0.012 (0.011) -0.015* (0.009) -0.001 (0.008) NFP*Right 0.013 (0.023) 0.006 (0.025) 0.030 (0.041) 0.007 (0.023) 0.004 (0.025) Private*Right 0.007 (0.008) 0.001 (0.009) 0.026 (0.025) 0.008 (0.009) 0.009 (0.010)
Local Unemployment Rate (/100) 0.009 (0.359) 0.164 (0.321) 0.354 (0.988) -0.197 (0.441) -0.684 (0.512)
Number of observations Public -0.217 (0.295) -1.118*** (0.300) -1.892*** (0.568) -2.276*** (0.327) -3.177*** (0.300) NFP -0.230 (0.278) -1.175*** (0.279) -1.913*** (0.579) -2.099*** (0.329) -3.257*** (0.343) Private -1.074*** (0.259) -2.066*** (0.264) -3.598*** (0.603) -3.038*** (0.285) -3.221*** (0.239) Public*Local Unemployment 2.530*** (0.855) 2.732*** (0.860) 3.126*** (1.082) 2.120** (0.850) -0.417 (0.819) NFP*Local Unemployment -2.001 (1.608) -1.345 (1.685) -3.921* (2.374) -1.560 (1.621) -1.775 (1.391) Private*Local Unemployment -0.580 (0.771) -0.032 (0.834) -1.794 (2.514) -1.164 (0.817) -1.164 (0.987) Public*Local Unemployment*Right -0.134** (0.054) -0.155*** (0.055) -0.095 (0.072) -0.110* (0.057) -0.012 (0.046) NFP*Local Unemployment*Right -0.009 (0.132) -0.099 (0.140) 0.142 (0.190) 0.018 (0.129) 0.089 (0.175) Private*Local Unemployment*Right 0.033 (0.056) 0.009 (0.060) 0.157 (0.165) 0.055 (0.059) 0.041 (0.064) Number of observations Administrative Staff Doctors
All Nurses Support Staff Administrative Staff
Doctors
All Nurses Support Staff
1072 1072 1072 1072 1072
1072 1072 1061 1072 1069
Note: All regressions also control for Number of Beds, Illness Severity, Cost Weight, Bed Occupancy Rate, the local % Foreign-Born, the local % Aged 60-74, and the local % Aged 75+. *** = significant at the 1% level; ** = significant at the 5% level; and * = significant at the 10% level.
Table 7. Estimated Public-Hospital Employment Effects of Politics and Economics
All Nurses Support Staff
Administrative
Staff Doctors Table 6 - bottom
Baseline 904.1 568.1 179.0 91.6 65.4
25% vote switch Left to Right -4.9% -5.6% -3.5% -4.0% -0.4%
Unemployment rate drops from 16% to 11% -5.4% -5.3% -10.0% -4.6% 2.8%
Table 8. Politics, Unemployment and Hospital Staffing: The Role of Tight Electoral Races
All Nurses Support Staff Administrative
Staff
Doctors
Tight Electoral Races
Public*Local Unemployment 3.012** 3.281*** 3.641** 2.330* -0.275
(1.213) (1.186) (1.703) (1.252) (1.002)
Public*Local Unemployment*Right -0.175** -0.203*** -0.143 -0.138* -0.029
(0.073) (0.072) (0.106) (0.081) (0.058)
Not-Tight Electoral Races
Public*Local Unemployment 2.115* 2.223* 2.606* 2.103* -0.468
(1.269) (1.313) (1.440) (1.187) (1.309)
Public*Local Unemployment*Right -0.123 -0.141* -0.078 -0.103 -0.023
(0.082) (0.084) (0.106) (0.081) (0.071)
Note: All regressions also control for the other variables indicated in Table 6. *** = significant at the 1% level; ** = significant at the 5% level; and * = significant at the 10% level.
REFERENCES
Alesina, A., Baqir, R. and Easterly, W. (2000). “Redistributive Public Employment”. Journal of
Urban Economics, vol. 48, pp.219-241.
Alesina, A., Danninger, S. and Rostagno, M. (2001), “Redistribution Through Public Employment: The Case of Italy”, IMF Staff Papers, vol. 48, pp. 447-473.
Blanchflower, D.G. and Oswald, A.J. (1994). The Wage Curve. Cambridge, Mass: MIT Press. (1990).
Boycko, M., Shleifer, A. and Vishny, R. (1996). “A Theory of Privatization”. Economic
Journal, vol. 106, pp. 309-319.
Chemin, M., and Wasmer, E. (2009). "Using Alsace-Moselle Local Laws to Build a Difference-in-Differences Estimation Strategy of the Employment Effects of the 35-Hour Workweek Regulation in France". Journal of Labor Economics, 27, 487-524.
Coelho, C., Veiga, F., and Veiga, L. (2006). "Political business cycles in local employment: Evidence from Portugal". Economics Letters, vol. 93, pp. 82-87.
Deyo, R., Cherkin, D. and Ciol, M. (1992). “Adapting a clinical comorbidity index for use with ICD-9-CM administrative databases”. Journal of Clinical Epidemiology, vol. 45, pp. 613-619.
DREES (2008), “La spécialisation des établissements de santé en 2006”, Ministry of Health Bulletin No. 664.
Gentry, W. and Penrod, J. (2000), “The Tax Benefits of Not-for-Profit Hospitals”, in Cutler, D. (Ed.), The Changing Hospital Industry: Comparing Not-for-Profit and For-Profit
Institutions, Chicago: University of Chicago Press.
Ghali, W., Hall, R., Rosen, A., Ash, A. and Moskowitz, M. (1996). “Searching for an improved clinical comorbidity index for use with ICD-9-CM administrative data”. Journal of Clinical
Gregory, R. and Borland, J. (1999). “Recent Developments in Public Sector Labor Markets”, in Ashenfelter, O. and Card, D. (Eds.), Handbook of Labor Economics Volume 3C. Amsterdam: Elsevier.
Hamilton, B. and Hamilton, V. (1997). “Estimating surgical volume-outcome relationships applying survival models: accounting for frailty and hospital fixed effects”. Health
Economics, vol. 6, pp. 383-395.
Haskel, J. and Sanchis, A. (1995). “Privatisation and X-Inefficiency: A Bargaining Approach”.
Journal of Industrial Economics, vol. 43, pp. 301-322.
Keefer, P., and Knack, S. (2007). "Boondoggles, Rent-Seeking and Political Checks and Balances: Public Investment under Unaccountable Governments". Review of Economics and
Statistics, vol. 89, pp. 566-572.
Lamo, A., Pérez, J., and Schuknecht, J. (2007). "The cyclicality of consumption, wages and employment of the public sector in the euro area". European Central Bank, Working Paper Series 757.
Laver, M., Benoit, K. and Sauger, N. (2006). “Policy competition in the 2002 French legislative and presidential elections”, European Journal of Political Research, vol. 45, pp. 667-697. Le Grand, J. (2007). The Other Invisible Hand. Princeton and Oxford: Princeton University
Press.
Levitt, S. (1997). “Using Electoral Cycles in Police Hiring to Estimate the Effect of Police on Crime”. American Economic Review, vol. 87, pp. 270-90.
Lien, H.-M., Chou, S.-Y., and Liu, J.-T. (2008). "Hospital ownership and performance: Evidence from stroke and cardiac treatment in Taiwan". Journal of Health Economics, 27, 1208-1223.
Luechinger, S., Meier, S., and Stutzer, A. (2010). "Why Does Unemployment Hurt the Employed? Evidence from the Life Satisfaction Gap between the Public and the Private Sector". Journal of Human Resources, vol. 45, pp. 998-1045.
Meltzer, D., Chung, J. and Basu, A. (2002). "Does competition under Medicare Prospective Payment selectively reduce expenditures on high-cost patients?". RAND Journal of
Economics, vol. 33, pp. 447-468
OECD. (1997). “Economic Performance and the Structure of Collective Bargaining”. OECD
Employment Outlook.
Öster, A., and Agell, J. (2007). “Crime and Unemployment in Turbulent Times”. Journal of the
European Economic Association, vol. 5, pp. 752-775.
Shleifer, A. and Vishny, R. (2002). The Grabbing Hand. Boston, MA: Harvard University Press. Sloan, F., Taylor, D. and Conover, C. (2000), “Hospital Conversions: Is the Purchase Price Too Low?”, in Cutler, D. (Ed.), The Changing Hospital Industry: Comparing Not-for-Profit and