Scientific paper
Synthesis, X-Ray Structure Determination and
Related Physical Properties of Thiazolidinone Derivative
by DFT Quantum Chemical Method
Youcef Megrouss,
1,* Fayssal Triki Baara,
2Nourdine Boukabcha,
1Abdelkader Chouaih,
1Antonis Hatzidimitriou,
3Ayada Djafri,
2Fodil Hamzaoui
41 LTPS Laboratory, University Abdelhamid Ibn Badis - Mostaganem, 27000 Mostaganem, Algeria 2 Laboratory of Applied Organic Synthesis (LSOA), Department of Chemistry, Faculty of Sciences, University
of Oran-1 Ahmed Ben Bella, 31000 Oran, Algeria
3 Department of General and Inorganic Chemistry, Faculty of Chemistry, Aristotle University of Thessaloniki,
GR-54124 Thessaloniki, Greece
4 LPFM Académie de Montpellier, France
* Corresponding author: E-mail: youmeg@hotmail.fr Received: 02-20-2019
Abstract
In this paper we report the synthesis and characterization of the (Z)-3-N-(ethyl)-2-N’-((3-methoxyphenyl)imino)thiazo-lidine-4-one by means of FT-IR, 1H and 13C NMR and by single crystal X-ray diffraction. The experimental
determina-tion of the crystal structure of the compound has been achieved using X-ray diffracdetermina-tion data. The important character-istic of the structure is the existence of a dihedral angle formed by the benzene and thiazolidinone rings being equal to 86.0° indicating an absence of π–π stacking as well as that the structure is non planar. In the crystal, the molecules are linked by C–H···O and C–H···N hydrogen bonds, these bonds being responsible for the three-dimensional molecular structure packing. In order to compare the experimental results with those of the theoretical calculation, quantum chem-ical DFT calculations were carried out using B3LYP/6-311G(d,p) basis set. In this context, the molecular electrostatic potential around the molecule and HOMO–LUMO energy levels were also computed. The dipole moment orientations were determined in order to understand the nature of inter- and intramolecular charge transfer. Finally, the stability of the title compound was confirmed throughout the calculation of the chemical reactivity descriptors.
Keywords: X-ray diffraction; single crystal; DFT calculations; spectroscopy; FT-IR; 1H and 13C NMR.
1. Introduction
Heterocyclic compounds are the major family of or-ganic compounds; in medicinal chemistry thiazole deriva-tives are of great importance for their chemical and phar-macological properties, consequently thiazole derivatives have an extended range of pharmacological applications. Over the years, interesting biological activities were com-bined with thiazole derivatives.1–2 These materials are ex-tremely necessary with wide range of synthetic, pharma-ceutical and industrial applications and are famous for their biological activities.3,4 Recently, in drug development the application of thiazoles was required for the treatment
of allergies,5 hypertension,6 inflammation,7 schizophrenia,8 bacterial9 and HIV infections,10 as hypnotics11 and more recently for pain treatment,12 as fibrinogen receptor antag-onists with antithrombotic activity.13 In addition, thiazolid-inones and thiazoles present a very powerful activity as anti mycobacterium in tuberculosis.14 In this context, we have tried to realize the synthesis of the title compound, to char-acterize and perform its structural analysis as well as the theoretical density functional theory (DFT) calculations. In this work we present the synthesis, single crystal structure, IR and NMR spectroscopic characterizations as well as DFT calculations of this new thiazole derivative compound, namely the
(Z)-3-N-(ethyl)-2-N’-((3-methoxyphenyl)imi-no)thiazolidine-4-one. Furthermore, theoretical vibration-al frequencies and 1H and 13C NMR chemical shifts were calculated and compared to the experimental values. Addi-tional parameters as molecular orbitals and chemical reac-tivity descriptors are evaluated in order to confirm the sta-bility of the title compound. Finally, the molecular electro-static potential was computed to determine electrophilic and nucleophilic regions of the title molecule.
2. Experimental
2. 1. Synthesis and Crystallization
An equimolar solution of N-ethyl-3-N’-(3-methoxy-phenyl)thiourea and ethyl bromoacetate in absolute etha-nol in the presence of sodium acetate was refluxed for 6 h. The solvent was removed by vacuum distillation and the residue was isolated, washed with cold water, filtered, dried and crystallized from ethanol to yield (Z)-3-N-(ethyl)-2-N’-((3-methoxyphenyl)imino)thiazolidin-4-one as pre-sented in the scheme 1.
Scheme 1. Reaction sequence for the title compound synthesis.
2. 2. Spectral Data Measurements
Infrared (IR) spectrum of the molecule (Z)-3-N- (ethyl)-2-N’-((3-methoxyphenyl)imino)thiazoli-dine-4-one was recorded in the range 500–4000cm–1 on a Nicolet FT-IR 6700 spectrometer using sample prepared as KBr pellets. 1H NMR (500 MHz) and 13C NMR (125 MHz) spectra of the molecule using CDCl3 as the solvent were recorded on Bruker AC250 spectrometer at 298 K.
2. 3. X-Ray Data Collection and Processing
A transparent-yellowish parallelepiped crystal was selected and separated from the mother liquor, immedi-ately cooled to 130 K and mounted on a Bruker Kappa APEX 2 diffractometer, equipped with a Triumph mono-chromator using MoKa radiation. The crystal presented no decay during the data collection. The frames collected (running ϕ and ω scans) were integrated with the Bruker SAINT Software package,15 using a narrow-frame algo-rithm. Data were corrected using the SADABS program.16 The structure was solved by the SUPERFLIP package.17 Crystals program package version 14.4018 has been used for the refinement and all the rest subsequent calculations through full-matrix least-squares on F2. All non-hydrogen
atoms have been refined anisotropically. Hydrogen atoms were found at their expected positions and refined using proper riding constraints to the pivot atoms. Molecular il-lustrations were made through the MoPro-viewer crystal-lographic program.19 Crystallographic and experimental details are summarized in Table 1.
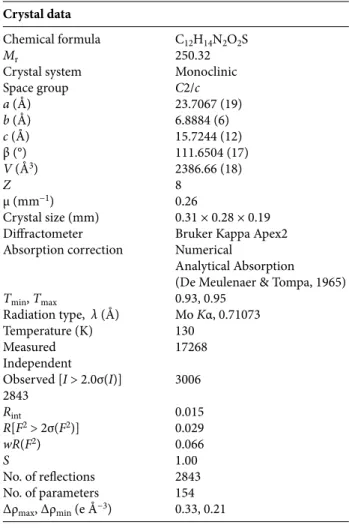
Table 1. Crystallographic and experimental details.
Crystal data
Chemical formula C12H14N2O2S
Mr 250.32
Crystal system Monoclinic Space group C2/c a (Å) 23.7067 (19) b (Å) 6.8884 (6) c (Å) 15.7244 (12) β (°) 111.6504 (17) V (Å3) 2386.66 (18) Z 8 µ (mm−1) 0.26 Crystal size (mm) 0.31 × 0.28 × 0.19 Diffractometer Bruker Kappa Apex2 Absorption correction Numerical
Analytical Absorption (De Meulenaer & Tompa, 1965)
Tmin, Tmax 0.93, 0.95 Radiation type, λ (Å) Mo Kα, 0.71073 Temperature (K) 130 Measured 17268 Independent Observed [I > 2.0σ(I)] 3006 2843 Rint 0.015 R[F2 > 2σ(F2)] 0.029 wR(F2) 0.066 S 1.00 No. of reflections 2843 No. of parameters 154 Δρmax, Δρmin (e Å−3) 0.33, 0.21
3. DFT Calculations
In this theoretical study, the hybrid functional B3LYP with the 6-311G (d, p)20 basis set were used in all calculations by using the Gaussian 09 program,21 the X-ray structure was used as starting geometry to optimize a mo-lecular structure of the investigation compound. Vibra-tional frequencies were calculated and the Gauss-view molecular visualization program22 and VEDA software23 were used for the assignment. Additionally, 1H and 13C NMR chemical shifts were calculated using the same level of theory. The theoretical calculation also allowed us to compute the energy values of the highest occupied molec-ular orbital (HOMO) and lowest unoccupied molecmolec-ular orbital (LUMO). Furthermore, the molecular electrostatic
potential was calculated with B3LYP/6-311G(d, p) to highlight the electrophilic and nucleophulic attack sites.
4. Results and Discussion
4. 1. Structure Description
The molecular geometry of the title compound is de-fined by the presence of two fragments, methoxyphenyl and thiazolidine rings forming a dihedral angle of 86°. Detailed results containing atomic positions and thermal parameters are given in the CIF file. Selected bond lengths, bond and torsion angles for all atoms by X-ray diffraction and theoret-ical calculations are listed in Tables 2, 3 and 4, respectively. An ORTEPIII diagram24 of the title compound showing the X-ray structure with thermal ellipsoids of the different at-oms and the theoretical structure are given in Figure 1. In our study we employed full geometry optimization for the molecule without symmetry constraint. The results of our calculations showed that S1–C5, S1–C1, C1–N1, N1–C2, N1–C4, C6–N2 and O 2–C8 bonds exhibit single bond characteristics, while C4–O2 (1.23 Å) and N2–C1 (1.26 Å) bonds show typical double bond characteristics.25 The amine N2 atom exhibits a geometry that is typical for an sp2 rather than an sp3 atom hybridisation. In addition, the dif-ference in the thiazole ring bonds between theoretical cal-culation and experimental values does not exceed 0.13 Å. Bond angles C6–N2–C1, C2–N1–C4 and C1–N1–C4 are also near 120° (119.56°, 121.08° and 116.72°, respectively).26
The bond angles centered on C1 are all between 109° and 129°. The C1 atom is of sp2 hybridization type because the total adds up to 360° at B3LYP/6-311G(d,p) level. The corre-sponding theoretical values of this angle is 64° (C7–C6–N2– C1). The C8–O2–C12 angle is 116.98°, and the C2–N1–C4– O1 fragment is approximately planar (Table 4).
Generally, the observed difference between experi-mental and calculated geometrical parameters does not seem very large.
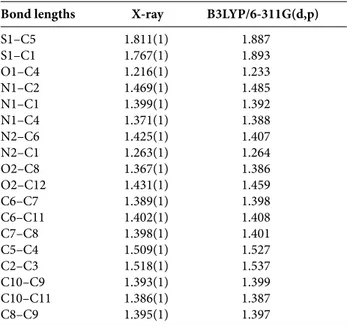
Table 2. Experimental and optimized bond lengths (Å).
Bond lengths X-ray B3LYP/6-311G(d,p) S1–C5 1.811(1) 1.887 S1–C1 1.767(1) 1.893 O1–C4 1.216(1) 1.233 N1–C2 1.469(1) 1.485 N1–C1 1.399(1) 1.392 N1–C4 1.371(1) 1.388 N2–C6 1.425(1) 1.407 N2–C1 1.263(1) 1.264 O2–C8 1.367(1) 1.386 O2–C12 1.431(1) 1.459 C6–C7 1.389(1) 1.398 C6–C11 1.402(1) 1.408 C7–C8 1.398(1) 1.401 C5–C4 1.509(1) 1.527 C2–C3 1.518(1) 1.537 C10–C9 1.393(1) 1.399 C10–C11 1.386(1) 1.387 C8–C9 1.395(1) 1.397
Table 3. Experimental and optimized bond angles (°).
Bond angles X-ray B3LYP/6-311G(d,p) C5–S1–C1 92.24 90.13 C2–N1–C1 122.15 120.13 C2–N1–C4 121.08 119.58 C1–N1–C4 116.72 29.83 C6–N2–C1 119.56 129.18 C8–O2–C12 116.98 117.97 N2–C6–C7 119.43 124.07 N2–C6–C11 119.94 116.82 C7–C6–C11 120.34 119.08 C6–C7–C8 119.87 120.72 S1–C5–C4 107.51 108.27 N1–C2–C3 112.36 111.42 S1–C1–N1 110.92 109.07 S1–C1–N2 127.32 129.12 N1–C1–N2 121.76 121.81 O1–C4–N1 123.71 123.73 O1–C4–C5 123.91 124.08 N1–C4–C5 112.37 112.18 C9–C10–C11 121.52 120.98 O2–C8–C7 115.23 115.22 O2–C8–C9 124.48 124.87 C7–C8–C9 120.27 119.91 C10–C9–C8 119.01 119.34 C6–C11–C10 118.98 119.96
Figure 1. Experimental (a) and theoretical (b) structure of (Z)-3-N-(ethyl)-2-N’-((3-methoxyphenyl)imino)thiazolidine-4-one. a)
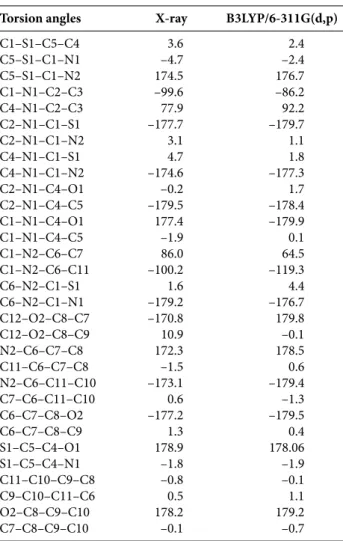
Table 4. Experimental and optimized torsion angles (°).
Torsion angles X-ray B3LYP/6-311G(d,p) C1–S1–C5–C4 3.6 2.4 C5–S1–C1–N1 –4.7 –2.4 C5–S1–C1–N2 174.5 176.7 C1–N1–C2–C3 –99.6 –86.2 C4–N1–C2–C3 77.9 92.2 C2–N1–C1–S1 –177.7 –179.7 C2–N1–C1–N2 3.1 1.1 C4–N1–C1–S1 4.7 1.8 C4–N1–C1–N2 –174.6 –177.3 C2–N1–C4–O1 –0.2 1.7 C2–N1–C4–C5 –179.5 –178.4 C1–N1–C4–O1 177.4 –179.9 C1–N1–C4–C5 –1.9 0.1 C1–N2–C6–C7 86.0 64.5 C1–N2–C6–C11 –100.2 –119.3 C6–N2–C1–S1 1.6 4.4 C6–N2–C1–N1 –179.2 –176.7 C12–O2–C8–C7 –170.8 179.8 C12–O2–C8–C9 10.9 –0.1 N2–C6–C7–C8 172.3 178.5 C11–C6–C7–C8 –1.5 0.6 N2–C6–C11–C10 –173.1 –179.4 C7–C6–C11–C10 0.6 –1.3 C6–C7–C8–O2 –177.2 –179.5 C6–C7–C8–C9 1.3 0.4 S1–C5–C4–O1 178.9 178.06 S1–C5–C4–N1 –1.8 –1.9 C11–C10–C9–C8 –0.8 –0.1 C9–C10–C11–C6 0.5 1.1 O2–C8–C9–C10 178.2 179.2 C7–C8–C9–C10 –0.1 –0.7
4. 2. Hydrogen Bonding
Hydrogen bonds join chains of molecules to stabilize the crystal structure of the title compound. Along the b axis in the unit cell, the translation of equivalent molecules al-lows the linking of the almost linear hydrogen bonding. C–H···O and C–H···N intra- and intermolecular interac-tions are present in the crystal structure. The molecular conformation is in part influenced by the formation of two weak intramolecular C2–H22···O1 and C2–H21···N1 hy-drogen bonds that enclose S(5) rings (Figure 2 and Table 5).
These interactions are responsible for the stability of the molecular packing, as the C2, C3, C5, C12 and C7 car-bon atoms act as donor groups and both oxygen and nitro-gen atoms play the acceptor role. Hydronitro-gen bond interac-tions are presented in Table 5. Figure 2 shows all interaction types in the crystal. The molecular stacking that has been provided by the different existing hydrogen bonds in the
Table 5. Geometry of the C–H···O and C–H···N hydrogen bonds in (Z)-3-N-(ethyl)-2-N’-((3-methoxyphe-nyl)imino)thiazolidine-4-one crystal by X-ray diffraction.
D–H···A D–H (Å) D–A (Å) H···A (Å) D–H···A (°) Bond type C2–H21···N2 0.981 2.852 2.453 103.88 Intramolecular C2–H22···O1 0.962 2.817 2.582 93.97 Intramolecular C5–H51···O1(i) 0.987 3.380 2.489 149.92 Intermolecular
C7–H7···O1(ii) 0.947 3.432 2.508 164.98 Intermolecular
C5–H52···N2(iii) 0.955 3.370 2.514 149.26 Intermolecular
Symmetry codes: (i) –x, y, –z + 1/2; (ii) –x, –y, –z; (iii) x, –y, z + 1/2
b) a)
Figure 2. Hydrogen bonding view in the crystal showing: (A) inter-molecular interactions, (B) C2–H21···N2 and C2–H22···O1 intra-molecular interactions.
crystal is shown in Figure 3. This figure shows the exist-ence of eight molecules in the unit cell which is in good agreement with the multiplicity of the space group C2/c.
4. 3. Vibrational Frequencies Assignments
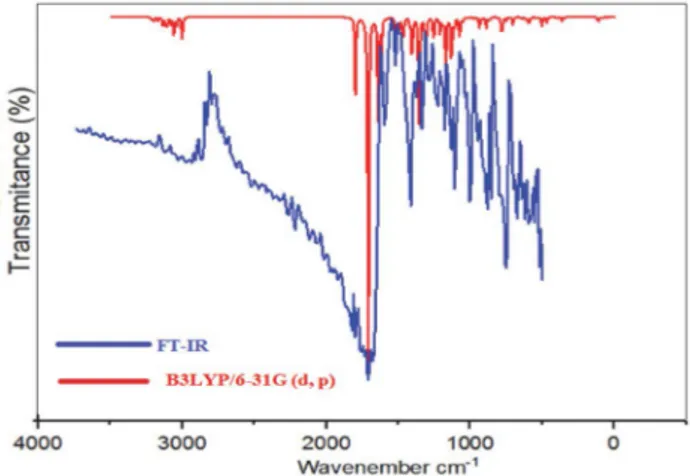
Using analytic second derivatives to validate the con-vergence to minima on the potential energy surface the fundamental frequencies of the studied molecule have been calculated to understand the nature of these modes of vibration IR absorption spectroscopy based on DFT calcu-lation. A theoretical analysis has been realized using B3LY-P/6-311G(d,p) level of theory in gas phase. The probable assignments were performed by means of VEDA 4 pro-gram.23 The vibrational frequencies obtained from B3LYP functional calculations have been scaled by a factor of 0.967.27 Table 6 shows the calculated (unscaled and scaled) and experimental frequencies of the title compound. Simu-lated and experimental IR spectra of (Z)-3-N-(ethyl)-2-N’-((3-methoxyphenyl)imino)thiazolidine-4-one are shown in Figure 4. As can be seen in Figure 4, the experimental fundamentals are in better agreement with the scaled fun-damentals.
4. 3. 1. Carbon–Hydrogen Vibrations
In the aromatic compounds, multiple weak bands are exhibited in the region of 3100–3000 cm‒1.28 They ap-pear in this range of like multiple weak bands due to the stretching vibrations of C−H.29 In the present work, the carbon–hydrogen of aromatic ring (C−H) stretching (νCH modes) were found in a range of 3000 and 3100 cm‒1 using the B3LYP/6-311G(d,p) calculations. These modes involve exact contribution of >91% suggesting that they are pure stretching modes. The C–H stretching of ar-omatic ring showed symmetric modes at 3001, 3070 and 3080 cm–1 while asymmetric stretching mode was ob-served at 2989 cm–1.
4. 3. 2. C=O and C=N Vibrations
Usually, the C=O stretching vibration mode can be easily observed as a strong band in the region 1850–1550 cm–1.30 The π–π bonding between carbon and oxygen is responsible for forming a double bond between the carbon and oxygen atoms. The electronic distribution in this link is not equal because these atoms have different electroneg-ativities. The lone pair of electrons on oxygen is responsi-ble for the polar nature of the carbonyl group. In the pres-ent study, the single C=O stretching vibration mode was observed as a high-intense peak in FT-IR at 1716 cm–1 while the calculated value shows at 1726 cm–1 with a PED (potential energy distribution) of 79%. The stretching fre-quency of the double bond C=N is perfectly observed at the high absorption 1640 cm–1. DFT/B3LYP functional with 6-311G(d,p) basis set gives exactly the same value of 1640 cm–1 for the C=N vibration.
4. 3. 3. Thiazolidine Ring Vibrations
The C–S stretching vibration presents average bands in the region 1020–1010 cm–1.31 In this paper C–S vibra-tions were observed at 704, 647 and 526 cm–1. The exami-nation of the theoretical results gives us the following val-ues with their PED contribution: 720 (21%), 642 (10%), 522 (12%) and 482 (23%) respectively, which shows a good agreement between theoretical and experimental ones as shown in the Table 6. C–N vibration is a difficult task to identify since the appearance of several bands is possible in the region, Gunasekaran et al.32 have observed C–N stretching band at 1312 cm–1,33 and C–N assigned stretch-ing vibration in the region 1350–1000 cm–1 for amines. In thiazolidine, C–N stretching band is found to be present at 1382 and 1307 cm–1. The C–N stretching vibrations are ex-pected to occur in the region 1200–1130 cm–1.34 In our present work of the title molecule FTIR bands were ob-served at 896 cm–1 and 1234 cm–1, the theoretically calcu-lated bands at 940, 1405, 1357, 1301, 1257, 1131 are shifted
Figure 4. Comparison of FT-IR and calculated IR Spectra for
(Z)-3-N-(ethyl)-2-N’-((3-methoxyphenyl)imino)thiazolidine-4-one.
Figure 3. View of the crystal packing along the b axis of (Z)-3-N-(ethyl)-2-N’-((3-methoxyphenyl)imino)thiazolidine-4-one mole-cule.
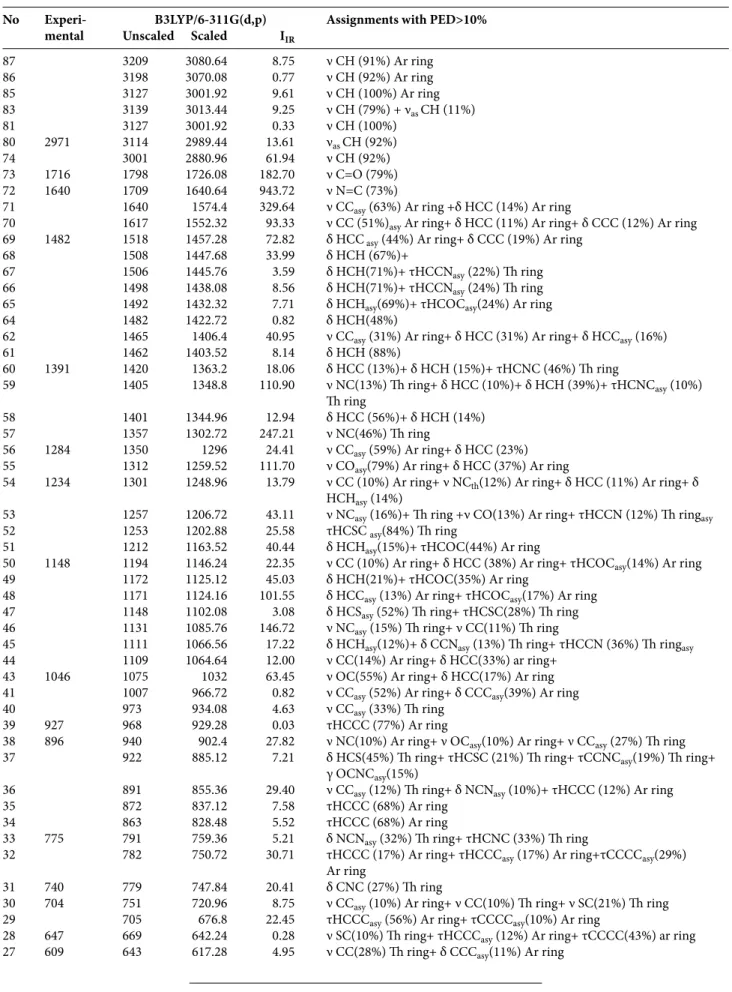
Table 6. Comparison of the calculated harmonic frequencies using B3LYP method 6-311G(d,p) basis set and experimental (FT-IR) wavenumbers (cm–1) for (Z)-3-N-(ethyl)-2-N’-((3-methoxyphenyl)imino)thiazolidine-4-one.
No Experi- B3LYP/6-311G(d,p) Assignments with PED>10% mental Unscaled Scaled IIR
87 3209 3080.64 8.75 ν CH (91%) Ar ring 86 3198 3070.08 0.77 ν CH (92%) Ar ring 85 3127 3001.92 9.61 ν CH (100%) Ar ring 83 3139 3013.44 9.25 ν CH (79%) + νas CH (11%) 81 3127 3001.92 0.33 ν CH (100%) 80 2971 3114 2989.44 13.61 νas CH (92%) 74 3001 2880.96 61.94 ν CH (92%) 73 1716 1798 1726.08 182.70 ν C=O (79%) 72 1640 1709 1640.64 943.72 ν N=C (73%)
71 1640 1574.4 329.64 ν CCasy (63%) Ar ring +δ HCC (14%) Ar ring
70 1617 1552.32 93.33 ν CC (51%)asy Ar ring+ δ HCC (11%) Ar ring+ δ CCC (12%) Ar ring
69 1482 1518 1457.28 72.82 δ HCC asy (44%) Ar ring+ δ CCC (19%) Ar ring
68 1508 1447.68 33.99 δ HCH (67%)+
67 1506 1445.76 3.59 δ HCH(71%)+ τHCCNasy (22%) Th ring
66 1498 1438.08 8.56 δ HCH(71%)+ τHCCNasy (24%) Th ring
65 1492 1432.32 7.71 δ HCHasy(69%)+ τHCOCasy(24%) Ar ring
64 1482 1422.72 0.82 δ HCH(48%)
62 1465 1406.4 40.95 ν CCasy (31%) Ar ring+ δ HCC (31%) Ar ring+ δ HCCasy (16%)
61 1462 1403.52 8.14 δ HCH (88%) 60 1391 1420 1363.2 18.06 δ HCC (13%)+ δ HCH (15%)+ τHCNC (46%) Th ring 59 1405 1348.8 110.90 ν NC(13%) Th ring+ δ HCC (10%)+ δ HCH (39%)+ τHCNCasy (10%) Th ring 58 1401 1344.96 12.94 δ HCC (56%)+ δ HCH (14%) 57 1357 1302.72 247.21 ν NC(46%) Th ring 56 1284 1350 1296 24.41 ν CCasy (59%) Ar ring+ δ HCC (23%)
55 1312 1259.52 111.70 ν COasy(79%) Ar ring+ δ HCC (37%) Ar ring
54 1234 1301 1248.96 13.79 ν CC (10%) Ar ring+ ν NCth(12%) Ar ring+ δ HCC (11%) Ar ring+ δ
HCHasy (14%)
53 1257 1206.72 43.11 ν NCasy (16%)+ Th ring +ν CO(13%) Ar ring+ τHCCN (12%) Th ringasy
52 1253 1202.88 25.58 τHCSC asy(84%) Th ring
51 1212 1163.52 40.44 δ HCHasy(15%)+ τHCOC(44%) Ar ring
50 1148 1194 1146.24 22.35 ν CC (10%) Ar ring+ δ HCC (38%) Ar ring+ τHCOCasy(14%) Ar ring
49 1172 1125.12 45.03 δ HCH(21%)+ τHCOC(35%) Ar ring
48 1171 1124.16 101.55 δ HCCasy (13%) Ar ring+ τHCOCasy(17%) Ar ring
47 1148 1102.08 3.08 δ HCSasy (52%) Th ring+ τHCSC(28%) Th ring
46 1131 1085.76 146.72 ν NCasy (15%) Th ring+ ν CC(11%) Th ring
45 1111 1066.56 17.22 δ HCHasy(12%)+ δ CCNasy (13%) Th ring+ τHCCN (36%) Th ringasy
44 1109 1064.64 12.00 ν CC(14%) Ar ring+ δ HCC(33%) ar ring+ 43 1046 1075 1032 63.45 ν OC(55%) Ar ring+ δ HCC(17%) Ar ring 41 1007 966.72 0.82 ν CCasy (52%) Ar ring+ δ CCCasy(39%) Ar ring
40 973 934.08 4.63 ν CCasy (33%) Th ring
39 927 968 929.28 0.03 τHCCC (77%) Ar ring
38 896 940 902.4 27.82 ν NC(10%) Ar ring+ ν OCasy(10%) Ar ring+ ν CCasy (27%) Th ring
37 922 885.12 7.21 δ HCS(45%) Th ring+ τHCSC (21%) Th ring+ τCCNCasy(19%) Th ring+
γ OCNCasy(15%)
36 891 855.36 29.40 ν CCasy (12%) Th ring+ δ NCNasy (10%)+ τHCCC (12%) Ar ring
35 872 837.12 7.58 τHCCC (68%) Ar ring 34 863 828.48 5.52 τHCCC (68%) Ar ring
33 775 791 759.36 5.21 δ NCNasy (32%) Th ring+ τHCNC (33%) Th ring
32 782 750.72 30.71 τHCCC (17%) Ar ring+ τHCCCasy (17%) Ar ring+τCCCCasy(29%)
Ar ring
31 740 779 747.84 20.41 δ CNC (27%) Th ring
30 704 751 720.96 8.75 ν CCasy (10%) Ar ring+ ν CC(10%) Th ring+ ν SC(21%) Th ring
29 705 676.8 22.45 τHCCCasy (56%) Ar ring+ τCCCCasy(10%) Ar ring
28 647 669 642.24 0.28 ν SC(10%) Th ring+ τHCCCasy (12%) Ar ring+ τCCCC(43%) ar ring
down by scaling the previous values to 902 (10%), 1348 (13%), 1302 (46%), 1248 (12%), 1206 (16%), 1085 (15%), respectively with the percentage of the PED contribution indicated between brackets.
4.
4.
1H and
13C NMR Calculations
To calculate isotropic chemical shifts (δ) with respect to tetramethylsilane (TMS): δx
iso = σTMSiso – σ xiso,34 iso-tropic shielding values 184.2796 and 32.2899 ppm of σTMS
iso were used for C and H NMR spectra, respectively. It is known that the range of 13C NMR chemical shifts for analogous organic molecules usually are >100 ppm.35,36 Methanol solvent has been used for chemical shift meas-urements. The atoms were labeled according to the num-bering presented in Figure 1 (B). Calculated and experi-mental values for 1H and 13C NMR are collected in Table 7. In this research, aromatic carbons give signals in over-lapped areas of the spectrum with chemical shift values from 106 to 170 ppm while experimental chemical shift values of aromatic carbon atoms are in the range 107 to 160 ppm as they would be expected (Table 7). Carbon at-oms (C1, C4 and C6) attached to the N atom have larger chemical shifts due to the more electronegative property of the N atom which polarizes the electron distribution in its binding to the atom adjacent carbon and reduces the value of the chemical shifts. Usually, the chemical shifts obtained and calculated for the 1H atoms of the methyl groups are quite weak. The maximum chemical shift value for all the hydrogen atoms is 7.24 ppm.
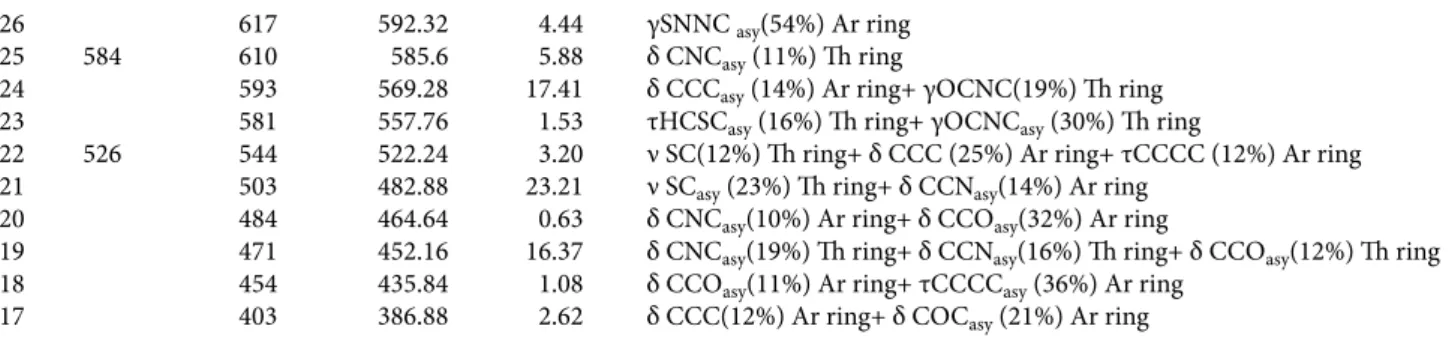
4. 5. Frontier Molecular Orbitals (FMOs)
The highest occupied molecular orbitals (HOMO) and the lowest unoccupied molecular orbitals (LUMO) are named as frontier molecular orbitals (FMO). The HOMO represents the ability to donate an electron, whereas LUMO as an electron acceptor represents the ability to obtain an electron.37 The calculation of these pa-rameters is very important because it allowed us to verify a lot of properties, such as the kinetic stability and
chem-ical reactivity. Figure 5 shows the atomic orbital HOMO– LUMO plot of the frontier molecular orbitals computed at B3LYP/6-311G(d,p) level for the title compound. As shown in Figure 5, in HOMO density, electrons are main-ly located on the methoxyphenyl group. However, when an electron transition occurs, the electron enters into the LUMO, and then the electron will mainly be localized on thiazole ring and carboxylic group. The positive phase is red and the negative one is green coloured. The HOMO–
Table 7. Experimental and calculated 1H and 13C NMR data for (Z)-3-N-(ethyl)-2-N’-((3-methoxyphenyl)imino)thiazolidine-4-one. Chemical shifts 1H Experimental B3LYP/6-311G(d) H51 3.78 4.03 H52 3.78 3.94 H21 3.90 4.49 H22 3.90 4.25 H31 1.29 1.02 H32 1.29 1.92 H33 1.29 1.19 H9 6.52 6.26 H7 6.67 6.71 H11 6.56 6.64 H10 7.24 7.42 H121 3.79 4.32 H122 3.79 3.74 H123 3.79 3.73 13C C1 154.23 158.27 C2 32.76 37.78 C3 12.52 15.06 C4 171.55 176.61 C5 38.26 37.57 C6 149.32 158.15 C7 110.39 113.89 C8 160.37 170.89 C9 107.22 106.29 C10 129.99 136.22 C11 113.20 120.10 C12 55.25 58.70 26 617 592.32 4.44 γSNNC asy(54%) Ar ring 25 584 610 585.6 5.88 δ CNCasy (11%) Th ring
24 593 569.28 17.41 δ CCCasy (14%) Ar ring+ γOCNC(19%) Th ring
23 581 557.76 1.53 τHCSCasy (16%) Th ring+ γOCNCasy (30%) Th ring
22 526 544 522.24 3.20 ν SC(12%) Th ring+ δ CCC (25%) Ar ring+ τCCCC (12%) Ar ring 21 503 482.88 23.21 ν SCasy (23%) Th ring+ δ CCNasy(14%) Ar ring
20 484 464.64 0.63 δ CNCasy(10%) Ar ring+ δ CCOasy(32%) Ar ring
19 471 452.16 16.37 δ CNCasy(19%) Th ring+ δ CCNasy(16%) Th ring+ δ CCOasy(12%) Th ring
18 454 435.84 1.08 δ CCOasy(11%) Ar ring+ τCCCCasy (36%) Ar ring
17 403 386.88 2.62 δ CCC(12%) Ar ring+ δ COCasy (21%) Ar ring
ν: stretching(elongation); sy: symmetric; asy: asymmetric; β: in plane bending; γ: out-of-plane bending, ω: wagging; τ: twisting; δ: bending; ρ: rock-ing; vibrational modes are based on potential energy distribution (PED) and only contributions over 10% are given; scaled frequencies are in unit of cm–1; IIR infrared intensities are in unit of km mol–1.
Table 8. Calculated energy values of the title compound by B3LY-P/6-311G(d,p) method.
Parameters Calculated energies
EHOMO –6.165
ELUMO –0.892
Energy gap (∆E) 5.273 Ionization potential (I) 6.165 Electron affinity (A) 0.892 Electronegativity (χ) 3.528 Chemical potential (μ) –3.528 Chemical hardness (η) 2.636 Chemical softness (s) 0.189 Electrophilicity index (ω) 2.361
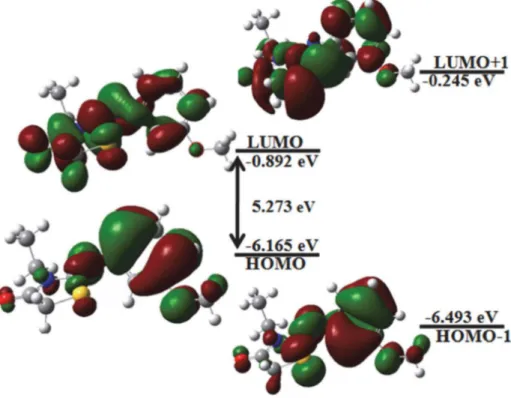
4. 7. Electrostatic Potential
In a crystal, the location of positive and negative charges allowed us to define very interesting physical properties such as the molecular electrostatic potential (MEP).38 Nowadays, theoretical and experimental MEP surfaces are determined using quantum chemistry and X-ray diffraction.39–42 The MEP around the title molecule was calculated from the total density (TD) for the title compound, the two maps (TD and MEP) are represented in the Figure 6. From the figure it can be seen that the neg-ative MEP is related to the electronegativity and partial charges of oxygen atoms O1 and O2. The blue color in Fig-ure 6B gives the maximum positive region as the preferred
Figure 5. Electron distribution of the HOMO–1, HOMO, LUMO and LUMO+1 energy levels for the title molecule.
LUMO energy gap of our molecule was calculated at the B3LYP/6-311G (d,p) level with HOMO energy −6.165 eV, LUMO energy −0.892 eV and HOMO–LUMO energy gap 5.273 eV. The second highest occupied MO (HOMO−1) and the second lowest unoccupied MO (LUMO+1) were calculated using the same level of theory. 3D plots of the HOMO−1, HOMO, LUMO and LUMO+1 orbitals of the studied molecule are drawn in Figure 4.
4. 6. Chemical Reactivity
Global chemical reactivity descriptors (GCRD) pa-rameters are a good indication to highlight the relationship between chemical reactivity and strength of structure. As are mentioned in literature, GCRD parameters can be ob-tained by using the following equations: _______________ ______The electron affinity (A) and ionization po-tential (I) can be evaluated as and . The calculated values of GCRD parameters for the title molecule are summa-rized in Table 8.
The chemical hardness (η) value is 2.636 eV indicat-ing that the charge transfer occurs within the molecule. From Table 8, the electrophilic behaviour of the molecule is confirmed by the global electrophilicity index (ω) which has a greater value of 2.361 eV. On the other hand, the chemical stability of the title molecule is explained by the chemical potential (μ) value which is −3.528 eV.
site for nucleophilic attack. In terms of color, the MEP plot lies in the fact that it simultaneously displays molecular size, shape as well as positive, negative and neutral electro-static potential regions (Figure 6). The MEP indicate well the relationship between the molecular structure and these physico-chemical properties.43–47 Among them, the mo-lecular dipole moment can be calculated. The orientation of the molecular dipole moment for the title compound is represented in Figure 7. This orientation confirms the
elec-trostatic distribution previously defined. The calculated dipole moment value is 2.24 D.
5. Conclusion
In this study, (Z)-3-N-(ethyl)-2-N’-((3-methoxyphe-nyl)imino)thiazolidine-4-one was synthesized and charac-terized by IR, 1H and 13C NMR and X-ray single-crystal diffraction techniques. The crystal structure determina-tion shows that the title compound crystallizes in mono-clinic system with space group C2/c. Theoretical calcula-tions of the molecular structures, wavenumbers and NMR spectra of the title compound have been carried out using DFT-B3LYP/6-311G(d,p). As result, the experimental and the optimized crystal structures of the title compound were slightly different. Most of the experimental bond lengths and bond angles are slightly larger than the opti-mized values. These differences are due to that the theoret-ical calculations are performed for isolated molecule in gaseous phase and the experimental results are for a mole-cule in the crystalline environment. The geometry of the solid-state structure is subject to intermolecular forces, such as Van der Waals interactions and crystal packing contacts. Comparison between the chemical shifts and the experimental data shows a very good agreement for both 1H and 13C NMR shift values. The HOMO–LUMO gap and chemical reactivity descriptors indicate that the com-pound is more stable. The general conclusion from the es-timation of the dipolar moment (2.24 D) and the electro-static potential of ((Z)-3-N-(ethyl)-2-N’-((3-methoxyphe-nyl)imino)thiazolidine-4-one molecule is that the region of the thiazolidinone group is electronegative and the me-thyl and hydrogen atoms connected to the benzene ring are electropositive.
6. Supplementary Material
Crystallographic data for the structure reported in this article have been deposited with Cambridge Crystal-lographic Data Center, CCDC 1871013. Copies of this in-formation may be obtained free of charge from the Direc-tor, CCDC, 12 Union Road, Cambridge, CB2 1EZ, UK. Facsimile (44) 01223 336 033, E-mail: deposit@ccdc.cam. ac.uk or http//www.ccdc.com.ac.uk/deposit.
7. References
1. J. Quiroga, P. Hernandez, B. Insuasty, R. Abonia, J. Cobo, A. Sanchez, M. Nogueras, J. Chem. Soc. Perkin Trans. 1 2002, 4, 555–559. DOI:10.1039/b109676a
2. I. Hutchinson, S. A. Jennings, B. R. Vishnuvajjala, A. D. West-well, M. F. G. Stevens, J. Med. Chem. 2002, 45, 744–747. DOI:10.1021/jm011025r
Figure 6. MEP plots for (Z)-3-N-(ethyl)-2-N’-((3-methoxyphenyl) imino)thiazolidine-4-one: (a) total electron density, (b) MEP sur-face.
Figure 7. Orientation of the molecular dipole moment from DFT calculation.
a)
3. R. I. Bahoussi, A. Djafri, A. Chouaih, A. Djafri, F. Hamzaoui,
Acta Cryst. 2017, E73, 173–176.
DOI:10.1107/S205698901700041X
4. A. Srinivas, M. Sunitha, P. Karthik, K. V. Reddy, Acta Chim.
Slov. 2017, 64, 1030–1041. DOI:10.17344/acsi.2017.3805
5. K. D. Hargrave, F. K. Hess, J. T. Oliver, J. Med. Chem. 1983, 26,
1158–1163. DOI:10.1021/jm00362a014
6. W. C. Patt, H. W. Hamilton, M. D. Taylor, M. J. Ryan, J. R. Taylor, C. J. C. Connolly, J. Med. Chem. 1992, 35, 2562–2572. DOI:10.1021/jm00092a006
7. R. N. Sharma, F. P. Xavier, K. K. Vasu, S. C. Chaturvedi, S. S. Pancholi, J. Enz. Inhib. Med. Chem. 2009, 24, 890–897. DOI:10.1080/14756360802519558
8. J. C. Jaen, L. D. Wise, B. W. Caprathe, H. Tecle, S. Bergmeier, C. C. Humblet, T. G. Heffner, J. Med. Chem. 1990, 33, 311– 317. DOI:10.1021/ jm00163a051
9. K. Tsuji, H. Ishikawa, J. Med. Chem. Lett. 1994, 4, 1601–1606. DOI:10.1016/S0960-894X(01)80574-6
10. F. W. Bell, A. S. Cantrell, M. Hogberg, S. R. Jaskunas, N. G. Johansson, C. L. Jordon, J. Med. Chem. 1995, 38, 4929–4936. DOI:10.1021/jm00025a010
11. N. Ergenc, G. Capan, N. S. Gunay, S. Ozkirimli, M. Gungor, S. Ozbey, E. Kendi, Arch. Pharm. 1999, 332, 343–347.
DOI:10.1002/ (SICI)1521-4184(199910)332:10<343::AID -ARDP343>3.0.CO;2-0
12. J. S. Carter, S. Kramer, J. J. Talley, T. Penning, P. Collins, M. J. Graneto, K. Eibert, Bioorg. Med. Chem. Lett. 1999, 9, 1171– 1174. DOI:10.1007/s00706-010-0392-3
13. A. Badorc, M. F. Bordes, P. De Cointet, P. Savi, A. Bernat, A. Lale, M. Petitou, J. Med. Chem. 1997, 40, 3393–3401. DOI:10.1021/jm970240y
14. G. Aridoss, S. Amirthaganesan, M. S. Kim, J. T. Kim, Y. T. Jeong, Eur. J. Med. Chem. 2009, 44, 4199–4210.
DOI:10.1016/j.ejmech.2009.05.015
15. Bruker Analytical X-ray Systems, Inc, Apex2, Version 2 User Manual, M86–E01078, 2006, 6, Madison, WI.
16. Siemens Industrial Automation, Inc. SADABS: Area-Detec-tor Absorption Correction, 1996, Madison, WI.
17. P. W. Betteridge, J. R. Carruthers, R. I. Cooper, K. Prout, D. J. Watkin, J. Appl. Crystallogr. 2003, 36,1487.
DOI:10.1107/S0021889803021800
18. L. Palatinus, G. Chapuis, J. Appl. Crystallogr. 2007, 40, 782– 785. DOI:10.1107/S002188980702420X
19. C. Jelsch, B. Guillot, A. Lagoutte, C. Lecomte, J. Appl.
Crystal-logr. 2005, 38, 38–54.
DOI:10.1107/S0021889804025518
20. A. D. Becke, J. Chem. Phys. 1997, 107, 8554–8560. DOI:10.1063/1.475007
21. P. C. R. Kumar, V. Ravindrachary, K. Janardhana, B. Poojary,
J. Cryst. Growth 2012, 354, 182–187.
DOI:10.1016/j.jcrysgro.2012.06.006
22. A. Frish, A. B. Nielsen, A. J. Holder, Gaussview Users Manual, Gaussian Inc, Pittsburg, 2000.
23. M. H. Jamróz, J. C. Z. Dobrowolski, J. Mol. Struct. 2001, 565, 475–480. DOI:10.1016/S0022-2860(00)00908-X
24. L. J. Farrugia, “ORTEP-3 for windows-a version of
ORTEPI-II with a graphical user interface (GUI), J. Appl. Crystallogr. 1997, 30, 565–568. DOI:10.1107/S0021889897003117 25. S. Yahiaoui, A. Moliterni, N. Corriero, C. Cuocci, K. Toubal,
A. Chouaih, A. Djafri, F. Hamzaoui, J. Mol. Struct. 2019, 1177, 186–192. DOI:10.1016/j.molstruc.2018.09.052
26. N. Khelloul, K. Toubal, N. Benhalima, R. Rahmani, A. Chouaih, A. Djafri, F. Hamzaoui, Acta. Chim. Slov. 2016, 63, 619–626. DOI:10.17344/acsi.2016.2362
27. S. P. V. Chamundeeswari, E. R. J. J. Samuel, N. Sundaragane-san, Eur. J. Chem. 2011, 2, 136–145.
DOI:10.5155/eurjchem.2.2.136-145.169
28. A. Eşme, S. Güneşdoğdu Sağdınç, Spectrochim. Acta A Mol.
Biomol. Spectrosc. 2018, 188, 443–455.
DOI:10.1016/j.saa.2017.07.034
29. G. Muhammad, A. Muhammad, A. M. Khalid, J. Mol. Struct. 2018, 1160, 129–141.
DOI:10.1016/j.molstruc.2018.01.100
30. P. K. Murthy, G. Krishnaswamy, S. Armaković, S. J. Armak-ović, P. A.Suchetan, N. R. Desai, V. Suneetha, R. Sreenivasa Rao, G. Bhargavi, D. B. Arunakumar, J. Mol. Struct. 2018,
1162, 81–95. DOI:10.1016/j.molstruc.2018.02.081
31. A. Teimouri, A. N. Chermahini, M. D. Emami, Arkivoc 2008,
8, 172–187.
32. H. Dammak, A. Yangui, S. Triki, Y. A. H. Feki, J. Lumin. 2015,
161, 214–220. DOI:10.1016/j.jlumin.2015.01.010
33. M. Silverstein, G. C. Basseleer, C. Moril, Spectrometric Identification of Organic Compounds, Wiley, New York, 1981.
34. S. Muthu, J. U. Maheswari, T. Sundius, Spectrochim. Acta A
Mol. Biomol. Spectrosc. 2013, 108, 307–318.
DOI:10.1016/j.saa.2013.02.022
35. G. Socrates, Infrared Characteristic Group Frequencies, Wiley Inter Science Publication, 1980.
36. G. Varsanyi, Vibrational Spectra of Benzene Derivates, Aca-demic Press, New York, 1969.
37. K. Toubal, N. Boukabcha, Ö. Tamer, N. Benhalima, S. Altürk, D. Avcı, A. Chouaih, Y. Atalay, A. Djafri, F. Hamzaoui, J. Mol.
Struct. 2017, 1147, 569–581.
DOI:10.1016/j.molstruc.2017.06.102
38. R. Rahmani, N. Boukabcha, A. Chouaih, F. Hamzaoui, S. Goumri, J. Mol. Struct. 2018,1155, 484–495.
DOI:10.1016/j.molstruc.2017.11.033
39. H. Benaissi, M. Drissi, S. Yahiaoui, Y. Megrouss, A. Chouaih, F. Hamzaoui, J. Optoelectron. Biomed. M. 2018, 10, 73–82 40. N. Boukabcha, A. Feddag, R. Rahmani, A. Chouaih, F.
Hamzaoui, J. Optoelectron. Adv. M. 2018, 20, 140–148 41. N. Boubegra, Y. Megrouss, N. Boukabcha, A. Chouaih, F.
Hamzaoui, Rasayan. J. Chem. 2016, 9, 751–761.
42. M. Drissi, N. Benhalima, Y. Megrouss, R. Rahmani, A. Chouaih, F. Hamzaoui, Molecules 2015, 20, 4042–4045. DOI:10.3390/molecules
43. J. S. Murray, K. Sen, Molecular Electrostatic Potentials, Con-cepts and 399 Applications, Elsevier, Amsterdam, 1996. 44. E. Scrocco, J. Tomasi, in: P. Lowdin (Ed) Advances in
Quan-tum Chemistry, Academic Press, New York. 1978. 402. 45. F. J. Luque, M. Orozco, P. K. Bhadane, S. R. Gadre, J. Phys.
Chem. 1993, 97, 9380–9384. DOI:10.1021/j100139a021
46. J. Sponer, P. Hobza, Int. J. Quant. Chem. 1996, 57, 959–970. DOI:
10.1002/(SICI)1097-461X(1996)57:5<959::AID-QUA16>3.0.CO;2-S
47. M. Govindarajan, M. Karabacak, Spectrochim. Acta A Mol.
Biomol. Spectrosc. 2012, 96, 421–435.
DOI:10.1016/j.saa.2012.05.067
Povzetek
V prispevku poročamo o sintezi in karakterizaciji (Z)-3-N-(etil)-2-N’-((3-metoksifenil)imino)tiazolidin-4-ona z FT-IR,
1H in 13C NMR ter z rentgensko difrakcijo monokristala. Eksperimentalna potrditev kristalne strukture temelji na
pri-dobljenih rentgenskih difrakcijskih podatkih. Pomembna značilnost strukture je obstoj dihedralnega kota, ki ga tvorita ravnini benzenskega in tiazolidinonskega obroča, v vrednosti 86.0°, kar kaže na odsotnost π–π interakcij, hkrati pa naka-zuje na neplanarno strukturo. V kristalu so molekule povezane s C–H···O in C–H···N vodikovimi vezmi, ki so odgovorne za trodimenzionalno molekulsko pakiranje v strukturi. Da bi lahko eksperimentalne rezultate primerjali s teoretično izračunanimi, smo izvedli kvantno kemijske DFT izračune s pomočjo B3LYP/6-311G(d,p) baznega seta. Ob tem smo izračunali še elektrostatski potencial okoli molekule ter HOMO in LUMO energijske nivoje. Ugotovili smo orientacije dipolnih momentov in s tem razkrili naravno inter- in intramolekularnih prenosov naboja. Nazadnje smo s pomočjo izračuna deskriptorjev kemijske reaktivnosti potrdili še stabilnost opisane spojine.