HAL Id: hal-02780468
https://hal.inria.fr/hal-02780468
Submitted on 4 Jun 2020
HAL is a multi-disciplinary open access
archive for the deposit and dissemination of
sci-entific research documents, whether they are
pub-lished or not. The documents may come from
teaching and research institutions in France or
abroad, or from public or private research centers.
L’archive ouverte pluridisciplinaire HAL, est
destinée au dépôt et à la diffusion de documents
scientifiques de niveau recherche, publiés ou non,
émanant des établissements d’enseignement et de
recherche français ou étrangers, des laboratoires
publics ou privés.
Bringing Fairness in LoRaWAN through SF Allocation
Optimization
Christelle Caillouet, Martin Heusse, Franck Rousseau
To cite this version:
Christelle Caillouet, Martin Heusse, Franck Rousseau. Bringing Fairness in LoRaWAN through SF
Allocation Optimization. ISCC 2020 - 25th IEEE Symposium on Computers and Communications,
Jul 2020, Rennes, France. �10.1109/ISCC50000.2020.9219611�. �hal-02780468�
Bringing Fairness in LoRaWAN through SF
Allocation Optimization
Christelle Caillouet
†, Martin Heusse
∗, Franck Rousseau
∗∗Univ. Grenoble Alpes, CNRS, Grenoble INP, LIG, F-38000 Grenoble France
†Univ. Cˆote d’Azur, CNRS, Inria, I3S, F-06900 Sophia Antipolis
Email: [email protected], [martin.heusse,franck.rousseau]@imag.fr
Abstract—We propose an optimization model for single-cell LoRaWAN planning which computes the limit range of each spreading factor (SF) in order to maximize the minimum packet delivery ratio (PDR) of every node in the network. It allows to balance the opposite effects of attenuation and collision of the transmissions and guarantee fairness among the nodes. We show that our optimization framework improves the worst PDR of the nodes by more than 13 percentage points compared to usual SF boundaries based on SNR threshold. A study of the tradeoff between precision and resolution time of the model shows its effectiveness even with a small number of possible distance limits, and its scalability when the node density increases.
I. INTRODUCTION
Low Power Wide Area Networks enable long range com-munications for Internet of Things (IoT) applications such as nation-wide cellular networks or private data collection systems. One of the main technology for LPWAN is LoRa whose physical layer uses CSS (Chirp Spread Spectrum) for robust communication in the sub-GHz ISM band. There are several spreading factors (SF) to choose from, which allows to trade data rate for range. LoRaWAN defines a channel access method based on ALOHA with rare feedback from the gateway. Transmissions using different spreading factors are quasi-orthogonal —in case of a collision, both frames succeed if one is not several orders of magnitude stronger than the other. For collisions in the same SF, a frame succeeds if it is significantly stronger than the other one.
One of the main issues in LoRa and LoRaWAN concerns the radio channel capacity. Performances of LoRaWAN have recently been well investigated [1]–[7]. Different models have been proposed and try to capture the effects of collisions between transmissions occurring in the same SF and the same channel, that are very harmful to the network performance. Alleviating attenuation or collisions have antagonistic effects because switching to a larger SF results in more robust trans-missions but with longer duration, which increases contention, hence collision probability. We will see that it is wise to control the number of nodes using higher SFs because they occupy much more channel capacity than nodes with lower SFs. Similarly, a smaller cell can handle more nodes than a larger one because SF allocation is less constrained, as basically all nodes are able to use a small SF.
In order to improve LoRaWAN performance, a number of works have proposed resource optimization methods [8]– [10] for SF allocation. We study this question from a slightly
−10 −5 0 5 10 − 10 − 5 0 5 10 rep(0, 6) rep(0, 6) SF7 SF8 SF12 SF9 l5 l4 l3 l2 l1 l0
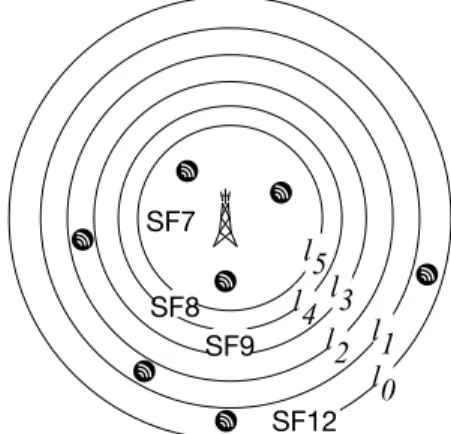
Figure 1: Annuli of SF allocation around the gateway
different perspective. We seek to balance the packet delivery ratio (PDR) in the network to ensure fairness among nodes by properly allocating the spreading factors (SF), based on an accurate system model taking into account both attenuation and collisions to derive a representative PDR formula.
The contributions of this paper are as follows: we first derive a simple accurate model for collisions and physical capture, which gives better insight into the dynamics of packet loss due to ALOHA with capture effect. We consider a traffic model where all nodes have the same traffic intensity. Then, based on this model, we derive an optimization framework to fairly determine the SF boundaries of a network cell in order to guarantee the largest PDR to all nodes, regardless of their distance to the gateway.
We start by describing our model in the next section, before looking at the optimization of the SF boundaries in Section III. Numerical results are then presented in Section IV. We then review existing work of the literature in Section V and conclude.
II. SYSTEM MODEL AND PERFORMANCEMETRIC
We consider the packet delivery ratio (PDR) as performance metric. The PDR models the ratio of the number of messages received by the gateway over the total number of transmitted messages, taking into account the channel model, SNR, and collisions due to interferences.
We consider a single cell LoRaWAN with one gateway
and n nodes homogeneously scattered with spatial density
ρ = n/(π × R2) on the cell disk of finite radius R. The
number of nodes allocated to SF(12 − j) is a function of the
radii defining the annulus between lj+1 and lj around the
gateway (see Figure 1). We neglect the presence of nodes
beyond l0. Each node has the same traffic intensity that
depends on the data generation pattern of the application. We consider a network with a single application, in which case all nodes produce the same traffic following a Poisson process of intensity λt. We base the choice of λt on the duty cycle
limitations as explained below.
In LoRaWAN, nodes have to limit their occupation of each frequency band to 1% of the time and there are 3 to 5 frequency channels in each band —for instance, in Europe, 3 in band h1.4 and 5 in h1.3. So we look at saturating h1.4,
with a 0.33% duty cycle per frequency channel. We set λtto
the maximum intensity for any node in the system, which is determined by the “slowest nodes”, those operating at SF12, at their authorized duty cycle limit, and using 59 B frames —the maximum size at this data rate. It corresponds to τ0= 2.47 s
of airtime, thus λt=2.47×3×1001 s−1 for 0.33% duty cycle.
All nodes transmit at power Ptx = 14 dBm in the 125
kHz-wide band. The signal power at the gateway depends on the distance and Rayleigh fading. The transmission power is attenuated depending on the distance to the gateway:
Prx= Ptx× g(di) (1)
where g(di) is the path-loss attenuation function based on
the Okumura Hata model in a suburban environment with an antenna height of 15 m. We consider a Rayleigh channel, so that the received signal power is affected by a random variable which follows an exponential distribution with unit mean. We neglect shadowing, since its net effect would be small in our case: it would modify the channel gain from each node without changing the general behavior of the system [6].
In case there is no collision, a transmission is successfully received if the SNR at the receiver is above the minimum SNR for the corresponding spreading factor [11]. Therefore, the success probability of an isolated frame reception at distance di is:
H = exp(−N qf
Prx
) (2)
where N is the thermal noise for a 125 kHz-wide band: N = −174 + NF + 10 log(BW ), with BW the signal bandwidth and NF the receiver noise figure that can be considered to
have a value of 6 dB in the hardware implementations, and qf
is the minimum SNR for the corresponding spreading factor f . We assume an antenna gain of 6 dB.
For SF = 12−j, the number of nodes contending with each other is thus nj = πρ (lj2− l
2
j+1) so that traffic occupancy
is vj = njτjλt (in Erlang), where τj is the transmission
duration. In this work, we adopt a simplifying assumption that there are no inter-SF interferences, although it may have some impact [3], [6], [8].
Table I: Notations
Spatial density of nodes ρ
Traffic generation intensity λt
Frame transmission duration at SF(12 − j) τj
Distance of farthest node at SF(12 − j) lj
Traffic occupancy (in Erlang) at SF(12 − j) vj
Average channel gain at distance d g(d)
SNR threshold for SF(12 − j) qj
Transmission power, in-band noise power P , N Success probability, due to attenuation, fading, thermal noise H Success probability, due to collisions Q
For a given transmission attempt, provided that it has already met the signal strength reception condition, with probability H, we distinguish three cases:
1) if the transmission does not overlap with any other frame, it succeeds;
2) if a single frame with the same SF interferes with the transmission, then the frame is still captured and decoded by the gateway if it is received with 6 dB more power than the colliding frame [11];
3) if more than two frames overlap the transmitted one, we simply deem it lost. In fact —as the calculation for case 2 makes apparent—, collisions with successful capture are already relatively rare, so meeting the capture condition for two frames is effectively quite unlikely. For a tagged transmission, the probability of case 1 is
Q1 = exp (−2vj) , as there should be no other transmission
event during 2τj to avoid overlap. Case 2 happens when a
single transmission occurs during this time with probability 2 vjexp(−2vj). If we neglect the variability of g(d) among
the nodes using the same SF, the received power in each annulus follows an exponential distribution. Successful frame capture occurs for a difference of 6 dB in received power, which correspond to a factor of 4. Since the probability that an exponential random variable is x times above another one is x+11 , the success probability of frame capture is 15 and the probability of success in case 2 is
Q2=
2
5vjexp(−2vj). (3)
Thus, the presence of concurrent traffic impacts the packet reception probability by a ratio Q:
Q = Q1+ Q2= (1 +
2
5vj) exp(−2vj). (4)
And, combining 2 and 4, we get the probability of successful packet reception:
PDR = H × Q (5)
III. IMPROVING FAIRNESS WITH A BETTERSF
ALLOCATION
We study SF allocation, which is the process of assigning a spreading factor SF to each node. In practice, this is achieved using LoRa MAC Adaptive Data Rate (ADR) commands issued by the network server, telling end nodes which SF to use
Table II: SNR-based SF boundaries (km) SF7 SF8 SF9 SF10 SF11 SF12 Cell Htarget l5 l4 l3 l2 l1 l0 surface 99.4% 1.05 1.26 1.52 1.83 2.14 2.50 20 92% 2.10 2.53 3.05 3.67 4.28 5.00 79 74% 2.94 3.54 4.27 5.14 5.99 7.00 154 τj(ms) 102.7 184.8 328.7 616.5 1315 2466 ↑ qj(dB) -6 -9 -12 -15 -17.5 -20 (km2)
based on the observed SNR at the gateway. In the following, we consider three scenarios with three different radio ranges of 2.5, 5 and 7 km (small, medium and large cell radius). A. SNR-based SF boundaries
Before taking into account medium access contention, it is reasonable to start by setting the SF of each node so that it meets a given target PDR. The idea is to have a similar success probability Htarget across all annuli. For a given cell
radius, Htarget is fixed, for instance, in a medium range cell,
Htarget = 92%, which is the value of H at range 5 km. We
change SF each time the probability of success H drops below this target value. Solving Equation 2 for each j gives the range for each SF shown in Table II.
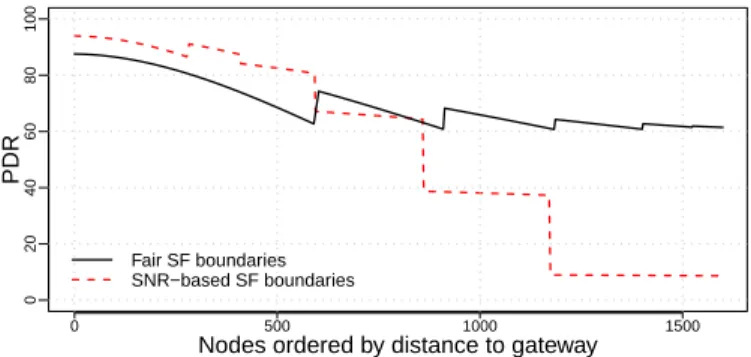
Dashed red lines in Figures 2, 3 and 4 show the PDR for the three cell sizes mentioned above. For the small, medium and large cell size, we consider between 1000 and 6500 nodes, 500 and 4000 nodes, and 50 and 1500 nodes respectively. We present the evolution of the minimum achievable PDR in Figure 10 and the PDR repartition in the network for 4000, 1600 and 400 nodes in Figures 2, 3, and 4. We order the nodes by distance to the gateway: e.g. the 4000thnode is at a distance of 2.5 km in the small cell case.
All figures exhibit the same trend. Close to the gateway, for
small SFs, there is little contention (vj 1) and the PDR
is satisfactory. But farther away, two adverse effects combine. First, higher SF transmissions take more airtime, resulting in a higher collision probability. Secondly, for a given SF, the area of each annuli gets larger when going outward of the coverage disk, thus including more nodes, resulting in more collisions. Almost half of the nodes end up using the two most robust modulations, SF11 or SF12, resulting in very low PDRs, due to a large number of collisions.
B. Fair SF boundaries
To avoid the unwanted effects of the traffic concentration in peripheral annuli, it is necessary to adjust the SNR at which the nodes change SF. To this end, we propose an
optimization framework computing the SF boundaries lj such
that it maximizes the minimum PDR among all SFs.
Given the node distribution ρ, we seek to maximize the minimum value of the PDR at the boundaries lj, j = 1, ..., 5.
To avoid the complexity of finding values lj in a continuous
space, we discretize the cell radius segment [0, l0] into a set
D of possible distances (the number of samples |D| is a parameter given as input of the model) and we try to allocate
0 20 40 60 80 100
Nodes ordered by distance to gateway
PDR
Fair SF boundaries SNR−based SF boundaries
0 1000 2000 3000 4000
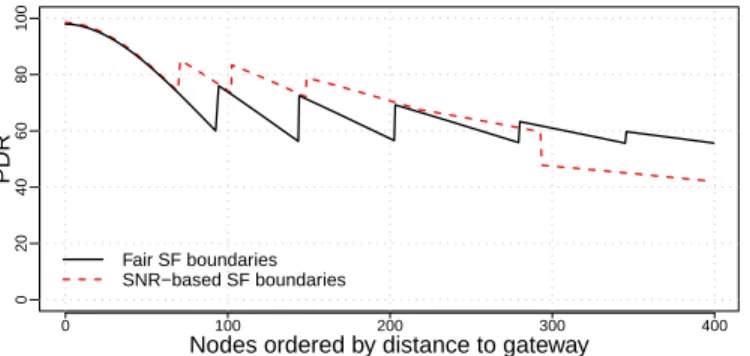
Figure 2: Small cell radius (2.5km), 4000 nodes. PDR of nodes in function of distance with the 2 SF boundaries policies.
0 20 40 60 80 100
Nodes ordered by distance to gateway
PDR
Fair SF boundaries SNR−based SF boundaries
0 500 1000 1500
Figure 3: Medium cell radius (5km), 1600 nodes. PDR of nodes in function of distance with the 2 SF boundaries policies.
one distance d ∈ D per lj. We introduce binary variables x
j d
stating if lj is set to distance d or not. We derive a linear
program for the fair SF boundaries computation as follows.
max minj=0,...,5PDR(j) (6) s.t. P d∈Dx j d= 1 ∀j = 1, ..., 5 (7) x0l 0 = 1 (8) xjd∈ {0, 1} ∀d ∈ D, j = 0, ..., 5 (9)
The constraints ensure that only one distance is allocated to each SF boundary (Constraints (7)), and we fix the limit range
of SF12 to the maximum communication range l0(Constraints
(8)). Recall from Equation (5) the formulation of the PDR :
PDR(j) = exp(− N qj
Ptx× g(lj)
) × (1 +2
5vj) exp(−2vj) (10) This formula depends on the boundaries lj and lj+1that have
to be determined by our model. We thus have to include the binary variables xjd and xj+1d0 , with d0 < d, in the expression of the objective function (6) to compute the actual value of the
PDR if SF12−j and SF12−(j+1) boundaries are set to d and
d0. Objective function (6) can thus be rewritten as follows: max min j=0,...,5 X d∈D e(− N qj Ptx×g(d))xjd×X d0<d (1+2 5vj)e (−2vj)xj+1 d0 (11)
0 20 40 60 80 100
Nodes ordered by distance to gateway
PDR
Fair SF boundaries SNR−based SF boundaries
0 100 200 300 400
Figure 4: Large cell radius (7km), 400 nodes. PDR of nodes in function of distance with the 2 SF boundaries policies.
with vj= πρ (d2−d02)τjλt. We finally linearize Equation (11)
by introducing a new set of binary variables yddj 0= x
j d× x
j+1 d0 to obtain a linear program solved using IBM Cplex solver.
IV. NUMERICAL RESULTS
We present the results of our model for the three sizes of LoRa cell presented in the previous section. However, we have developed the model so that it can be executed for various scenarios. The only parameters needed to run the model are
the number of nodes, the maximum range l0 of the cell, and
the number of samples |D| to discretize the cell radius. Given
|D|, we choose the distance values di = l0×pi/|D|, for
i = 1, ..., |D|, so as to define equal-area based limits, so that the distance steps are closer from each other far from the gateway, for the large SFs.
By balancing the impact of attenuation and collisions, our optimization allows to achieve similar level of losses for all nodes, as can be seen on the solid black curves in Figures 2, 3 and 4. The SF boundaries optimizing fairness are also pre-sented in Table III. In the small and medium cell scenario, in which losses due to collisions have more weight, there is a dramatic improvement between the SNR-based and the fair SF boundaries. The minimum PDR goes from 0.21 to 63.6% in the small cell, and from 8.63 to 60.73% in the medium cell. This allows hundreds of nodes to reach satisfactory loss rates. In the large cell, the gain is less important but still represents 13 percentage points for the most distant nodes (going from 42 to 55.64%).
Interestingly, very few nodes use SF12 after optimization, and the range of SF7 always increases in comparison to the SNR-based boundaries. The smaller the cell, the larger the SF7 range, but consequently the larger the PDR loss of the nodes closed to the gateway. This negative effect is counterbalanced by the gain of distant nodes: in every scenario at least 50% of the nodes have a PDR greater or equal as in the SNR-based case. The fact that as many nodes as possible should use smaller SFs corroborates previous findings [12], although, as soon as channel attenuation is different between nodes, all SFs need to be used.
Table III: Fair SF boundaries (km)
SF7 SF8 SF9 SF10 SF11 SF12 Hmin l5 l4 l3 l2 l1 l0 95.7% 1.70 2.11 2.32 2.43 2.47 2.50 68.9% 3.03 3.77 4.30 4.68 4.88 5.00 57.2% 3.40 4.20 4.99 5.86 6.51 7.00 50 100 150 200 250 300 |D| 101 100 101 102 103 104 105
resolution time (s) small cell (2.5km)
medium cell (5km) large cell (7km)
Figure 5: Resolution time of the model in function of the number of samples of the cell distances |D|.
A. Solution accuracy
Our model relies on the discretization of the cell radius. The optimal solution is approximated by considering discrete val-ues for all the possible distances in [0, l0]. The smaller the step
between two distances d ∈ D, the better the approximation. The number of samples used (i.e. |D|) is a key parameter for the model complexity. Increasing |D| drastically increases the number of binary variables (|SF|(1 + |D|) more variables each time |D| increases by 1), and therefore the resolution time of the model, as we can see on Figure 5.
However, as shown on Figure 6, we quickly converge to an accurate minimum PDR since the objective value does not increase much with the number of samples |D|. The difference of the minimum PDR achievable for all nodes in the network between 50 and 300 samples is less than 1%. It allows us to compute very accurate SF boundaries in less than 100 seconds of resolution time, to balance the PDR between the nodes and ensure the best performances for the nodes independently of their distance to the gateway.
Also, we note that increasing the number of samples does not always improve the objective value of the minimum achievable PDR in the network. Our optimization model finds the best combination of SF boundaries within a given sets of distances, and it can give slightly lower values of PDR even though a larger set of distances is used. Two sets of distances D and D0 with |D| < |D0| can be completely disjoint, due to the way samples are computed (presented in the beginning of Section IV).
B. Scalability
We run our model with different node densities to analyze how the SF boundaries and PDR evolve with the number of nodes in the cell. We set the number of samples |D| to 100
50 100 150 200 250 300 |D| 20 30 40 50 60 70 80 min PDR small cell (2.5km) medium cell (5km) large cell (7km)
Figure 6: Minimum value of the PDR in function of the number of samples of the cell distances |D|.
0 20 40 60 80 100 Distance to gateway (m) PDR 4000 nodes 2000 nodes 1000 nodes 0 500 1000 1500 2000 2500
Figure 7: Small cell range (2.5km). Evolution of the fair SF boundaries and associated PDR in function of the distance to the gateway.
since we show that the solutions are accurate and obtained rapidly.
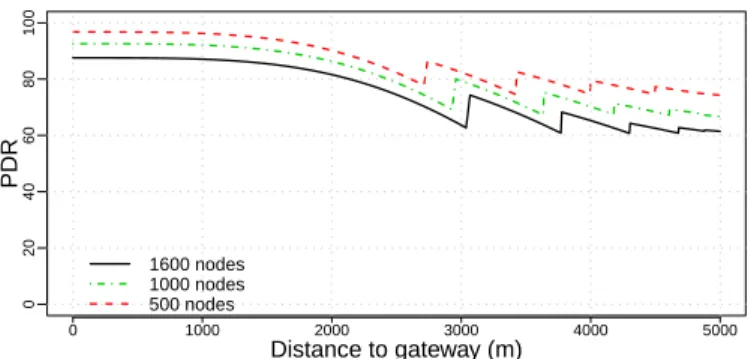
First, we analyze the evolution of the fair SF boundaries with various node densities in the cell. For the small cell, the boundaries do not vary much with the node density (Figure 7). For the medium and large cases (Figures 8 and 9), the small SF ranges increase: the greater the node density, the more area is covered with lower SFs. Incidentally, it reveals that SF12 does not help much when the node density is high, since the number of collisions steeply increases with traffic at this data rate.
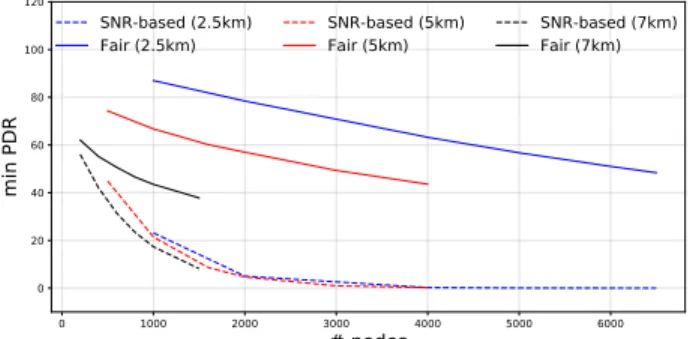
We then evaluate the evolution of the minimum achiev-able PDR in function of the number of nodes in the cell in Figure 10. We show that our SF boundaries allocation preserves an acceptable rate when the node density increases in comparison to the SNR-based SF allocation. Indeed, the PDR quickly drops to 0% with the SNR-based SF boundaries because the SF allocation does not take into account collisions which increase with the node density. Our policy balances the effect of collisions and ensures a minimum PDR of 60% with up to 4500 nodes in the small cell, 1600 nodes in the medium cell, and 260 nodes in the large cell.
V. RELATED WORK
Recent research on LoRa has mainly focused on perfor-mance evaluation in terms of coverage, capacity, scalability
0 20 40 60 80 100 Distance to gateway (m) PDR 1600 nodes 1000 nodes 500 nodes 0 1000 2000 3000 4000 5000
Figure 8: Medium cell range (5km). Evolution of the fair SF boundaries and associated PDR in function of the distance to the gateway. 0 20 40 60 80 100 Distance to gateway (m) PDR 400 nodes 200 nodes 100 nodes 0 1000 2000 3000 4000 5000 6000 7000
Figure 9: Large cell range (7km). Evolution of the fair SF boundaries and associated PDR in function of the distance to the gateway.
and lifetime. The studies define analytical models for the network capacity [1]–[6] evaluating the number of supported nodes in a LoRaWAN cell. In many recent papers focusing on the LoRaWAN radio capacity, the assumption is that all nodes use up their allowed duty cycle regardless of their SF. Practically, this means that they send much more packets when closer to the gateway, which is not realistic. In this case, when the capacity is expressed in terms of throughput, this assumption may be optimistic as it means being able to fill-up all available quasi-orthogonal subchannels [2]. On the contrary, if the capacity is expressed as a number of nodes [1], [6], [13], it gives dramatically small values because then, moving a node to a smaller SF brings very little benefit, since it immediately transmits much more traffic and thus creates similar levels of congestion.
Fairness in LoRa networks has already been investigated so far by properly allocating the physical resources such as bandwidth (BW), data rates (DR), power control (PC), and spreading factors (SF). Abdelfadeel et al. [12] propose a trans-mission power control algorithm balancing the received signal powers at the gateway and ensuring a fair collision probability among the nodes, without taking into account Rayleigh fading, so that they do not consider the necessary tradeoff between fading and collisions losses. Reynders et al. also investigated fairness among packet error rate [14] and derived a min max
0 1000 2000 3000 4000 5000 6000 # nodes 0 20 40 60 80 100 120 min PDR SNR-based (2.5km)
Fair (2.5km) SNR-based (5km)Fair (5km) SNR-based (7km)Fair (7km)
Figure 10: Minimum value of the PDR in function of the number of nodes in the cell (|D| = 100).
optimization model based on log distance path loss model. Amichi et al. [9] consider SF imperfect orthogonality in their optimization problem to maximize the minimum achievable rate in the network. They propose an SF allocation algorithm based on matching theory to fairly allocate the SF. In their model, meeting the capture condition with probability Q in Equation (4) implies successful reception, whereas fading should still be taken into account.
Experimental measurements by Mikhaylov et al. [15] show that physical capture in presence of co-SF interference may happen well below 6 dB of power margin. Compared to our model, this would tend to increase the actual packet delivery ratio. The same paper also questions the theoretical levels of inter-SF interference: in particular, low SFs may be jammed by other signals even when the power margin is of the order of -6 dB, whereas the expected values would be at least 10 dB lower [11]. This is not overly critical: first, interference from higher SFs comes from nodes located farther away, so they face greater attenuation and are thus relatively harmless. Secondly, for the fair SF allocation, channel utilization is much reduced for higher SFs, so that nodes within the lower SF annuli face lesser levels of accumulated interference from farther nodes compared to distance-based or even SNR-based SF allocation for instance.
Our Aloha model captures the fact that collisions happen
when other frames overlap within 2τj around a transmission
event, which is not the case in Georgiou’s model [1], [13] (which would correspond to slotted Aloha or to continuous transmissions as in CDMA networks).
VI. CONCLUSION
In this paper, we present an optimization framework to fairly determine the SF boundaries of a network cell in order to guarantee the largest packet delivery ratio to all nodes, regardless of their distance to the gateway. We base our framework on an accurate system model for collisions and physical capture, and with the same traffic intensity to all nodes. Results show the effectiveness of our approach.
It allows to balance the opposite effects of attenuation and collisions.
However, we can see that the solution might still be improved, in particular because the PDR for some SF is significantly higher than its surrounding ones, for instance SF11 in Figure 2. A careful adjustment of the boundaries around these specific SF might lead to an even better node repartition, while still guaranteeing the same minimum PDR. Finally, we leave as future work the extension of the model to networks with several gateways and macro-diversity reception.
REFERENCES
[1] O. Georgiou and U. Raza, “Low power wide area network analysis: Can LoRa scale?” IEEE Wireless Communications Letters, vol. 6, no. 2, pp. 162–165, Apr. 2017.
[2] Z. Li, S. Zozor, J.-M. Brossier, N. Varsier, and Q. Lampin, “2D time-frequency interference modelling using stochastic geometry for performance evaluation in Low-Power Wide-Area Networks,” in 2017 IEEE International Conference on Communications (ICC), May 2017. [3] A. Waret, M. Kaneko, A. Guitton, and N. El Rachkidy, “LoRa
through-put analysis with imperfect spreading factor orthogonality,” IEEE Wire-less Communications Letters, vol. 8, no. 2, pp. 408–411, 2019. [4] J. Pet¨aj¨aj¨arvi, K. Mikhaylov, M. Pettissalo, J. Janhunen, and J. Iinatti,
“Performance of a low-power wide-area network based on LoRa tech-nology: Doppler robustness, scalability, and coverage,” International Journal of Distributed Sensor Networks, vol. 13, no. 3, 2017. [5] K. Mikhaylov, J. Petaejaejaervi, and T. Haenninen, “Analysis of
Ca-pacity and Scalability of the LoRa Low Power Wide Area Network Technology,” in 22th European Wireless Conference, May 2016. [6] A. Mahmood, E. Sisinni, L. Guntupalli, R. Rondon, S. A. Hassan, and
M. Gidlund, “Scalability analysis of a LoRa network under imperfect orthogonality,” IEEE Transactions on Industrial Informatics, 2018. [7] A. Duda and M. Heusse, “Spatial issues in modeling LoRaWAN
capacity,” in 22nd ACM International Conference on Modeling, Analysis and Simulation of Wireless and Mobile Systems (MSWIM), Nov. 2019. [8] C. Caillouet, M. Heusse, and F. Rousseau, “Optimal SF Allocation in
LoRaWAN Considering Physical Capture and Imperfect Orthogonality,” in IEEE Global Communications Conference (GLOBECOM), Dec. 2019. [9] L. Amichi, M. Kaneko, N. E. Rachkidy, and A. Guitton, “Spreading factor allocation strategy for LoRa networks under imperfect orthog-onality,” in 2019 IEEE International Conference on Communications (ICC), May 2019.
[10] D. Zorbas, G. Z. Papadopoulos, P. Maill´e, N. Montavont, and C. Douligeris, “Improving LoRa network capacity using multiple spread-ing factor configurations,” in 25th International Conference on Telecom-munications, ICT, 2018, pp. 516–520.
[11] C. Goursaud and J. M. Gorce, “Dedicated networks for IoT: PHY / MAC state of the art and challenges,” EAI Endorsed Transactions on Internet of Things, vol. 1, no. 1, Oct. 2015.
[12] K. Abdelfadeel, V. Cionca, and D. Pesch, “Fair adaptive data rate allocation and power control in LoRaWAN,” in World of Wireless, Mobile and Multimedia networks (WoWMoM), Feb. 2018.
[13] A. Hoeller, R. D. Souza, O. L. Alcaraz L´opez, H. Alves, M. de Noronha Neto, and G. Brante, “Analysis and Performance Optimization of LoRa Networks With Time and Antenna Diversity,” IEEE Access, vol. 6, 2018.
[14] B. Reynders, W. Meert, and S. Pollin, “Power and spreading factor control in low power wide area networks,” in 2017 IEEE International Conference on Communications (ICC), May 2017.
[15] K. Mikhaylov, J. Pet¨aj¨aj¨arvi, and J. Janhunen, “On LoRaWAN scalabil-ity: Empirical evaluation of susceptibility to inter-network interference,” in European Conference on Networks and Communications (EuCNC), June 2017.