HAL Id: hal-03119657
https://hal.archives-ouvertes.fr/hal-03119657
Submitted on 25 Jan 2021
HAL is a multi-disciplinary open access
archive for the deposit and dissemination of
sci-entific research documents, whether they are
pub-lished or not. The documents may come from
teaching and research institutions in France or
abroad, or from public or private research centers.
L’archive ouverte pluridisciplinaire HAL, est
destinée au dépôt et à la diffusion de documents
scientifiques de niveau recherche, publiés ou non,
émanant des établissements d’enseignement et de
recherche français ou étrangers, des laboratoires
publics ou privés.
Long-range transport of Icelandic tephra to the Irminger
Basin, Site 919
C. Lacasse, R. Werner, M. Paterne, H. Sigurdsson, S. Carey, G. Pinte
To cite this version:
C. Lacasse, R. Werner, M. Paterne, H. Sigurdsson, S. Carey, et al.. Long-range transport of
Ice-landic tephra to the Irminger Basin, Site 919. Proceedings of the Ocean Drilling Program, 152
Scientific Results, 152, Ocean Drilling Program, 1998, Proceedings of the Ocean Drilling Program,
�10.2973/odp.proc.sr.152.205.1998�. �hal-03119657�
5. LONG-RANGE TRANSPORT OF ICELANDIC TEPHRA TO THE IRMINGER BASIN, SITE 919
1 Christian Lacasse,2 Reinhard Werner,3 Martine Paterne,4 Haraldur Sigurdsson,2 Steven Carey,2 and Guy Pinte5ABSTRACT
The 147-m-long sediment sequence recovered from Ocean Drilling Program Leg 152 Site 919 in the Irminger Basin con-tains several well-preserved volcanic ash layers and ash zones that provide a record of long-range transport of tephra from Ice-land toward GreenIce-land during the Pliocene−Pleistocene. A total of eight tephra layers and ash pods as well as three ash zones recovered in two separate holes (919A and 919B) were analyzed for major and trace element chemistry and grain size. Relative ages of the tephra layers were estimated based on oxygen isotope stratigraphy and correlation with other chronostratigraphic markers present in North Atlantic sediments and ice cores in Greenland. Based on their sorting coefficient and grain size, it is inferred that discrete ash layers between 1 and 5 cm thick are the result of ash fallout from large explosive eruptions. The tephra are bimodal (colorless/rhyolitic and sideromelane-tachylite/basaltic glass) or basaltic in composition, with crystal content between less than 15% for the discrete layers to more than 50% for the ash zones. The major element composition of glasses indicates two compositional groups: basaltic and rhyolitic. All of the tephra layers have an affinity with either a tholeiitic or an alkalic source in Iceland. Two separate mixed tephra layers, occurring between 10 and 11 m below seafloor at Site 919, were found to correlate with the ice-rafted ash Zone 2, based on their rhyolitic glass chemistry. Ash Zone 2 is a chronostratigraphic marker dated at about 55−57 ka in marine sediment and at about 52 ka in a Greenland ice core. The rhyolitic mixed tephra are interpreted to have been erupted during two large explosive eruptions of Tindfjallajökull volcano in southern Iceland, at a few hundred years interval.
From the current pattern of seasonal variation in the atmospheric circulation over Iceland, it is suggested that the tephra were likely transported by easterly winds occurring at about 30 km elevation in midsummer, followed by fallout in southern Greenland and in the Irminger Basin.
INTRODUCTION
A total sediment sequence of 147 m was cored in the Irminger Ba-sin at Site 919, in three drill holes (62°40.20′N, 37°27.61′W; 2088 m water depth; Fig. 1). Quaternary sediments of Site 919 were found to be the only sediments recovered during Leg 152 that preserved dis-crete ash layers. The scarcity of ash layers is likely to be a result of the great distance from Iceland, which is approximately 750 km to the east-northeast. Magnetobiostratigraphic data indicate a minimum sedimentation rate for Holes 919A and 919B of about 12 cm/k.y. with the Brunhes/Matuyama boundary located at about 120 m below sea-floor (mbsf), dating the entire sequence of Pliocene−Pleistocene age. This study focuses on the Pliocene−Pleistocene tephra layers recov-ered from Cores 919A-1H through 10H, and from Cores 152-919B-1H through 8H, with the sequence in Hole 919B drilled be-tween 18.7 and 90.0 mbsf. Continuous advanced piston corer (APC) coring from the top to the bottom of the Hole 919A sequence was completed with a total recovery of 100%. Such excellent recovery al-lowed an age model to be constructed, based on the δ18O of
plankton-ic foraminifers, in spite of limited sampling resolution (Flower, this volume). Among all the records from Deep Sea Drilling Project (DSDP) and Ocean Drilling Program (ODP) and current piston cor-ing, drilling at Site 919 was by far the longest recovered in the Irminger Basin, providing new information on the marine sedimenta-tion of volcanic ash as well as ice-rafted debris for approximately the last 800 k.y., a period characterized by full-scale glacial-interglacial oscillations. Based on the high accumulation/resolution record of Site 919 and its proximity to Greenland, the recovery and study of volca-nic ash layers present in this sequence are of particular interest for the
purpose of correlating them with atmospheric records (i.e., ice cores) on Greenland. We performed analyses on six discrete tephra layers and two ash zones in addition to four ash pods, which were located based on shipboard description (Shipboard Scientific Party, 1994a). Electron microprobe analysis of volcanic glass shards and instrumen-tal neutron activation analysis (INAA) of bulk ash layers were used to infer potential sources. Based on their grain-size characteristics and their distance from the source, an attempt is made to interpret the mode of transport and deposition of the discrete tephra layers.
PALEOENVIRONMENT AND SEDIMENTATION IN THE IRMINGER BASIN
Initiation and formation of the Irminger Basin resulted from sub-sidence and deepening of the seafloor between East Greenland and the Reykjanes Ridge from the early Eocene (Larsen, 1990). The sed-imentary environment evolved progressively from shallow shelf con-ditions (early and middle Eocene) to deep marine concon-ditions (late Oligocene to present). Oceanic surface circulation in the basin is dominated at present by a counterclockwise gyre represented by the Irminger Current and the East Greenland Current flowing southward along the East Greenland coast (Johannessen, 1986). Paleoceano-graphic reconstruction during the Last Glacial Maximum (LGM) at 18 ka, indicates, however, that this current system was weakened as a result of a southward shift of the polar front and sea ice cover (Kellogg, 1980).
Late Quaternary sedimentation in the Irminger Basin was partic-ularly sensitive to climate fluctuations, with the repeated advance and retreat of the polar front as well as continental ice (Ruddiman and McIntyre, 1973; Kellogg, 1975; Ruddiman and McIntyre, 1976). Deposition of carbonate ooze (interglacial periods) alternated with glacio-marine deposits (glacial periods). This lithologic succession characterizes the central part of the Basin, which was not influenced by terrigenous inputs from either the Greenland or Iceland shelves, or indeed from the aseismic ridge connecting the two (e.g., core SU9029 in Lacasse et al., 1996).
1Saunders, A.D., Larsen, H.C., and Wise, S.W., Jr. (Eds.), 1998. Proc. ODP, Sci.
Results,152: College Station, TX (Ocean Drilling Program).
2Graduate School of Oceanography, University of Rhode Island, Narragansett, RI 02882, U.S.A. Lacasse: lacasse@gsosun1.gso.uri.edu
3GEOMAR, Wischhofstrasse, D-2300 Kiel 14, Federal Republic of Germany. 4Centre des Faibles Radioactivités, Gif-sur-Yvette, France.
5Centre d’Etudes Nucléaires de Saclay, Laboratoire Pierre Süe, Gif-sur-Yvette,
C. LACASSE ET AL.
52
Site 919 is only approximately 200 km from the present shoreline of East Greenland and was therefore probably subject to repeated ep-isodes of large fluxes of terrigenous material transported by turbidity currents and slumping from the prograding Greenland shelf. Drilling at Sites 914−917 on the continental shelf (Fig. 1), only 40−75 km from the Greenland coast, shows evidence of the extension of the Greenland Ice Sheet (GIS) at least 75 km onto the continental shelf (Larsen et al., 1994). While full-scale glaciations occurred in Green-land during the late Pleistocene glacial maxima, rapid accumulation of glacio-marine sediments probably diluted any other type of sedi-ment in the Site 919 region.
Glauconitized hardgrounds, showing erosional features and poor-ly sorted sand at their tops, were found in lithologic Unit II of Site 918 (Shipboard Scientific Party, 1994b) (Fig. 1). These sedimento-logical features suggest that sand was transported and deposited by a highly concentrated flow from the north (i.e., the North Atlantic Bot-tom Water [NABW] overflow into the Irminger Basin). Seismic transects off southeast Greenland indicate deposition of contourites or sediment drifts in addition to massive turbidites. The first are in-terpreted to be related to the NABW overflow from the Norwegian-Greenland Sea across the Denmark Strait (L. Clausen, pers. comm., 1995).
This sedimentological environment indicates that the tephra pre-served in Site 919 sediments were deposited during a period of high accumulation rates. Such a high-resolution marine record is compa-rable with the time frame of the atmospheric record in Greenland ice cores.
TEPHRA IN THE IRMINGER BASIN AND GREENLAND
Deep-Sea Tephra Record in the Irminger Basin Prior to Leg 152, only two sites, Sites 407 and 408 (DSDP Leg 49), had been drilled in the Irminger Basin (Luyendyk, Cann, et al.,
1979; Fig. 1). Several layers of volcanic ash were recovered from these two holes, southwest of Iceland (Varet and Metrich, 1979). At least five tephra layers were found in the Pleistocene calcareous sandy mud, and thick ash layers occur also in Pliocene and middle Miocene sediments. Clastic fragments of volcanic origin and ash lay-ers are nearly as abundant at Site 407 as at Site 408. Two types of glasses occur in an ash-rich zone, located in the uppermost 10 m, with 10% to 25% volcanogenic fragments: a brown basaltic glass and a colorless rhyolitic glass. A few crystals of alkali feldspar, plagio-clase, and quartz are associated with the colorless glass. A similar as-sociation of two glasses was found at deeper levels, at 36.5 and 147 mbsf. Thin discrete layers of essentially fresh and/or altered basaltic glass occur at 39, 115, 212.5, and 218.5 mbsf in Hole 408, in addition to a mixed tephra layer (80% basaltic and 20% rhyolitic glass) found at 115 mbsf. Numerous dark ash pods were found in the 200−209 mbsf interval, and they probably result from reworking of former ash fall layers. Two samples of rhyolitic glass fragments were selected for microprobe analysis, one from a mid-Pliocene layer in Hole 407 and one from a middle Miocene layer in Hole 408. Both analyses show an alkali rhyolite composition (Varet and Metrich, 1979). Their normative compositions plot along the quartz-feldspar cotectic for a water pressure of 1 kb in the granite system quartz-albite-orthoclase. An unpublished analysis of brown glass recovered from Miocene sediment in Hole 408 indicates a tholeiitic basalt composition low in potassium. Based on this limited study of tephra and the poor recov-ery (40% and 61%, respectively) in Holes 407 and 408, no recon-struction of the volcanic activity in the region has been proposed.
Sedimentological and chemical analyses were recently carried out on marine tephra recovered in a piston core raised from the central part of the Irminger Basin (Lacasse et al., 1996). Core SU9029 is 11.2 m long and was recovered from 1600 m water depth at 63°52′N, 28°56′W, approximately 450 km northeast of ODP Site 919 (Fig. 1). With a mean sedimentation rate of about 2.1 cm/k.y., core SU9029 spans the last 500 k.y. down to isotopic Stage 13. Only two depth in-tervals, at 91−103 and 556−568 mbsf, were found to have high
con-3000 0 4 00 km Dye3 SU9 0 3 2 SU9 0 2 9 4 0 7 4 0 8 4 0 9 9 1 4 - 9 1 7 9 1 8
9 1 9
1500 2000 2500 2500 2000 1 0 0 0 GREENLAND ICELAND Ir m ing e r Basin Iceland Basin Rey kjanes Rid ge Denm ark S tra it 1000 1000 2000 3000 500 200 500 2000 1000 500 200 200 200 4 8° 4 4° 4 0° 3 6° 3 2° 2 8° 2 4° 2 0° 1 6° 4 4°W 4 0° 3 6° 3 2° 2 8° 2 4° 2 0° 6 6°N 6 3° 6 0° 6 3° 6 0° Katla Tindfjallaj kullSediment and ice cores Volcanic sources of Ash Zones 1 and 2 Present conti nental ice
centrations of dispersed colorless glass shards. Their compositional and granulometric characteristics suggest a complex depositional process, with initial fallout of tephra on pack-ice north of Iceland fol-lowed by ice-rafting deposition from the Denmark Strait prior to bio-turbation. From their stratigraphic position and glass chemistry, they have been correlated with the ice-rafted ash Zone 2 (~55−57.5 ka) and ash Zone 3 (~305 ka) in the North Atlantic. The δ18O record
in-dicates that they were deposited during a cold spell when pack-ice covered the seas north of Iceland. The transitional composition of ash Zone 2 and the tholeiitic composition of ash Zone 3 indicate that they originated from the Southeastern Volcanic Zone and the central rift system in Iceland, respectively. Due to coring disturbance at the top of the sequence, ash Zone 1 (~11−11.1 ka; Bard et al., 1994) was not found.
Tephra in Greenland Ice Cores
Volcanic activity has been recorded in Greenland ice cores through the occurrence of acidity peaks as a result of sulfate aerosol deposition (Hammer, 1977, 1984; Zielinski et al., 1994, 1996) and fine tephra horizons (Fiacco, 1991; Palais et al., 1991, 1992; Ram and Gayley, 1991; Fiacco et al., 1993; Grönvold et al., 1995). Study of volcanic ash particles in ice cores has provided valuable information for ice core dating and atmospheric transport patterns, and it can be used with the marine record as indicators of paleovolcanic activity. Glaciochemical seasonal indicators along ice cores have provided a precise dating of the related volcanic events.
The occurrence of volcanic aerosols in the Greenland ice sheet was first reported by Hammer (1977) from the Dye 3 core, about 400 km northwest of ODP Site 919 (Fig. 1). Only one volcanic dust layer was observed in the uppermost section of the Dye 3 core. Some 10− 100 mg of ash per kilogram of ice is generally needed to give a visible coloring of the ice (Hammer, 1984). The presence of volcanic impu-rity was therefore assessed using the measurement of electrical con-ductivity (S m−1) along ice cores and by measuring the concentration
(µg kg−1) of microparticles (i.e., diameter less than 2−5 µm) from
melted ice samples. It was found that periods of high northern hemi-spheric volcanic activity have not been associated with elevated microparticle concentrations in ice cores, whereas they are indicated by specific high conductivity, for example the Laki 1783 eruption in Iceland (Hammer, 1977). High conductivity values have resulted from the fallout of acids following large eruptions and are correlated with acidity spikes (µ equiv H+ kg−1) along ice cores (Hammer,
1984). Surprisingly, most of the historical and postglacial Icelandic eruptions, with the exception of the A.D. 1362 Oræfajökull eruption (Palais et al., 1991), are not recorded as volcanic ash horizons in Greenland ice cores, but only as acidity and sulfate (SO42−, ppb)
con-centration peaks (Hammer, 1984; Zielinski et al., 1994). The strati-graphic position of the strongest postglacial acid signals was shown to correlate well between different Greenland coring sites: Crête: 71°07′N, 37°19′W; Dye 3: 65°N, 44°W; and Camp Century: 77°11′N, 61°09′W (Hammer, 1984).
The rare postglacial microparticle concentration peaks observed in Greenland ice cores have been correlated to distal volcanic events, such as the A.D. 130 Taupo eruption in a Dye 3 ice core (Hammer, 1984), the A.D. 1479−1480 Mt. St. Helens, Washington, and the A.D. 1259 El Chichon eruptions in GISP2 (Summit) ice cores (Palais et al., 1992; Fiacco et al., 1993). For the possible El Chichon event, volcanic glass shards were also reported, in addition to acidity spikes in an ice core from the Antarctic Ice Sheet, demonstrating the possi-ble interhemisphere transport of volcanic ash (Palais et al., 1990, 1992).
With the deepening of the Dye 3 Site in southern Greenland, ad-ditional ash bands have been reported (Ram and Gayley, 1991). Platy glass shards up to several hundred micrometers in diameter were found in two particle aggregates in a 78-cm section, between 1949.27 and 1950 m below the snow surface. Using the chronology of Dans-gaard et al. (1985), Ram and Gayley estimate that this depth interval
spans approximately 400 yr. Glass particles from the lowermost ag-gregate were analyzed by energy-dispersive X-ray, and they indicate rhyolitic, basaltic, and dacitic compositions. This horizon was corre-lated to the marine ash Zone 2 in the North Atlantic, based on the ma-jor element concentration of the rhyolitic glass particles and an age estimate of the ice interval studied of ~70 ka. This age estimate must be viewed with caution, however, because it has been difficult to date the Wisconsinian ice from Dye 3 (Dansgaard et al., 1985). It is also possible that the apparent double appearance of ash aggregates may be an artifact resulting from uneven subsurface topography (K. Grön-vold, pers. comm., 1995).
Several ash horizons in the Greenland Summit GRIP ice core have recently been identified and correlated based on their chemical composition to corresponding land-based and marine tephra layers (Grönvold et al., 1995). Absolute dating of the tephra was inferred by counting annual layers, providing an accurate age for the Icelandic eruptions: Settlement Layer, A.D. 871 ± 2 yr; Saksunarvatn, 10,180 ± 60 yr; ash Zone 1, Skógar Tephra (Vedde Ash), 11,980 ± 80 yr BP. An age of 52 ka for ash Zone 2 was derived from the extrapolated ice flow model. Interpretation of volcanically produced sulfate peaks re-mains, however, the best method to study time series of explosive volcanism in ice cores. Such a record has been extended over the last 110 ka from the GISP2 ice core (Zielinski et al., in press). A mini-mum of 850 events (700 of these from 9 to 110 ka) have been record-ed with the highest SO42− concentrations exceeding 500 ppb.
METHODS
Sampling Resolution and Sample Preparation All of the discrete ash layers that were identified in Holes 919A and 919B by the Shipboard Scientific Party were studied (Shipboard Scientific Party, 1994a). Ash layers or ash zones thicker than 10 cm were sampled at two different depth intervals, whereas only a single sample was taken from thinner horizons (Table 1). Each sample of bulk sediment was dried and weighed. The carbonate fraction was re-moved using hydrochloric acid. The carbonate-free residue was rinsed and wet-sieved through a set of screens (1 φ interval) down to 5.5 φ (22 µm).
Grain-Size and Modal Analyses
Each sieved fraction (>5.5 φ) was dry-weighed. The remaining fine fraction was analyzed using an automated Elzone 150+ particle analyzer with a 48-µm orifice and a conducting solution of sodium pyrophosphate (4%). This instrument uses the electrosensing tech-nique to determine particle size and can detect particles down to 1 µm in size. The combined method of wet sieving and Elzone thus allows analysis of sediment with a large grain size range. Grain-size charac-teristics (median and mean sizes, sorting and skewness) were derived from the cumulative granulometric curve (Folk, 1974; Table 1).
Abundances of the different components was estimated by count-ing approximately 300−500 grains under a microscope (Table 1). This analysis was carried out on the 62.5−125 µm or 125−250 µm fractions that contain both the most representative and reliable mate-rial for mineral determination. Pyroclastic components were divided into several groups: colorless shards, brownish glass or sidero-melane, opaque: tachylite or oxides. Minerals such as quartz (essen-tially detrital), plagioclase, clinopyroxene, olivine, and amphibole were counted as well as lithics and siliceous biogenic material (radi-olarian and diatom).
Electron Microprobe Analysis of Major Elements All microprobe analyses were performed on the coarse fraction >62.5−125 µm or >125−250 µm. The major element composition of volcanic glass particles was determined at a specific depth interval in each ash layer and ash zone (up to 15 and 30 individual analyses of
C. LAC
ASSE ET AL.
54
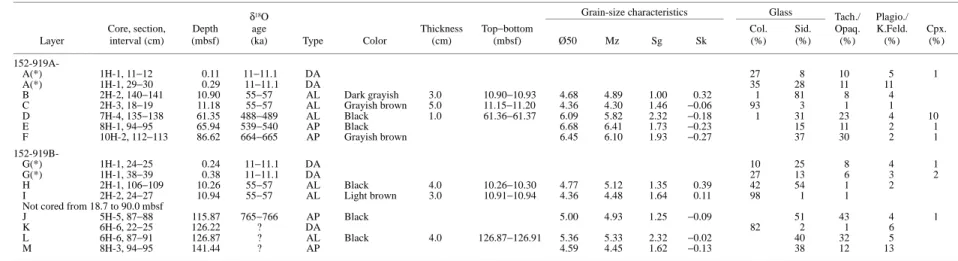
Table 1. Depth, δ18O dating, thickness, grain-size characteristics and composition of ash layers, pods, and ash zones of Site 919.
Notes: Ø50 = median size, Mz = graphic mean, Sg = sorting coefficient, and Sk = graphic skewness, after Folk (1974). Col. = colorless glass shards (platy and vesicular) and micropumice. Sid. = sideromelane (brownish glass), Tach. = tachylite, Opaq. = opaque, Plagio. = plagioclase, K.Feld. = K feldspar, and Cpx. = clinopyroxene. * = ash layer sampled at two depth intervals. DA = dispersed ash, AL = ash layer, and AP = ash pod.
δ18O age (ka)
Grain-size characteristics Glass Tach./ Opaq. (%) Plagio./ K.Feld. (%) Layer Core, section, interval (cm) Depth (mbsf) Type Color Thickness (cm) Top−bottom (mbsf) Ø50 Mz Sg Sk Col. (%) Sid. (%) Cpx. (%) 152-919A-A(*) 1H-1, 11−12 0.11 11−11.1 DA 27 8 10 5 1 A(*) 1H-1, 29−30 0.29 11−11.1 DA 35 28 11 11 B 2H-2, 140−141 10.90 55−57 AL Dark grayish 3.0 10.90−10.93 4.68 4.89 1.00 0.32 1 81 8 4 C 2H-3, 18−19 11.18 55−57 AL Grayish brown 5.0 11.15−11.20 4.36 4.30 1.46 −0.06 93 3 1 1 D 7H-4, 135−138 61.35 488−489 AL Black 1.0 61.36−61.37 6.09 5.82 2.32 −0.18 1 31 23 4 10 E 8H-1, 94−95 65.94 539−540 AP Black 6.68 6.41 1.73 −0.23 15 11 2 1 F 10H-2, 112−113 86.62 664−665 AP Grayish brown 6.45 6.10 1.93 −0.27 37 30 2 1 152-919B-G(*) 1H-1, 24−25 0.24 11−11.1 DA 10 25 8 4 1 G(*) 1H-1, 38−39 0.38 11−11.1 DA 27 13 6 3 2 H 2H-1, 106−109 10.26 55−57 AL Black 4.0 10.26−10.30 4.77 5.12 1.35 0.39 42 54 1 2 I 2H-2, 24−27 10.94 55−57 AL Light brown 3.0 10.91−10.94 4.36 4.48 1.64 0.11 98 1 1
Not cored from 18.7 to 90.0 mbsf
J 5H-5, 87−88 115.87 765−766 AP Black 5.00 4.93 1.25 −0.09 51 43 4 1
K 6H-6, 22−25 126.22 ? DA 82 2 1 6
L 6H-6, 87−91 126.87 ? AL Black 4.0 126.87−126.91 5.36 5.33 2.32 −0.02 40 32 5
glass shards for homogeneous and heterogeneous glass composition, respectively) using a Cameca electron microprobe. Our analytical technique follows the recommendations adopted for the standardiza-tion of the chemical analysis of tephra (INQUA Inter-Congress Com-mittee on Tephrochronology, 1990). A beam current of 10 nA with an accelerating voltage of 15 kV was used. Na loss was minimized for silicic glass analysis by using a beam defocused to 10 µm and by collecting counts at regular time intervals (2 s) and extrapolating the decay curve back to count initiation (Nielsen and Sigurdsson, 1981). Calibrations of silicic and basaltic glass compositions were made by running the natural glass standards KN-18 (comendite obsidian from Kenya; Nielsen and Sigurdsson, 1981) and VG-2 (basaltic glass from the Juan de Fuca Ridge), respectively.
Neutron Activation Analysis of Trace Elements Neutron activation was performed on bulk ashes for all the dis-crete ash layers with less than 5%−10% crystals. Each tephra sample (31−62 µm or 62−125 µm fraction) was irradiated with a flux of 1014
n/cm2/s for 1−3 hr in aluminum sleeves at Centre d’Etudes Nucléaires
of Saclay, France. Measurements of trace element concentrations were made using an intrinsic Ge detector of 100 cm3, using granite
and basalt standards (GSN and BEN) from the Centre de Recherches Pétrographiques et Géochimiques (CRPG) of Nancy, France. Quan-tification was done following automatic peak search, nuclear identi-fication, and calculation for element concentration. Analytical preci-sion is 10% for Sc, Co, Zr, Cs, La, Ce, Sm, Eu, Tb, Yb, Hf, Ta, and Th; 15% for Cr, Sb, Ba, Nd, and Lu; and 20% for U.
LITHOLOGY AND STRATIGRAPHY
Tephra were sampled in lithologic Unit I, from Cores 152-919A-1H through 10H and Cores 152-919B-152-919A-1H through 8H, which is com-posed of silty clay, clayey silt, and clay with silt (Shipboard Scientific Party, 1994a). Bedding and poor sorting in the sediment were ob-served. These sedimentological features are interpreted to be indica-tive of deposition from the melting of sediment-rich pack ice and ice-bergs, combined with subsequent turbidite flow along the seafloor. Biogenic components occur as diatoms, sponge spicules, foramini-fers, and calcareous nannofossils. Variation in calcareous microfossil abundance observed especially in the lower half of the sequence, be-tween 65 and 147 mbsf, may reflect change in carbonate production and influx of terrigenous material as a result of glacial-interglacial os-cillations. Among the terrigenous material, quartz is the most abun-dant and is commonly associated with amphibole, clinopyroxene, and opaque minerals. Garnet, epidote, and sphene were found occa-sionally. This terrigenous material is likely derived from a continen-tal source in East Greenland. Dropstones (0.2−5 cm in diameter) of basalt, gneiss, dolerite, and gabbro, among others, are scattered throughout the lithology. The dominant basaltic lithology (50% of the total) indicates an origin from the Tertiary basaltic formation of the Scoresby Sund region in East Greenland (Shipboard Scientific Party, 1994a). Dropstones were found, however, to be less abundant than in the other holes drilled during Leg 152, due to the greater dis-tance from East Greenland.
DATING OF THE TEPHRA LAYERS
Major discrepancies remain between the interpretation of the iso-tope stratigraphy (strontium and oxygen) and the biomagnetostratig-raphy for the lowermost 50 m of Hole 919B (Shipboard Scientific Party, 1994a; Israelson and Spezzaferri, this volume; Flower, this volume). The first method indicates a late Quaternary age for this sec-tion, whereas a higher age is suggested from the study of nannofossil and foraminifer assemblages, placing the Pliocene/Pleistocene boundary at about 128 mbsf (Shipboard Scientific Party, 1994a).
Only the Brunhes/Matuyama boundary (780 ka) has been unambigu-ously identified at about 120.5 mbsf (Cande and Kent, 1992; Ship-board Scientific Party, 1994a; Fig. 2). No precise age can therefore be suggested for the oldest tephra below this depth.
Oxygen (δ18O) and carbon (δ13C) isotope contents of foraminifers
were measured along Hole 919A (Flower, this volume). An age mod-el for this section has been suggested, based on the isotope stage boundaries of Imbrie et al. (1984). The 93.59-m sequence of Hole 919A spans approximately the last 690 ka down to oxygen isotope Stage 17 (Fig. 2). Mean δ18O ages of the tephra were determined by
linearly interpolating between isotopic stage boundaries. However, due to the limited resolution of the record (one sample per core sec-tion) refined isotopic ages were suggested for the ash layers and ash zones in Site 919 sediments that have been correlated to other known stratigraphic makers in North Atlantic sediments (e.g., ash Zone 1 and ash Zone 2) (Smythe et al., 1985; Bard et al., 1994; Lacasse et al., 1995, 1996).
DESCRIPTION AND GRAIN-SIZE CHARACTERISTICS OF TEPHRA LAYERS Three major types of tephra occurrence within the sediment were defined, based on their visual characteristics and modal composition. These include ash layers (type AL), dispersed ash (type DA), and ash pods (type AP). Each type was assigned a letter, A through M (Table 1). Six discrete ash layers (type AL) were studied within the depth in-terval 0−142 mbsf, corresponding to the Pliocene−Pleistocene period (Shipboard Scientific Party, 1994a). They show a more or less sharp contact with the underlying and overlying sediment, indicative of limited mixing by bioturbation, in a high sedimentation rate environ-ment. Thickness varies between 1 (Layer D) and 5 cm (Layer C). Ash color varies, including light brown, grayish brown, dark gray, and black. Crystals make up to 15% of the total components in the 3 φ fraction (e.g., Layer D; 4% feldspar, 10% clinopyroxene). Abundanc-es of the different components were found to depend strongly on the size fraction studied. For example the correlative Layers B (4 φ frac-tion) and H (3 φ fraction) in Holes 919A and 919B exhibit a differ-ence in colorless shards and brownish glass that appears to be mainly the result of grain size (Table 1). Sideromelane, tachylite, crystal and lithic grains are less abundant in the coarse fractions (φ≤ 3) because of their relatively high density and rounded shape in comparison with the less dense and platy colorless shards (i.e., essentially bubble walls). Following distal airborne transport, the former tend to settle through the air and water column more rapidly and closer to source than the latter. Layers C and I in Holes 919A and 919B comprise es-sentially colorless shards (>90% in the 3 φ size fraction) and can be considered as homogeneous in composition. Although its fine sand fraction shows a high concentration of colorless shards (around 80%), Layer K at 126 mbsf in Hole 919B was identified as an ash zone because of its high clay content and its dispersed nature in the sediment.
Grain-size characteristics of the discrete ash layers (type AL) and ash pods (AP) were determined, including median diameter (φ 50), graphic mean (Mz), graphic standard deviation (Sg, sorting coeffi-cient), and graphic skewness (Sk) (Folk, 1974; Table 1). All of the te-phra fall into the fine to coarse silt size classes, between 4 and 7 φ (Folk, 1974). By comparison, the ash layers of Site 907, located 350 km north of Iceland, are generally coarser, between 3 and 5 φ (Lacasse et al., in press). The finer grain size of tephra layers found at Site 919 can be explained by their greater distance from the same potential volcanic sources in Iceland, around 750 km to the northeast. Their relatively good sorting (1 ≤ Sg ≤ 2.3) indicates, however, that they have a primary fallout origin. Both grain size and sorting of te-phra from Site 919 in the Irminger Basin are compatible with long-range airborne transport of these ashes toward south Greenland from volcanic sources located on Iceland.
C. LACASSE ET AL.
56
A mixed ash zone, Layers A and G, was found in the uppermost 50 cm of the sediment in Holes 919A and 919B, respectively. It is characterized by a relatively high concentration of dispersed color-less and brownish glass shards over a depth interval of several tens of centimeters (Table 1). Its heterogeneous composition, with high lith-ic and crystal contents, and coarse grain size, suggests an lith-ice-rafting origin of the tephra deposit. Its young age indicates that it is likely to belong to ash Zone 1 (Fig. 2).
GEOCHEMISTRY, CORRELATION AND POTENTIAL SOURCES OF TEPHRA LAYERS
Major Elements
Microprobe analytical totals of silicic glasses range between about 95.5 and 99.5% (Table 2). Difference from 100% is largely at-tributed to the water content of the glass. Totals for individual analy-ses of mafic glass shards range between 98% and 101.5% (Table 3). All of the layers can be classified into two compositional groups: het-erogeneous layers with mafic and silicic glass composition (Layers A, B, and C in Hole 919A and Layers G, H, I, and K in Hole 919B, with SiO2 ranging between 45 and 76 wt%) and homogeneous layers
with basaltic glass composition (Layers D, E, and F in Hole 919A and Layers J, L, and M in Hole 919B, with SiO2 ranging between 46 and
52 wt%). Very few glass shards were found with a basaltic andesite composition, with SiO2 ranging between 52 and 57 wt%.
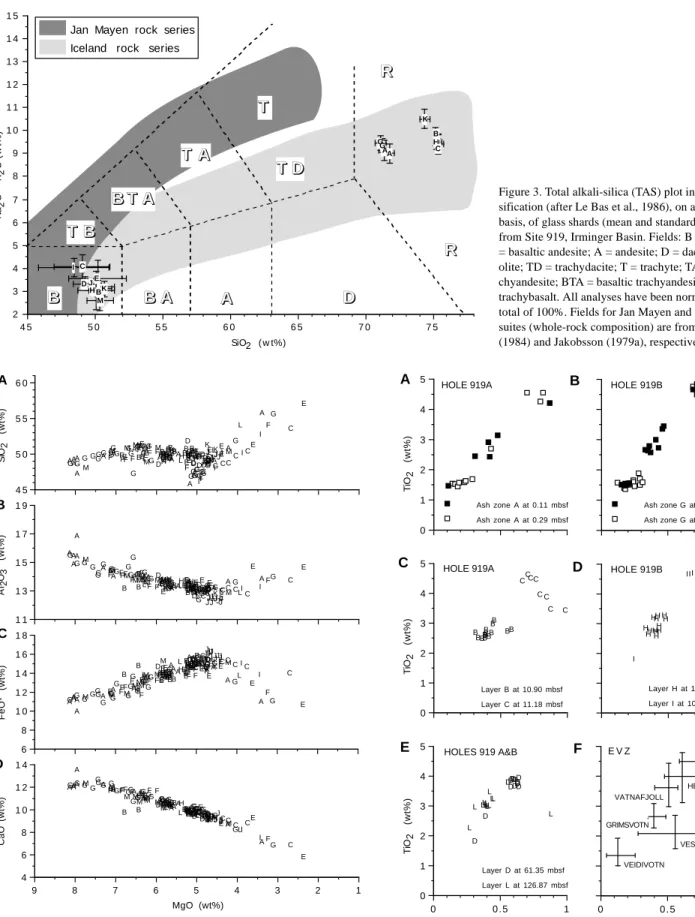
A total alkali-silica (TAS) diagram was used to classify glass shards compositions and to discriminate between the only two poten-tial Pliocene−Pleistocene volcanic sources in the North Atlantic re-gion (i.e., Iceland and Jan Mayen). All of the tephra plot within two major TAS fields defining basalt and rhyolite compositions, showing
an Icelandic affinity (Fig. 3). None of the tephra can be considered to have an affinity with the trachy basaltic rock series of Jan Mayen (Imsland, 1984). Furthermore, as it was pointed out for the Pliocene and Pleistocene tephra of Site 907, microprobe analyses of all the ba-saltic glass shards from Holes 919A and 919B indicate a potassium content higher than 0.2 wt%, which represents the upper limit for ba-saltic glass originated from the Mid-Atlantic Ridge (Sigurdsson, 1981; Lackschewitz and Wallrabe-Adams, 1991; Lackschewitz et al., 1994). The Reykjanes Ridge, approximately 500 km east of Site 919, is not considered a likely source of volcaniclastic sedimentation in this region during the Quaternary. The different volcanic systems in Iceland should therefore be considered as the exclusive sources of the Pliocene−Pleistocene tephra found at Site 919.
Basic and Intermediate Glass
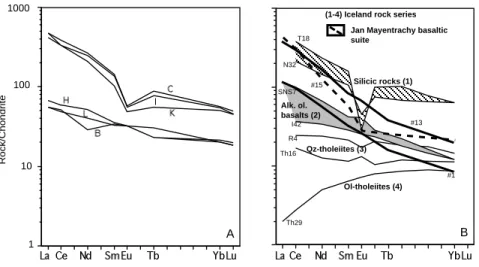
Individual glass analyses of the basic and intermediate glass shards are plotted as a function of SiO2, Al2O3, FeO*, and CaO vs.
MgO in Figure 4. MgO concentrations vary between 8 and 3.5 wt%, showing a negative correlation with increasing CaO content (Fig. 4D). Trends for silica, alumina and iron contents show a kink be-tween 5 and 5.5 wt% MgO, corresponding to the compositional boundary between basaltic and intermediate glass. These breaks in trends can be related to changes in associated phase assemblages, with fractionation or accumulation of olivine and/or spinel, and crys-tallization of plagioclase and clinopyroxene. Similar variation trends were found for different tholeiitic volcanic systems in Iceland, show-ing a break at a Mg value (i.e., atomic ratio 100 Mg/Mg+Fe2+) of
about 70 (Meyer et al., 1985).
Among the major elements, TiO2 and K2O show the largest
com-positional variation in Iceland basalts (Jakobsson, 1979b; Larsen, SiO2 (wt%) SiO2 (wt%) Depth (mbsf) BRUHNES MATUYAMA 10 40 30 80 20 70 60 120 50 110 100 90 140 130 45 50 55 60 65 70 75 45 50 55 60 65 70 75 1 5 7 9 11 13 15 17 12 71 128 186 245 303 339 362 423 478 524 565 620 659 689 780 A A G G B C C H H I I D F E J K K L M B I ?? ?? 0 ∂ 18 O age (ka) Ash Zone 1 Ash Zone 2 HOLE 919B HOLE 919A
not cored from 18.7 to 90 mbsf
Figure 2. Stratigraphic position and silica content of Pliocene−Pleistocene ash layers in Holes 919A and 919B. Paleomagnetic and δ18O ages are from
Ship-board Scientific Party (1994a) and Flower (this vol-ume), respectively. Also shown are ash Zone 1 (11− 11.1 ka after Bard et al., 1994) and ash Zone 2 (55− 57.5 ka after Smythe et al., 1985; Lacasse et al., 1996).
1981). On such plots, the difference between volcanic systems is pro-nounced (Fig. 5). Basaltic glass shards from the mixed ash zone lo-cated in the uppermost 50 cm of Core 919A-1H and Core 152-919B-1H (i.e., Layers A and G) show three separate fields character-istic of Grímsvötn, Veidivötn, and Katla volcanic systems on the Eastern Volcanic Zone in Iceland (Figs. 5A, B, F). These three vol-canic systems have been previously proposed as the likely sources for the basaltic components of the ice-rafted ash Zone 1 in the North At-lantic and its terrestrial counterpart, the Vedde Ash in western Nor-way (Mangerud et al., 1984; Kvamme et al., 1989). Based on its stratigraphic position, we also suggest that this ash zone represents ash Zone 1, a Younger Dryas chronostratigraphic marker found widely in marine sediments in the North Atlantic and 14C dated at 11−
11.1 ka (Bard et al., 1994).
TiO2 vs. K2O plots of basaltic glass shards from the two mixed
layers found between 10.2 and 11.2 mbsf in both Holes 919A and 919B (i.e., Layers B, C, H, and I) also show two separate fields with compositional ranges similar to those of Vatnafjöll and Hekla volca-nic systems (Figs. 5C, D, F). The lowermost Layers C and I are char-acterized by a broader compositional range, with TiO2 content
in-creasing with dein-creasing K2O content, whereas Layers B and H are
more chemically homogeneous. Based on their common basaltic composition and stratigraphic position, we correlate Layers B and C in Hole 919A with Layers H and I in Hole 919B, respectively.
The only discrete basaltic layers found at Site 919 (i.e., Layer D in Hole 919A and Layer L in Hole 919B) are defined by distinct chemical fields (Fig. 5E). The Hekla and Vatnafjöll volcanic systems are the likely sources for these two tephra layers.
Silicic Glass
TAS plots of all the rhyolitic tephra recovered at Site 919 reveal a homogeneous glass composition with an Icelandic affinity (Fig. 3). Chemically homogeneous silicic tephra layers were shown to be ex-cellent chronostratigraphic markers in both sediment cores and ice cores (Hammer, 1977; Fiacco, 1991; Palais et al., 1991, 1992; Ram and Gayley, 1991; Fiacco et al., 1993; Lacasse et al., 1995, 1996; Grönvold et al., 1995). They can be easily correlated to volcanic sources on land. Average and standard deviation of glass analyses for each rhyolitic tephra from Site 919 were calculated on a water-free
basis and plot in four different chemical diagrams (i.e., Al2O3, FeO*,
CaO, and K2O vs. SiO2 content; Fig. 6 A−D). These plots were
com-pared with fields characteristic of three chronostratigraphic markers present in North Atlantic sediment, south of Iceland to 45°N latitude. (i.e., the ash Zones 1, 2, and 3; Sigurdsson, 1982; Lacasse et al., 1995, 1996). These marine tephra are generally found as dispersed glass shards over depth intervals of several tens of centimeters in sediment and are interpreted to be transported and deposited by ice-rafting.
The marine ash Zone 1 was 14C dated at about 11−11.1 ka and its
terrestrial counterpart, the Vedde Ash, at about 10.3−10.6 ka (Man-gerud et al., 1984; Bard et al., 1994). Recent study by Lacasse et al. (1996) on the ice-rafted ash Zones 2 and 3 indicates a δ18O age close
to 55 and 305 ka, respectively, in good agreement with previous work (Ruddiman and Glover, 1972; Smythe et al., 1985). The rhyolitic glass compositions of the tephra are chemically homogeneous and show distinct fields (Fig. 6E−F). Based on a water-free rhyolitic glass composition, ash Zone 1 and ash Zone 2 have been correlated to two major ignimbrite formations in southern Iceland—the Sólheimar Ignimbrite (Katla volcano) and the Thórsmörk Ignimbrite (Tindfjal-lajökull volcano) (Sigurdsson, 1982; Lacasse et al., 1995, 1996). Cor-relation of the tholeiitic rhyolitic ash Zone 3 with a specific Icelandic source needs further investigation.
The rhyolitic tephra recovered at Site 919 exhibit the same chem-ical homogeneity, with three distinct fields (Fig. 6A−D). Rhyolitic glass composition of Layers A and G (mixed ash zones) in Holes 919A and 919B have major element concentrations similar to that of ash Zone 1, confirming our correlation from the basaltic glass chem-istry. Layers A and G have the most aluminous (13.59 < Al2O3 <
13.70 wt%) and calcic (1.25 < CaO < 1.35 wt%) and, subsequently, the least siliceous (71.08 < SiO2 < 71.76 wt%) rhyolitic glass
compo-sition. These major element concentrations, in addition to a relatively low potassium (3.37 < K2O < 3.43 wt%) and high iron (3.71 < FeO*
< 3.84 wt%) contents, place the silicic glass fraction of Layers A and G within the compositional field of transitional alkali-rhyolite. In contrast, Layers B and C in Hole 919A and Layers H and I in Hole 919B contain the most siliceous glass with SiO2 concentration
rang-ing between 75.16 and 75.39 wt% (water-free basis). Variations in their alumina (11.91 < Al2O3 < 12.12 wt%), iron (2.55 < FeO* < 2.58
wt%), calcium (0.27 < CaO < 0.40 wt%), and potassium (4.01 < K2O
< 4.07 wt%) concentrations indicate an alkali-rhyolite affinity, which Table 2. Electron microprobe analyses and normative composition of silicic glassy tephra from Site 919.
Notes: * = ash layer sampled at two depth intervals. DA = dispersed ash, AL = ash layer. N = number of analyses. † = number in parentheses is one standard deviation of the mean. FeO*: total iron as FeO. C.I.P.W. norms calculated on water-free basis with 15% total iron as Fe2O3 and 85% as FeO.
Hole: Core, section: Interval (cm): Layer: Type: N: 919A 1H-1 11−12 A(*) DA 9 919A 1H-1 29−30 A(*) DA 10 919A 2H-2 140−141 B AL 15 919A 2H-3 18−19 C AL 15 919B 1H-1 24−25 G(*) DA 11 919B 1H-1 38−39 G(*) DA 15 919B 2H-1 106−109 H AL 15 919B 2H-2 24−27 I AL 14 919B 6H-6 22−25 K DA 20 SiO2 71.00 (0.49)† 70.88 (0.66) 72.29 (0.55) 73.05 (0.60) 70.70 (0.47) 70.25 (0.50) 72.16 (0.53) 72.36 (0.44) 71.03 (0.52) TiO2 0.29 (0.04) 0.28 (0.05) 0.17 (0.05) 0.18 (0.05) 0.28 (0.04) 0.31 (0.05) 0.15 (0.03) 0.15 (0.04) 0.25 (0.05) Al2O3 13.63 (0.22) 13.49 (0.13) 11.46 (0.14) 11.74 (0.25) 13.49 (0.12) 13.48 (0.22) 11.53 (0.13) 11.49 (0.18) 9.04 (0.17) FeO* 3.82 (0.12) 3.67 (0.19) 2.46 (0.12) 2.47 (0.15) 3.80 (0.19) 3.78 (0.14) 2.48 (0.10) 2.47 (0.13) 4.73 (0.17) MnO 0.12 (0.04) 0.12 (0.04) 0.06 (0.05) 0.07 (0.05) 0.16 (0.06) 0.13 (0.07) 0.07 (0.04) 0.07 (0.05) 0.23 (0.05) MgO 0.23 (0.01) 0.22 (0.02) 0.00 (0.01) 0.00 (0.01) 0.21 (0.02) 0.21 (0.03) 0.01 (0.01) 0.00 (0.00) 0.01 (0.01) CaO 1.29 (0.09) 1.23 (0.07) 0.38 (0.04) 0.26 (0.05) 1.34 (0.04) 1.34 (0.08) 0.38 (0.05) 0.37 (0.03) 0.21 (0.03) Na2O 5.74 (0.29) 5.53 (0.30) 5.45 (0.26) 5.24 (0.32) 5.91 (0.21) 5.95 (0.28) 5.27 (0.20) 5.22 (0.19) 6.07 (0.32) K2O 3.35 (0.15) 3.37 (0.12) 3.91 (0.11) 3.88 (0.08) 3.36 (0.10) 3.39 (0.09) 3.86 (0.14) 3.87 (0.13) 3.97 (0.13) Total 99.47 98.78 96.18 96.89 99.25 98.84 95.90 96.01 95.53 Q 20.47 21.71 28.80 28.88 19.39 18.80 28.69 29.07 31.92 Or 19.76 20.02 23.90 23.54 19.86 20.12 23.66 23.70 24.33 Ab 48.49 47.04 38.48 39.85 50.04 50.58 39.25 38.94 25.32 An 1.54 2.05 0.37 0.07 Ne Di 4.26 3.58 1.74 1.18 5.52 5.80 1.74 1.70 0.96 Hy 3.27 3.45 2.97 3.26 2.63 2.37 3.09 3.07 7.38 Ol Mt 1.61 1.56 1.60 1.60 Il 0.55 0.54 0.33 0.35 0.53 0.59 0.30 0.30 0.49 Total 99.94 99.94 99.94 99.94 99.94 99.94 99.94 99.94 99.96
C. LACASSE ET AL.
58
Table 3. Electron microprobe analyses of basic and intermediate glass shards from Site 919.
Hole: Core, section: Interval: (cm) Layer: Type: 919A 1H-1 11−12 A(*) DA 919A 1H-1 11−12 A(*) DA 919A 1H-1 11−12 A(*) DA 919A 1H-1 11−12 A(*) DA 919A 1H-1 11−12 A(*) DA 919A 1H-1 11−12 A(*) DA 919A 1H-1 11−12 A(*) DA 919A 1H-1 11−12 A(*) DA 919A 1H-1 29−30 A(*) DA 919A 1H-1 29−30 A(*) DA 919A 1H-1 29−30 A(*) DA 919A 1H-1 29−30 A(*) DA 919A 1H-1 29−30 A(*) DA 919A 1H-1 29−30 A(*) DA 919A 1H-1 29−30 A(*) DA 919A 1H-1 29−30 A(*) DA SiO2 48.17 48.60 45.10 46.83 49.64 49.11 50.01 50.94 49.46 49.11 49.85 50.17 51.01 56.00 49.58 46.98 TiO2 4.15 2.38 4.56 1.45 3.14 2.90 2.42 3.95 1.53 1.45 1.59 2.70 1.70 2.97 4.30 4.54 Al2O3 13.03 13.19 13.40 16.71 13.61 13.19 13.18 13.67 14.94 15.68 14.64 13.39 14.12 13.93 13.35 13.20 FeO* 14.43 13.85 15.44 9.92 14.41 14.82 14.32 13.31 11.53 11.03 11.63 14.23 12.49 11.07 14.77 15.60 MnO 0.19 0.21 0.21 0.21 0.26 0.26 0.21 0.14 0.23 0.11 0.19 0.18 0.17 0.21 0.26 0.28 MgO 4.73 5.80 5.08 7.87 5.20 5.60 5.51 4.22 8.05 8.14 7.31 5.46 6.58 3.40 4.61 5.06 CaO 9.37 10.66 9.89 13.45 9.90 10.14 10.22 8.73 12.08 12.01 12.28 10.59 11.70 7.20 9.42 9.92 Na2O 3.24 2.59 2.34 2.09 2.75 2.75 2.53 3.35 1.99 1.98 2.21 2.72 2.16 3.36 3.17 2.86 K2O 0.86 0.41 1.68 0.11 0.48 0.41 0.31 1.13 0.16 0.18 0.24 0.43 0.29 1.64 0.81 0.70 P2O5 0.52 0.38 0.61 0.34 0.47 0.48 0.36 0.63 0.31 0.36 0.22 0.38 0.36 0.54 0.60 0.61 Total 98.69 98.07 98.31 98.98 99.86 99.66 99.07 100.07 100.28 100.05 100.16 100.25 100.58 100.32 100.87 99.75 Hole: Core, section: Interval: (cm) Layer: Type: 919A 1H-1 29−30 A(*) DA 919A 1H-1 29−30 A(*) DA 919A 1H-1 29−30 A(*) DA 919A 1H-1 29−30 A(*) DA 919A 2H-2 140−141 B AL 919A 2H-2 140−141 B AL 919A 2H-2 140−141 B AL 919A 2H-2 140−141 B AL 919A 2H-2 140−141 B AL 919A 2H-2 140−141 B AL 919A 2H-2 140−141 B AL 919A 2H-2 140−141 B AL 919A 2H-2 140−141 B AL 919A 2H-2 140−141 B AL 919A 2H-2 140−141 B AL 919A 2H-2 140−141 B AL SiO2 49.85 48.50 49.01 50.49 49.79 50.80 50.20 50.19 50.83 49.95 51.05 50.65 50.94 50.91 50.56 50.06 TiO2 1.55 4.53 1.64 1.57 2.49 2.84 2.78 2.73 3.13 2.62 2.68 2.71 3.00 2.80 2.52 2.59 Al2O3 15.58 13.29 15.58 14.11 13.50 13.08 13.96 13.44 13.47 13.48 13.35 13.52 13.17 13.40 13.38 13.29 FeO* 11.30 14.34 11.44 12.35 13.83 15.38 14.34 14.99 14.71 13.67 13.36 14.53 15.04 14.14 13.60 13.98 MnO 0.23 0.16 0.10 0.10 0.14 0.22 0.18 0.21 0.15 0.29 0.26 0.26 0.27 0.20 0.20 0.22 MgO 8.01 4.70 8.07 7.08 5.58 5.31 5.78 6.51 5.16 5.77 5.68 5.36 5.15 5.28 5.72 6.83 CaO 12.38 9.34 12.23 11.89 10.59 10.08 10.63 10.13 10.22 10.66 10.44 10.14 9.63 10.11 10.81 9.88 Na2O 1.46 3.13 1.95 2.32 2.55 2.71 2.65 2.28 2.06 2.78 2.63 2.98 2.11 2.48 2.52 3.07 K2O 0.14 0.82 0.24 0.19 0.38 0.59 0.56 0.32 0.45 0.38 0.39 0.44 0.45 0.39 0.33 0.41 P2O5 0.29 0.73 0.35 0.33 0.40 0.45 0.40 0.38 0.44 0.43 0.38 0.35 0.49 0.48 0.33 0.40 Total 100.79 99.54 100.61 100.43 99.25 101.46 101.48 101.18 100.62 100.03 100.22 100.94 100.25 100.19 99.97 100.73 Hole: Core, section: Interval (cm): Layer: Type: 919A 2H-2 140−141 B AL 919A 2H-2 140−141 B AL 919A 2H-2 140−141 B AL 919A 2H-3 18−19 C AL 919A 2H-3 18−19 C AL 919A 2H-3 18−19 C AL 919A 2H-3 18−19 C AL 919A 2H-3 18−19 C AL 919A 2H-3 18−19 C AL 919A 2H-3 18−19 C AL 919A 2H-3 18−19 C AL 919A 2H-3 18−19 C AL 919A 7H-4 135−138 D AL 919A 7H-4 135−138 D AL 919A 7H-4 135−138 D AL 919A 7H-4 135−138 D AL SiO2 50.48 50.43 50.87 54.24 50.33 49.22 49.52 47.65 51.07 47.10 47.71 46.99 48.88 48.15 47.87 47.66 TiO2 2.62 2.48 2.63 2.52 3.52 4.01 3.95 4.41 3.49 4.61 4.49 4.52 3.66 3.86 3.71 3.79 Al2O3 13.55 13.46 13.53 13.92 13.26 13.20 13.42 13.26 12.95 12.90 12.68 13.14 12.95 12.95 13.28 12.99 FeO* 13.36 13.55 13.50 14.19 15.10 15.39 15.61 14.56 14.91 14.91 15.88 15.51 15.54 15.31 14.79 15.32 MnO 0.24 0.25 0.27 0.16 0.38 0.25 0.33 0.31 0.48 0.32 0.22 0.23 0.25 0.12 0.29 0.39 MgO 5.88 5.67 5.61 2.73 4.09 4.41 4.29 5.00 3.81 5.02 4.86 4.95 5.10 5.02 4.88 4.74 CaO 11.01 10.51 10.74 6.99 8.76 9.34 9.21 10.05 8.97 10.01 9.78 9.81 9.68 9.53 9.74 9.36 Na2O 2.35 2.28 2.97 3.79 3.60 3.44 3.27 2.74 3.29 2.89 2.89 3.22 3.10 2.57 3.01 2.86 K2O 0.39 0.36 0.39 1.28 0.88 0.80 0.85 0.65 0.99 0.69 0.76 0.72 0.58 0.58 0.62 0.57 P2O5 0.40 0.42 0.37 1.25 1.15 0.92 1.06 0.96 1.26 0.90 0.95 0.96 0.60 0.55 0.58 0.52 Total 100.28 99.41 100.88 101.07 101.07 100.98 101.51 99.59 101.22 99.35 100.22 100.05 100.34 98.64 98.77 98.20 Hole: Core, section: Interval (cm): Layer: Type: 919A 7H-4 135−138 D AL 919A 7H-4 135−138 D AL 919A 7H-4 135−138 D AL 919A 7H-4 135−138 D AL 919A 7H-4 135−138 D AL 919A 7H-4 135−138 D AL 919A 7H-4 135−138 D AL 919A 7H-4 135−138 D AL 919A 7H-4 135−138 D AL 919A 7H-4 135−138 D AL 919A 8H-1 94−95 E AP 919A 8H-1 94−95 E AP 919A 8H-1 94−95 E AP 919A 8H-1 94−95 E AP 919A 8H-1 94−95 E AP 919A 8H-1 94−95 E AP SiO2 47.82 48.88 49.35 52.23 49.34 49.25 49.18 48.84 49.83 49.65 50.00 50.42 50.93 50.20 46.48 48.88 TiO2 3.76 2.69 3.75 1.84 3.90 3.97 3.67 3.66 3.80 3.91 2.53 2.62 3.43 4.29 4.32 4.03 Al2O3 12.89 14.19 13.05 13.86 13.17 13.11 13.23 13.07 13.04 12.97 13.91 13.56 12.94 12.62 12.91 12.95 FeO* 15.81 14.81 15.31 14.16 15.02 15.54 15.52 15.55 14.99 15.41 13.38 13.29 14.70 15.27 14.92 14.62 MnO 0.19 0.20 0.25 0.22 0.20 0.32 0.28 0.20 0.20 0.14 0.22 0.21 0.25 0.18 0.19 0.33 MgO 4.63 5.98 4.66 5.26 4.72 4.73 4.73 4.79 4.84 4.80 6.38 5.89 4.38 4.41 4.87 4.75 CaO 9.48 10.52 9.12 10.02 9.56 9.60 9.46 9.63 9.17 9.50 11.31 10.96 8.77 9.12 10.19 9.68 Na2O 2.61 2.51 2.54 2.46 2.89 2.59 2.97 2.79 2.65 2.78 2.22 2.63 2.85 2.98 3.15 2.86 K2O 0.62 0.40 0.62 0.31 0.60 0.64 0.65 0.61 0.56 0.61 0.23 0.31 0.72 0.64 0.78 0.83 P2O5 0.51 0.39 0.67 0.28 0.57 0.57 0.61 0.52 0.54 0.53 0.37 0.38 0.57 0.62 1.41 0.55 Total 98.32 100.64 99.32 100.64 99.97 100.32 100.30 99.66 99.62 100.30 100.55 100.27 99.54 100.33 99.22 99.48
matches well with that of ash Zone 2 (Fig. 6). We have correlated above the two discrete mixed ash Layers H and I in Hole 919B with Layers B and C in Hole 919A, respectively, based on their strati-graphic position and composition of their basaltic glass fraction. However, we can not discriminate these two chronostratigraphic markers at Site 919 from the chemistry of their rhyolitic glass fraction alone. Both rhyolitic glass compositions show a strong similarity with ash Zone 2 and likely indicate a common source in southern Ice-land (i.e., the Tindfjallajökull volcano; Sigurdsson, 1982; Lacasse et
al., 1996). Analyses of rhyolitic glass from the oldest silicic tephra re-covered at Site 919 (i.e., Layer K [mixed ash zone]) in Hole 919B, indicate compositional ranges incompatible with any of the three pre-viously described ash zones. Silicic glass composition of Layer K is characterized by the highest potassium (K2O = 4.16 ± 0.13 wt%) and
iron (FeO* = 4.95 ± 0.16 wt%) contents and the lowest calcium (CaO = 0.22 ± 0.04 wt%) and alumina (Al2O3 = 9.46 ± 0.19 wt%) contents
(Fig. 6A−D). Low Al2O3, in addition to high total alkali (Na2O + K2O
rhyolitic fraction of Layer K into the peralkaline or comenditic group (Fig. 3). Because this important chronostratigraphic marker, located just below the Brunhes/Matuyama boundary in Hole 919B, could not be dated, further study will be necessary to correlate it with a poten-tial source in Iceland as well as with other marine records (Fig. 2).
Normative salic components of the rhyolitic tephra of Site 919 make up between 82 (Layer K) and 92 wt% (Layer C) of the glasses (Table 2). As found for Site 907 (fig. 11 in Lacasse et al., in press), all the rhyolitic glasses fall within the plagioclase volume of the gran-ite system Ab-Or-SiO2 for water pressure less than 1 kb, after
Thompson and MacKenzie (1967) and Sigurdsson (1971) (Fig. 7). However, none of the transitional (Layers A and G) and alkalic rhy-olitic (Layers B, C, H, and I) tephra of Site 919 plots in the orthoclase side of the diagram due to their relatively low potassium content. With increasing degree of alkalinity, they tend to plot near the limit between the low-K and high-K groups defined by Sigurdsson and Loebner (1981) but still inside the albite domain. Rhyolitic glass of Layer K forms a distinct compositional group that plots on the ther-mal minimum for water pressure of 1 kb and with about the same amount of normative quartz, albite, and orthoclase. This
characteris-Hole: Core, section: Interval (cm): Layer: Type: 919A 8H-1 94−95 E AP 919A 8H-1 94−95 E AP 919A 8H-1 94−95 E AP 919A 8H-1 94−95 E AP 919A 8H-1 94−95 E AP 919A 8H-1 94−95 E AP 919A 8H-1 94−95 E AP 919A 8H-1 94−95 E AP 919A 8H-1 94−95 E AP 919A 8H-1 94−95 E AP 919A 10H-2 112−113 F AP 919A 10H-2 112−113 F AP 919A 10H-2 112−113 F AP 919A 10H-2 112−113 F AP 919A 10H-2 112−113 F AP 919A 10H-2 112−113 F AP SiO2 48.72 49.67 49.92 49.69 48.86 56.64 51.05 50.04 48.60 48.77 50.33 50.46 50.09 51.46 49.34 54.37 TiO2 3.48 2.95 2.27 3.43 3.20 2.17 3.32 2.67 3.60 2.77 2.08 2.42 2.24 1.66 3.77 2.91 Al2O3 13.51 13.18 13.71 13.31 13.52 14.56 14.63 12.97 13.69 13.63 14.42 13.32 13.31 14.28 13.45 13.81 FeO* 13.80 14.59 13.04 13.47 14.21 10.62 12.89 14.55 13.66 13.75 12.17 13.31 13.16 11.73 14.42 12.05 MnO 0.20 0.19 0.27 0.28 0.18 0.19 0.22 0.25 0.24 0.30 0.18 0.23 0.30 0.21 0.30 0.18 MgO 5.15 5.77 6.27 4.60 4.78 2.35 3.60 5.83 5.23 5.75 6.94 6.00 6.17 6.37 5.03 3.26 CaO 9.78 10.27 11.30 9.23 9.24 5.80 9.25 10.45 9.88 10.50 11.81 11.73 11.72 11.58 9.59 7.48 Na2O 2.97 2.72 2.65 2.79 2.98 4.23 3.22 2.55 3.09 2.71 2.33 2.13 2.18 2.00 2.78 3.88 K2O 0.87 0.28 0.30 0.65 0.60 1.69 0.62 0.28 0.83 0.45 0.26 0.27 0.24 0.33 0.55 1.59 P2O5 0.70 0.37 0.31 0.67 0.53 0.91 0.58 0.41 0.58 0.43 0.40 0.32 0.39 0.38 0.58 0.94 Total 99.18 99.99 100.04 98.12 98.10 99.16 99.38 100.00 99.40 99.06 100.92 100.19 99.80 100.00 99.81 100.47 Hole: Core, section: Interval (cm): Layer: Type: 919A 10H-2 112−113 F AP 919A 10H-2 112−113 F AP 919A 10H-2 112−113 F AP 919A 10H-2 112−113 F AP 919A 10H-2 112−113 F AP 919A 10H-2 112−113 F AP 919A 10H-2 112−113 F AP 919A 10H-2 112−113 F AP 919A 10H-2 112−113 F AP 919B 1H-1 24−25 G(*) DA 919B 1H-1 24−25 G(*) DA 919B 1H-1 24−25 G(*) DA 919B 1H-1 24−25 G(*) DA 919B 1H-1 24−25 G(*) DA 919B 1H-1 24−25 G(*) DA 919B 1H-1 24−25 G(*) DA SiO2 49.80 50.15 49.60 47.80 49.26 50.39 48.88 48.81 48.80 48.22 46.87 48.15 46.30 49.52 46.66 49.04 TiO2 2.19 3.20 3.38 3.91 1.80 2.18 2.17 3.80 2.04 1.55 4.9 4.51 4.59 3.44 4.43 2.64 Al2O3 13.92 13.53 12.88 13.11 14.06 14.15 14.09 13.32 13.95 14.8 12.9 13.21 12.77 12.36 12.90 13.50 FeO* 13.34 13.70 15.87 15.21 12.02 12.15 12.45 14.71 12.38 11.58 14.89 15.00 15.17 15.70 14.57 13.68 MnO 0.20 0.20 0.16 0.22 0.20 0.24 0.11 0.20 0.25 0.21 0.24 0.22 0.17 0.36 0.15 0.27 MgO 6.65 5.00 4.99 5.22 7.10 6.41 6.72 4.64 6.78 7.89 4.8 4.54 4.99 4.96 5.00 5.79 CaO 11.71 9.77 9.73 10.02 11.68 11.24 11.73 9.41 11.65 12.26 9.95 9.46 10.16 9.73 10.10 10.72 Na2O 2.55 2.86 2.52 2.67 2.65 2.16 2.59 2.99 2.52 2.02 3.07 3.01 2.99 2.80 3.00 2.66 K2O 0.18 0.57 0.37 0.52 0.24 0.29 0.21 0.94 0.22 0.21 0.76 0.77 0.68 0.46 0.75 0.33 P2O5 0.34 0.49 0.40 0.65 0.33 0.33 0.27 0.65 0.36 0.29 0.62 0.65 0.63 0.42 0.52 0.41 Total 100.88 99.47 99.90 99.33 99.34 99.54 99.22 99.47 98.95 99.03 99.00 99.52 98.45 99.75 98.08 99.04 Hole: Core, section: Interval (cm): Layer: Type: 919B 1H-1 24−25 G(*) DA 919B 1H-1 24−25 G(*) DA 919B 1H-1 24−25 G(*) DA 919B 1H-1 24−25 G(*) DA 919B 1H-1 24−25 G(*) DA 919B 1H-1 24−25 G(*) DA 919B 1H-1 24−25 G(*) DA 919B 1H-1 24−25 G(*) DA 919B 1H-1 38−39 G(*) DA 919B 1H-1 38−39 G(*) DA 919B 1H-1 38−39 G(*) DA 919B 1H-1 38−39 G(*) DA 919B 1H-1 38−39 G(*) DA 919B 1H-1 38−39 G(*) DA 919B 1H-1 38−39 G(*) DA 919B 1H-1 38−39 G(*) DA SiO2 48.68 49.38 47.89 47.14 47.32 49.41 46.74 49.35 49.72 50.83 50.92 50.41 50.26 50.71 51.10 46.31 TiO2 1.55 2.65 4.34 4.80 4.43 1.54 2.70 2.78 1.57 1.70 1.46 1.67 1.52 1.50 1.90 4.70 Al2O3 15.51 13.94 13.24 12.71 12.96 14.57 15.19 13.15 14.20 13.80 14.51 14.21 14.41 14.30 14.16 13.05 FeO* 11.21 13.70 14.75 15.07 14.90 11.72 13.53 14.12 11.70 12.45 11.40 12.69 11.88 13.16 12.14 15.24 MnO 0.12 0.18 0.12 0.27 0.21 0.21 0.16 0.22 0.21 0.18 0.17 0.16 0.18 0.22 0.23 0.27 MgO 8.14 6.17 4.69 4.84 4.95 7.52 6.50 5.68 7.40 6.16 7.08 6.67 7.12 6.30 6.48 5.09 CaO 12.21 11.25 9.56 9.89 9.98 11.85 10.64 10.89 12.37 11.27 11.84 11.86 11.87 11.07 11.11 9.76 Na2O 1.99 2.54 2.76 2.96 2.73 2.02 2.52 2.71 1.90 2.36 2.13 2.31 2.13 2.20 2.42 2.90 K2O 0.20 0.35 0.79 0.72 0.72 0.18 0.43 0.36 0.12 0.29 0.26 0.24 0.20 0.22 0.28 0.68 P2O5 0.35 0.39 0.65 0.70 0.62 0.23 0.39 0.34 0.28 0.30 0.31 0.30 0.27 0.23 0.31 0.68 Total 99.96 100.55 98.79 99.10 98.82 99.25 98.80 99.60 99.47 99.34 100.08 100.52 99.84 99.91 100.13 98.68 Hole: Core, section: Interval (cm): Layer: Type: 919B 1H-1 38−39 G(*) DA 919B 1H-1 38−39 G(*) DA 919B 1H-1 38−39 G(*) DA 919B 1H-1 38−39 G(*) DA 919B 1H-1 38−39 G(*) DA 919B 1H-1 38−39 G(*) DA 919B 1H-1 38−39 G(*) DA 919B 2H-1 106−109 H AL 919B 2H-1 106−109 H AL 919B 2H-1 106−109 H AL 919B 2H-1 106−109 H AL 919B 2H-1 106−109 H AL 919B 2H-1 106−109 H AL 919B 2H-1 106−109 H AL 919B 2H-1 106−109 H AL 919B 2H-1 106−109 H AL SiO2 49.86 50.33 49.62 49.58 51.61 51.02 49.61 49.81 49.12 49.06 49.06 48.08 49.60 49.76 49.77 49.22 TiO2 1.58 1.57 1.51 1.39 3.65 1.51 1.35 2.78 2.56 3.25 2.73 2.80 2.77 2.92 2.64 3.10 Al2O3 13.99 13.96 14.71 14.24 13.56 14.74 14.43 13.63 13.55 13.14 13.63 13.47 13.67 12.98 13.78 13.05 FeO* 13.04 12.23 10.80 12.78 13.06 11.69 11.73 13.79 13.89 14.79 13.52 13.84 14.39 15.21 13.77 14.59 MnO 0.12 0.16 0.21 0.08 0.21 0.11 0.20 0.32 0.15 0.23 0.17 0.21 0.18 0.20 0.14 0.26 MgO 6.29 6.36 7.23 6.91 4.03 6.72 7.06 5.64 5.68 4.98 5.59 5.71 5.37 5.05 5.87 5.11 CaO 11.53 10.91 12.07 11.59 8.23 11.62 12.26 10.35 10.69 9.95 10.31 10.55 10.58 9.66 10.48 9.49 Na2O 2.30 2.33 2.16 1.96 3.27 2.26 2.09 2.66 2.58 2.65 2.57 2.67 2.27 2.62 2.47 2.50 K2O 0.31 0.24 0.23 0.17 1.21 0.29 0.18 0.40 0.41 0.46 0.36 0.33 0.43 0.43 0.35 0.47 P2O5 0.33 0.27 0.30 0.28 0.58 0.34 0.27 0.43 0.34 0.47 0.41 0.45 0.45 0.44 0.37 0.44 Total 99.35 98.36 98.84 98.98 99.41 100.30 99.18 99.81 98.97 98.98 98.35 98.11 99.71 99.27 99.64 98.23 Table 3 (continued).
C. LACASSE ET AL.
60
tic appears to be common of comenditic glass compositions as found for Site 907 tephra (Lacasse et al., in press).
Trace Elements
Six tephra samples were analyzed by neutron activation for their trace element concentration (Table 4). Neither crystal-rich ash zones, nor material available in low amounts, were analyzed. As analyses
were carried out on bulk ash samples, the concentration diagrams for mixed tephra consequently reflect the bulk composition, including the different amounts of mafic and silicic glass. Rare earth element (REE) concentrations (ppm) were normalized to the mean chondritic C1 composition of Anders and Grevesse (1989) and compared to the REE patterns of basic and silicic rocks from Iceland and Jan Mayen (Fig. 8). REE spectra of dominantly rhyolitic tephra layers (C, I, and K) show a pronounced enrichment in light rare earth elements
Notes: * = ash layer sampled at two depth intervals. DA = dispersed ash, AL = ash layer, and AP = ash pod. FeO* = total iron as FeO. Hole: Core, section: Interval (cm): Layer: Type: 919B 2H-1 106−109 H AL 919B 2H-1 106−109 H AL 919B 2H-1 106−109 H AL 919B 2H-1 106−109 H AL 919B 2H-2 24−27 I AL 919B 2H-2 24−27 I AL 919B 2H-2 24−27 I AL 919B 2H-2 24−27 I AL 919B 2H-2 24−27 I AL 919B 2H-2 24−27 I AL 919B 2H-2 24−27 I AL 919B 2H-2 24−27 I AL 919B 5H-5 87−88 J AP 919B 5H-5 87−88 J AP 919B 5H-5 87−88 J AP 919B 5H-5 87−88 J AP SiO2 49.41 49.76 49.92 49.95 60.12 46.46 46.22 60.05 45.71 47.81 49.47 52.26 48.95 49.80 50.12 49.74 TiO2 2.71 3.18 3.29 3.19 1.25 4.70 4.63 1.06 4.63 4.01 3.46 3.29 3.77 3.66 3.80 3.81 Al2O3 13.63 13.47 13.71 13.19 12.86 13.09 13.06 12.83 12.85 13.16 12.99 13.16 12.52 13.11 12.18 12.43 FeO* 13.41 15.00 14.64 14.47 13.32 15.61 15.34 11.53 15.70 15.15 14.86 13.74 16.29 14.43 15.79 15.51 MnO 0.13 0.31 0.18 0.20 0.43 0.20 0.23 0.50 0.39 0.23 0.33 0.39 0.16 0.14 0.22 0.28 MgO 5.66 5.06 5.16 5.02 0.93 4.90 4.86 0.46 4.91 4.54 3.84 3.40 4.69 4.69 4.39 4.50 CaO 10.35 9.61 9.81 9.69 5.05 10.03 9.88 4.23 9.99 9.33 8.15 7.48 9.29 9.13 8.93 9.10 Na2O 2.71 2.79 2.76 2.43 4.28 3.09 3.18 3.93 3.09 3.38 3.29 3.00 2.66 2.98 2.85 2.80 K2O 0.41 0.41 0.42 0.39 1.67 0.68 0.63 1.71 0.65 0.80 0.91 1.29 0.57 0.56 0.65 0.58 P2O5 0.44 0.44 0.43 0.44 0.49 0.98 0.96 0.32 1.03 1.01 1.20 0.94 0.70 0.45 0.73 0.69 Total 98.86 100.03 100.32 98.97 99.74 99.74 98.99 96.62 98.95 99.42 98.50 98.95 99.60 98.95 99.66 99.44 Hole: Core, section: Interval (cm): Layer: Type: 919B 5H-5 87−88 J AP 919B 5H-5 87−88 J AP 919B 5H-5 87−88 J AP 919B 5H-5 87−88 J AP 919B 5H-5 87−88 J AP 919B 5H-5 87−88 J AP 919B 5H-5 87−88 J AP 919B 5H-5 87−88 J AP 919B 5H-5 87−88 J AP 919B 6H-6 22−25 K DA 919B 6H-6 22−25 K DA 919B 6H-6 22−25 K DA 919B 6H-6 22−25 K DA 919B 6H-6 87−91 L AL 919B 6H-6 87−91 L AL 919B 6H-6 87−91 L AL SiO2 49.60 49.65 49.04 48.64 49.62 48.82 48.55 48.86 48.88 50.43 51.78 51.24 50.73 49.71 50.46 49.97 TiO2 3.94 3.75 3.78 3.74 3.93 3.78 3.69 4.04 3.78 2.41 3.42 2.37 3.75 2.96 3.25 3.07 Al2O3 12.35 12.38 12.18 12.07 12.65 12.01 12.32 12.45 12.46 13.27 12.99 13.40 12.85 13.12 12.60 13.19 FeO* 15.52 15.78 15.72 16.38 14.50 16.02 16.11 16.12 15.59 14.26 14.37 14.38 14.76 14.94 15.43 15.17 MnO 0.23 0.19 0.34 0.24 0.22 0.27 0.30 0.23 0.16 0.42 0.27 0.27 0.13 0.23 0.27 0.31 MgO 4.36 4.52 4.42 4.69 4.66 4.57 4.56 4.68 4.59 5.81 4.79 5.69 4.54 5.12 4.56 4.90 CaO 8.97 9.08 9.60 9.08 8.98 9.02 9.27 9.19 9.27 10.86 9.20 10.51 9.32 9.88 9.44 9.68 Na2O 2.71 2.80 2.48 2.83 2.98 2.74 2.64 2.69 2.71 2.51 2.78 2.63 2.77 1.81 2.70 2.72 K2O 0.59 0.54 0.56 0.57 0.45 0.60 0.57 0.59 0.65 0.21 0.66 0.34 0.61 0.31 0.44 0.40 P2O5 0.74 0.72 0.73 0.72 0.59 0.62 0.68 0.70 0.73 0.39 0.56 0.43 0.62 0.45 0.53 0.42 Total 99.01 99.41 98.85 98.96 98.58 98.45 98.69 99.55 98.82 100.57 100.82 101.26 100.08 98.53 99.68 99.83 Hole: Core, section: Interval (cm): Layer: Type: 919B 6H-6 87−91 L AL 919B 6H-6 87−91 L AL 919B 6H-6 87−91 L AL 919B 6H-6 87−91 L AL 919B 6H-6 87−91 L AL 919B 6H-6 87−91 L AL 919B 6H-6 87−91 L AL 919B 6H-6 87−91 L AL 919B 6H-6 87−91 L AL 919B 6H-6 87−91 L AL 919B 6H-6 87−91 L AL 919B 6H-6 87−91 L AL 919B 8H-3 94−95 M AP 919B 8H-3 94−95 M AP 919B 8H-3 94−95 M AP 919B 8H-3 94−95 M AP SiO2 50.41 54.15 50.20 50.06 49.27 48.82 49.05 48.59 49.30 49.63 49.53 50.40 48.16 49.17 50.68 50.36 TiO2 3.05 2.74 2.99 3.08 3.08 2.99 3.21 2.99 2.28 2.98 3.47 3.11 1.84 2.59 1.72 2.62 Al2O3 12.82 12.90 12.58 12.56 12.96 13.04 12.72 13.24 13.43 13.26 12.97 13.26 15.23 14.06 13.68 13.89 FeO* 15.48 13.79 15.05 15.24 14.86 14.85 15.41 15.07 13.84 14.72 14.90 15.20 11.53 13.91 13.81 14.14 MnO 0.19 0.16 0.30 0.16 0.23 0.27 0.21 0.24 0.22 0.17 0.25 0.23 0.29 0.24 0.12 0.26 MgO 4.98 3.93 4.96 5.02 4.88 5.08 4.93 5.34 6.28 5.06 5.17 5.26 7.75 6.27 5.94 5.86 CaO 9.55 8.24 9.84 9.37 9.74 9.91 9.41 9.65 11.25 9.59 9.75 9.73 12.38 11.08 10.63 10.24 Na2O 2.82 2.84 2.93 2.76 2.86 2.74 2.73 2.88 2.48 2.82 2.57 2.98 2.28 2.40 2.31 2.62 K2O 0.37 0.88 0.40 0.39 0.37 0.38 0.44 0.41 0.27 0.40 0.42 0.40 0.19 0.31 0.27 0.26 P2O5 0.48 0.42 0.40 0.45 0.43 0.35 0.44 0.44 0.45 0.47 0.45 0.48 0.40 0.40 0.31 0.41 Total 100.15 100.05 99.65 99.09 98.68 98.43 98.55 98.85 99.80 99.10 99.48 101.05 100.05 100.43 99.47 100.66 Hole: Core, section: Interval (cm): Layer: Type: 919B 8H-3 94−95 M AP 919B 8H-3 94−95 M AP 919B 8H-3 94−95 M AP 919B 8H-3 94−95 M AP 919B 8H-3 94−95 M AP 919B 8H-3 94−95 M AP 919B 8H-3 94−95 M AP 919B 8H-3 94−95 M AP 919B 8H-3 94−95 M AP SiO2 50.69 51.36 51.63 51.33 50.64 50.01 49.23 50.61 50.69 TiO2 1.50 1.75 1.48 1.54 1.65 3.65 2.06 1.70 1.85 Al2O3 14.47 13.67 14.08 13.77 13.61 12.80 13.68 13.79 14.02 FeO* 11.77 13.63 12.84 12.72 12.92 15.05 15.26 13.63 11.83 MnO 0.27 0.22 0.14 0.24 0.28 0.25 0.25 0.22 0.27 MgO 7.12 6.26 6.42 6.52 6.35 4.19 5.80 6.29 6.70 CaO 12.09 10.91 11.54 11.21 10.60 8.76 10.44 11.02 11.12 Na2O 1.99 2.21 2.24 2.19 2.26 3.10 2.30 2.13 2.62 K2O 0.10 0.16 0.18 0.17 0.24 0.76 0.14 0.23 0.15 P2O5 0.32 0.32 0.28 0.34 0.33 0.75 0.36 0.33 0.38 Total 100.32 100.49 100.83 100.03 98.88 99.32 99.52 99.95 99.63 Table 3 (continued).
Jan Mayen rock series Iceland rock series
I C D J HF E L B M K GG AA K B HI C 2 3 4 5 6 7 8 9 1 0 1 1 1 2 1 3 1 4 1 5 4 5 5 0 5 5 6 0 6 5 7 0 7 5
B
B
B
B
A
A
A
A
D
D
T
T
B
B
B
B
T
T
A
A
T
T
A
A
T
T
D
D
T
T
R
R
R
R
Na 2 O + K2 O ( w t% ) SiO2 (w t%)Figure 3. Total alkali-silica (TAS) plot indicating clas-sification (after Le Bas et al., 1986), on an anhydrous basis, of glass shards (mean and standard deviation) from Site 919, Irminger Basin. Fields: B = basalt; BA = basaltic andesite; A = andesite; D = dacite; R = rhy-olite; TD = trachydacite; T = trachyte; TA = tra-chyandesite; BTA = basaltic tratra-chyandesite; and TB = trachybasalt. All analyses have been normalized to a total of 100%. Fields for Jan Mayen and Iceland rock suites (whole-rock composition) are from Imsland (1984) and Jakobsson (1979a), respectively.
E C G F A I E C I L C G A M C C E E J J J J J K G AI L J J J F DEJJ D D D D AJ J J G K E D A D D C G D E G EII L DL CI G L L F L G C F H F C H AG L D H D H G L B B H L G L A E G L A HL B D G E F B B H L A AB A B K B H G H B G B B H H B E K E H E M M G B E H A D M F G F G M M E L M G G E F M M B F G G M A G F G G M F B F F G A G M G G F A G G G G M G A A G A A A G 4 6 8 1 0 1 2 1 4 CaO (wt%) 1 2 3 4 5 6 7 8 9 MgO (wt%) E C G F A I E C I L C G A M C C E EJ J J J J K G AI L J J J F D E J J D D D D AJJ J G K E D A D D C G D E G EII L D L CI G L L F L G C F HF C H A G L D H D H G L B B H L G L A E G L A H L B DG E F B B H L A A B A B K B H G H B G B B H H B E K E H E M M G B E H A D M F G F G M M E L M G G E F M M B F G G M A G F G G M F B F F G A G M G G F A G G G G M G A A G A A A G 6 8 1 0 1 2 1 4 1 6 1 8 FeO* (wt%) E C G F A I E C I L C G A M C C E E J J J J J K G AI L J J J F DE J J D D D D A J J J G K E D A D D C G D E G EIIL DL CI G L L F L G C F H F C H AG L D H D H G L B B H L G L A E G L A HL B D G E F B B H L A AB A B K B H G H B G B B H H B E K E H E M M G B E H A D M F G F G M M E L M G G E F M M B F G G M A G F G G M F B F F G A G M G G F A G G G G M G A A G A A A G 1 1 1 3 1 5 1 7 1 9 Al2 O3 (wt%) E C G F A I E C I L C G A M C C E E J J J J J K G A I L J J J F D E J J D D D D A J J J G K E D A D D C G D E G EII L D L C I G L L F L G C F H F C H AG L D H D H G L B B H L G L A E G L A HL B D G E F B B H L A AB A B K B H G H B G B B H H B E K E H E M M G B E H A D M F G F G M M E L M G G E F M M B F G G M A G F G G M F B F F G A G M G G F A G G G G M G A A G A A A G 4 5 5 0 5 5 6 0 SiO 2 (wt%) A B C D
Figure 4. Fields of basaltic and basaltic andesitic glasses from Pliocene− Pleistocene tephra in cores from Holes 919A and 919B in (A) SiO2/MgO,
(B) Al2O3/MgO, (C) FeO*/MgO, and (D) CaO/MgO diagrams. Plots are vs.
decreasing MgO concentration. All analyses have been normalized to a total of 100%. 0 1 2 3 4 5 TiO 2 (wt%) HOLE 919A Ash zone A at 0.29 mbsf Ash zone A at 0.11 mbsf HOLE 919B Ash zone G at 0.38 mbsf Ash zone G at 0.24 mbsf I H HH H H H H HH H H HH III I I HOLE 919B B BBBBBBB B BB BB BB CCCC C C C C 0 1 2 3 4 5 TiO 2 (wt%) HOLE 919A Layer H at 10.26 mbsf Layer I at 10.94 mbsf Layer B at 10.90 mbsf Layer C at 11.18 mbsf 0 0 . 5 1 K2O (wt%) E V Z VEIDIVOTN VESTMANNAEYJAR GRIMSVOTN VATNAFJOLL HEKLA KATLA L D L LL D L LLLLLL L LL D D DDD D DDDDDD L 0 1 2 3 4 5 TiO 2 (wt%) 0 0 . 5 1 K2O (wt%) HOLES 919 A&B Layer L at 126.87 mbsf Layer D at 61.35 mbsf F E C D A B
Figure 5. A−E. TiO2/K2O plots for basaltic and basaltic andesitic glasses
from Pliocene−Pleistocene tephra in cores from Hole 919A and 919B. All analyses have been normalized to a total of 100%. F. Fields for the Eastern Volcanic Zone (EVZ) in Iceland after Jakobsson (1979b) and Larsen (1981).
C. LACASSE ET AL.
62
(LREE) and depletion in Eu as for the silicic rocks in Iceland. Layer C in Hole 919A has been previously correlated with Layer I in Hole 919B based on the major element concentration of their basaltic and rhyolitic glass fractions. Both present an identical REE pattern, which indicates a similar amount of basaltic glass (minor fraction) and rhyolitic glass shards (dominant fraction). In contrast, correlative Layer B (Hole 919A) and Layer H (Hole 919B) are characterized by a limited enrichment in LREE due to the abundance of basaltic over rhyolitic glass shards. The slight LREE-enriched character of the ba-saltic Layer L reflects an evolved baba-saltic composition.
DISCUSSION
From the temporal distribution of ash layers at Site 919 we can in-fer several episodes of tephra deposition in the Irminger Basin, ap-proximately 200 km off the East Greenland coast, during the Pliocene−Pleistocene period. Correlation between marine and terres-trial records (ice cores) in Greenland can also be attempted, for long-range transport of Icelandic tephra over a distance of at least 750 km from source (Fig. 1). Processes responsible for the widespread dis-persal of tephra from Iceland to the Irminger Basin include: airborne transport, turbidity currents, and ice-rafting. However, only airborne dispersal of tephra by easterly winds can lead to their fallout both on the Greenland ice cap and in marine sediments in the Irminger Basin. Modal and granulometric characteristics of the discrete ash layers of Site 919 (type AL in Table 1), and their distance from Iceland suggest that they were derived from large explosive eruptions with plumes reaching the stratosphere.
The atmospheric circulation above Iceland is almost entirely from west to east at the tropopause (8−11 km elevation) and in the lower part of the stratosphere (Craig, 1965; Palmen, 1969), and this has lead to the dispersal of tephra east and north of Iceland during at least the Holocene and present (Thórarinsson, 1967; Kellogg, 1973; Sparks et al., 1981; Sejrup et al., 1989; Sjølholm et al., 1991). Wind velocities between 15−30 m/s at 10 km and 100 m/s higher in the stratosphere are commonly recorded (Craig, 1965; Palmen, 1969). The recovery of numerous ash falls at Site 907, on the Iceland Plateau, about 350 km north of Iceland, indicates that westerly and southwesterly winds influenced the dispersal of tephra during at least the Pliocene−
Pleistocene (Lacasse et al., in press). The middle and upper Pleis-tocene is characterized by a relatively steady deposition of ash layers and ash zones in this region with the exception of a period between isotopic Stages 15 and 8 (620−245 ka) where the sediment is devoid of ash deposition. In addition to a possible decrease in the volcanic activity, two hypotheses were suggested to explain the lack of tephra north and east of Iceland during this period: the occurrence of dense pack-ice or a modification in the stratospheric wind patterns (intensi-ty and direction).
Both of these environmental factors are strongly sensitive to sea-sonal and long-term climatic fluctuations and may have influenced the deep-sea deposition of airborne tephra at Site 919 as well. Due to the great distance of this site from Iceland (750 km), only the major 2 3 4 5 FeO* (wt%) 7 0 7 1 7 2 7 3 7 4 7 5 7 6 SiO2 (wt%) 0 0 . 5 1 1 . 5 CaO (wt%) 9 1 0 1 1 1 2 1 3 1 4 1 5 Al 2 O3 (wt%) 2 . 5 3 3 . 5 4 4 . 5 K2 O (wt%) 7 0 7 1 7 2 7 3 7 4 7 5 7 6 SiO2 (wt%) AZ1 AZ1 AZ1 AZ1 AZ3 AZ2 AZ2 AZ2 AZ2 AZ3 AZ3 AZ3 A & G A & G A & G A & G B, C, H & I B, C, H & I B, C, H & I B, C, H & I K K K K A B C D H G F E
Figure 6. Fields of rhyolitic glasses (mean and standard deviation) from Pliocene−Pleistocene tephra in cores from Holes 919A and 919B in (A) Al2O3/SiO2, (B)
FeO*/SiO2, (C) CaO/SiO2, and (D) K2O/SiO2
dia-grams. E−H. Fields of rhyolitic glasses from ash Zones 1, 2, and 3 in cores SU9029, SU9032, and K708 (after Lacasse et al., 1996). All analyses have been normal-ized to a total of 100%.
Q
A b O r
1
2
Quartz-feldspar boundary curve f or PH2O = 1kb
2 Limit between t he low-K and high-K groups 1 K A A G G B C H I
Figure 7. Normative projection of rhyolitic tephra from Site 919 in the “gran-ite” system. The quartz-feldspar boundary curve is for PH2O = 1kb (after
Thompson and MacKenzie, 1967; Sigurdsson, 1971). Dashed line indicates the limit between the low-K and high-K groups (after Sigurdsson and Loeb-ner, 1981).