HAL Id: cea-01693370
https://hal-cea.archives-ouvertes.fr/cea-01693370v2
Preprint submitted on 29 Jan 2018
HAL is a multi-disciplinary open access
archive for the deposit and dissemination of
sci-entific research documents, whether they are
pub-lished or not. The documents may come from
teaching and research institutions in France or
abroad, or from public or private research centers.
L’archive ouverte pluridisciplinaire HAL, est
destinée au dépôt et à la diffusion de documents
scientifiques de niveau recherche, publiés ou non,
émanant des établissements d’enseignement et de
recherche français ou étrangers, des laboratoires
publics ou privés.
glove box
Philippe Girones
To cite this version:
Philippe Girones. A monitor solution to characterize a fissile material in a glove box. 2018.
�cea-01693370v2�
Abstract
Handling fissionable material requires special know-how in managing irradiation and contamination risks while controlling any potential chain reaction, i.e. maintaining sub-criticality. If the risks associated with cleanup and dismantling operations had to be ranked in order of seriousness, keeping control of sub-criticality would probably be number one. Unlike contamination or irradiation, management of sub-criticality during the D&D phase is mainly ensured by control of the fissile material mass present; because management approaches by geometry or by concentration and moderation no longer apply. The control modes for management are therefore reduced to the question of the fissile mass.
This important subject represents an opportunity for the development of fissile matter mass control, or in other words, the development of innovative radiological characterization systems. More precisely, D&D operations require the design and deployment of innovative ways to ensure accurate measurement of the mass of matter in a hostile environment. More specifically, this means radiological characterization techniques are needed to evaluate decontamination factors or material holdup in equipment undergoing cleanup, based on an initial radiological inventory.
The technical proposal described in this document is based on gamma spectrometry applied to the characterization of the factors of decontamination or of fissile material accumulation in a glove box. The system’s originality lies in the development of a compact detector set-up functioning at ambient temperature, and requiring no modification of the glove box. Evaluation of the source term contained in the glove box results from gamma spectrum processing in order to obtain the expression of a decontamination factor. An original method was also developed to achieve this, enabling the decontamination factor to be realistically assessed. Trials carried out in an industrial location have demonstrated the validity of the approaches implemented in the system set-up and in processing the gamma spectra.
Gamma spectrometry is adapted to monitoring the evolution of the main radionuclides, 241Am and 241Pu. The quality of the spectra (resolution) and the sensitivity of the technique in the configurations retained for this study confirm the suitability of this in situ analysis technique. The work has confirmed that detectors equipped with CdZnTe crystals are devices which are well-adapted to on-line monitoring of glove box cleanup.
Keys Words: Decommissioning, Dismantling, Gamma Spectrometry, CdZnTe, Glove Box, Decontamination Factor Introduction
Handling nuclear matter requires special know-how in managing irradiation and contamination risks while controlling any potential chain reaction, i.e. maintaining sub-criticality [1]. A lack of up-to-date operational phase records, in particular as concern geometry modifications or changes in procedures and instructions, etc., means that managing sub-criticality represents a major risk for nuclear facility cleanup operations. During cleanup and dismantling, the four classical sub-criticality control modes [2] [fissile matter mass, dimensions and geometry of the apparatus involved, fissile matter
concentration for solutions and moderation ratio for dry or slightly damp products] often come down to management of the
fissile mass. This situation results from the impact on safe geometrical configuration of process component disassembly operations and of poor source moderator content control. Today’s D&D operations require the design and deployment of innovative ways to ensure accurate measurement of the mass of matter in a hostile environment. More specifically, this means radiological characterization techniques are needed to evaluate decontamination factors or material holdup [3] in equipment undergoing cleanup, based on an initial radiological inventory.
State of art
From the earliest days of the nuclear industry, radiological characterization systems have been developed for matter mass, particularly as required by IAEA inspectors [4]. These techniques take into account the specific activity of the radionuclides to be measured and the configuration of the equipment, whose walls are often fitted with protective biological shielding. These parameters have encouraged operators to work with the neutron fluence rate [5]. However neutron counting systems involve heavy installation works [6]. For example, the Glovebox Unattended Assay and Monitoring System (GUAM), has equipement assembled on glove box walls. Given the system’s complexity, the authors recommend leaving the assembled counters on the glove box permanently [7]. This is the perfect answer for process control requirements, but is not adapted to facility configurations during cleanup, when all equipment is in unstable radiological and technical environments. The Plutonium Imaging System In situ Measurement (DISPIM) is a mobile alternative for evaluating holdup in glove boxes. Its measurement results are given in the form of an image [8]. Two drawbacks limit the use of this type
equipment: the size of the systems, and the issue of supplying the 3He tubes. Gamma spectrometry, an alternative to passive neutron counting, has been used on components with no significant attenuation [9] [10]. GeHp or even CdZnTe types of detectors have been in use to qualify or quantify fissile matter since 1997 [11].
Methods such as ISOCS [12] or Ortec’s Isotopic [13] [14] are suitable for in situ characterization operations by gamma spectrometry on holdup and therefore assist in the evaluation of decontamination factors [15].
A point which these all gamma radiation analysis techniques, relative or absolute, have in common is their sensitivity to the distribution of the source within the scene, increased by the low energy of gamma rays from plutonium or its decay products. Adaptations or evaluations of gamma and alpha cameras therefore represent interesting approaches for the location of sources. An alpha camera works with the reactions alpha rays cause on nitrogen in the air [16] [17] but require heavy means of implementation. The technique is sensitive to light photons and the scene must be analyzed in the dark. Without wishing to discard the alpha camera solution, it is interesting to analyze the opportunity of using a gamma camera. Trials have already validated the usefulness of combining the three techniques [18]: alpha imagery, gamma imagery and high resolution gamma spectrometry (Figure 1).
Figure 1 : Image of a glove box containing a press – on the left, image from a gamma camera equipped with a pinhole; on the right, image from a gamma camera equipped with a coded mask.
The first promising results and the need to locate small-sized concentration points (e.g. hot spots) have encouraged the development of high resolution cameras [19]. These apparatus equipped with coded masks do however have the drawback of producing artifacts. A device limiting the appearance of decoding artifacts for gamma cameras has been patented [20], involving a part placed on the front of the gamma camera which reduces its solid angle.
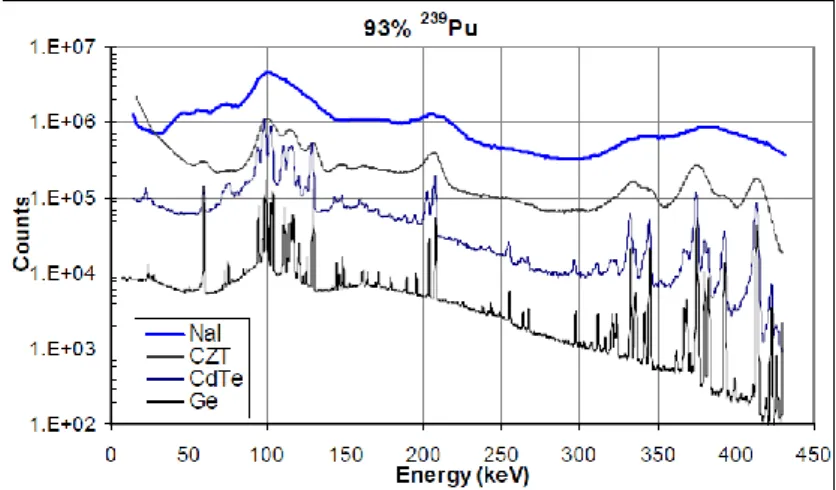
Nevertheless, in spite of the parallel between D&D needs and those of IAEA inspectors, the results from all this work on the radiological characterization of equipment containing fissile matter have not yet been followed up by the expected industrial implementation of in situ techniques. The solutions are heavy to set up, and the treatment methods complex. Given this technical situation and the growing desire to obtain indicators for decontamination monitoring during dismantling phases, the development of integrated systems is under way. The objectives and approaches decided on for the work described here were to make a light, mobile system available, and to make use of an analysis technique based on gamma spectrometry. Different gamma spectrometry detector technologies are used to characterize the actinides (Figure 2).
Figure 2: Gamma spectra for plutonium extracted from a low burn-up fuel, measured with different detector technologies: NaI[Tl], CdTe, CDZnTe, GeHP [21]
The decisions made were based on the requirement for control of the quality and of the quantity of the contaminant, as well as that of the uncertainty associated with the quantity of interest, the fissile mass (mf, in g). The complexity of the
gamma spectrum oriented the choice towards high resolution GeHP detectors, even though this type of detector has the disadvantage of needing a bulky cooling system which is difficult to set up in situations with limited space.
Gamma spectrometry acquisition line description
Alpha, beta, or spontaneous fission disintegrations of plutonium isotopes and their decay products give rise to the emission of neutrons and of gamma transitions [22], [23]. For the majority of D&D waste types, most of the gamma fluence comes from 241Am rays at 59.54 keV, a 241Pu daughter product. The intensity of the 59.54 keV ray emission is 35.92% and represents a technical criterion in choosing the technique and then the settings for the acquisition line, given that depending on the detector yield, the counting rate is often higher than 10000 c/s. The alternative for the processing capacity is to reduce the fluence by using a screen placed in front of the detector. The rich 94-104 keV zone is already used for isotopy estimations by the relative method in gamma spectrometry [24], provided there is a high-quality energy resolution, for GeHp detectors. The width at mid-height must be under 700 eV at 121 keV. These two criteria, i.e. counting rate and energy resolution, to which were added operational constraints, compactness and ambient temperature functioning, led to the decision to work with detectors equipped with CdZnte crystals.
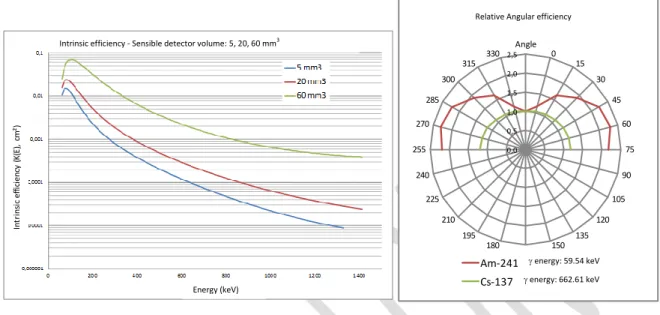
However this had the drawback of giving an energy resolution which was incompatible with isotopy estimation Multi-Group Analysis (MGA)-type software [25]. Gamma spectrometry detectors equipped with CdZnTe crystals do however give an intrinsic yield favoring low energies, with a width at mid-height for the 241Am < 1 keV peak for a 60 mm3 sensitive volume (Figure 3). These characteristics are compatible with the identification and absolute expression of an activity.
Figure 4: On the left, intrinsic yield curves for 5, 20 and 60 mm3 CdZnTe detectors; on the right, relative angular yield for a CdZnTe detector at 20 mm3 for two standard sources of 241Am and 137Cs. The relative associated uncertainties are 5% (k=2)
This good detection yield level at low energy favors the acquisition of gamma spectra which cover the energy dynamics from 0 to 450 keV. It should be remembered that the X and gamma rays characteristic of actinides have energy lines between 0 and 300 keV. For example, two lines characteristic of plutonium or of its decay products have energies of 59.54 keV for 241Am and 208 keV for 241Pu.
The industrial aspect of facilities where nuclear matter is handled means the work locations are often complex and restrictive. The premises are often small and the radiological conditions impose short residence times for obvious reasons related to the ALARA principle. The system must reduce intervention times and avoid impacting organs important for safety. The different methods for radiological characterization of a glove box interior require containment rupture, or are based on detectors placed outside the isolating casing. As the nuclear matter is contained within the casing, the optimal measurement configuration supposes a detector positioning which limits the size and the number of screens placed between the contaminant and the detector to the strict minimum. Given the technical data and the standard positioning system objective, the logical solution involved a docking approach which used the glove attachment rings (Figure 5) and positioned the detector in the space intended for an operator’s hands.
Figure 5: (left) Gamma-ray Collimator system with two detectors (right) Detector positioning system in a glove box [26] The detector is placed in a modular collimator. This collimator can house CdZnTe-type probes with different volumes [26]. A collimator with the optimal shape surrounds the detector. It is made from a copper alloy, and has a conical window which
0,0 0,5 1,0 1,5 2,0 2,5 Angle 0 15 30 45 60 75 90 105 120 135 150 165 180 195 210 225 240 255 270 285 300 315 330
Rendement angulaire relatif
Am-241, énergie 59,54 keV Cs-137, énergie 662 keV
Relative Angular efficiency
energy: 59.54 keV
energy: 662.61 keV Intrinsic efficiency - Sensible detector volume: 5, 20, 60 mm3
Energy (keV) In tr in si c ef fic ien cy (K (E ), cm ²) Gamma-ray Collimators Connecting flange
limits the solid angle. A set of collimators covering the solid angles from 10° to 90° was implemented as set out in the measurement configurations (Figure 6).
Figure 6: On the left, drawings of a series of collimators with solid angles from 10° to 90°; on the right, an assembled 90° collimator.
Gamma spectrum processing method
To obtain a decontamination factor evaluation and validate the radiological condition of a glove box, gamma spectrum processing is based on two classical methods: a relative solution and an absolute solution. The techniques for relative processing of a plutonium gamma spectrum are based on deconvolution and self-calibration algorithms for the spectrum energy zones which are rich in information: the 94-104 keV zone, for example. In the case of high resolution detectors, the result of relative processing on gamma spectra is an isotopy expression [27]. However, CdZnTe detector resolution [28] does not allow software developed for GeHp detectors to be used. The processing is therefore carried out based on classical spectrum processing. The estimation of a Decontamination Factor (DF) or an Accumulation Factor (AF) is obtained by processing the surfaces of characteristic significant lines for the radionuclides present in the source. The result is a source term evolution indicator. It is obtained by sequential processing between two acquisition times, t1 then t2.
i i i E E E
N
N
AF
ou
DF
2 1 ) 2 , 1 (_
_
, Equation 1N1Ei is the result of counting at t1, and N2Ei the result of counting at t2 > t1, considering that a source term evolution
between t1 and t2 is theconsequence of a cleanupoperation. It is assumed that the counting time for the two spectra is
identical. The expression of the uncertainty associated with the DF or AF evolution terms is linked to the statistics for accumulated counting in the gamma rays processed. The uncertainty associated with DF or AF is then solely dependent on the statistical precision (Ps) of the peak surface, in other words on the time allowed for counting.
i i i E 1 E 1 E 1 N NPs , Equation 2, for the surface peak1NEi et
1NEi 1NEiThus, (FD)(1,2)Ei(FD)(1,2)Ei. 1Ps2 Ei 2Ps2 Ei
The expression of the factor (DF) supposes that between two acquisitions the self-attenuation of the source and the quality of the screens placed between the source and the detector do not change, whereas the cleanup operations modify the configuration of the screens and of the source. An indicator qualifying these changes must therefore be taken into account for the DF. It is supposed that the cleanup reduces the activity of all the radionuclides homogeneously. This hypothesis is often checked in the case of mechanical cleanup work, frequently used for equipment in which chemicals are prohibited for sub-criticality control reasons. The indicator is then based on the energy dynamics of the gamma transitions (0, 450 keV, Figure 3). For example for the first spectrum of index 1 and the first two gamma lines 1 and 2, this ratio 1R1 is
expressed as: , with
Equation 3 CdZnTe probe
For an index 1 spectrum (counted at t1) composed of k significant lines, the number n in ratio 1Rn is the number of
combinations without repetition between the surfaces of the gamma spectrum lines, and thus . The processing for the index 1 spectrum (t1)is a matrix which groups the counting rates characteristic of the energies from whose
statistical precision is greater than 5%. The Ck2ratios k 2
C 1
Rc1 complete index 1 spectrum processing.
and
k 2 1 2 1 1 1R , R ,..., RC Equation 4The sensitivity of the indicators k 2
C j
R1 depends on the energy difference for the line processed. The two most significant lines are energies at 59.54 keV and 208 Kev (Figure 3). These two lines will therefore be systematically used for the estimation of these ratios.
A processing sequence involves the expression of DF and of R. The expression of DF is relevant if, for example, the ratio
1
R1/ 2
R1 is close to 1. If the ratio is very different from 1, the configuration evolution means a DF value cannot be expressed.
The value of R indicates a change in the configuration of the screens placed between the source and the detector. In other words, the ratios
R R
1 j
j
(j and j+1 represent the spectrum indices) are an indicator for the expression of the quality of the cleanup factors. Rc Rc Ic 1 j j 1 j j Equation 5
Spectrum processing and the calculation of indicators give information to help evaluate the decontamination factor. The couple (peak surface, ratios - Equation 22) is a simple solution to process gamma spectra when monitoring cleanup operations. The estimation of a decontamination factor (DF) is basic information for following cleanup sequences. The expression of activity is added to this when decisions need to be made, for example at the beginning of an operation, to determine the point zero or to set a cleanup target. The activity estimation is obtained with the following equation:
) E ( ) E ( l g c E i E . R . t N A i , Equation 6 E A
i : activity of the source (Bq), result of processing the gamma line of energy E in acquisition sequence i (t
i) E
iN
: clear peak surface for energy E in acquisition sequence i (ti)
tc : active acquisition time for spectrum (s), )
E (
: emission intensity for the gamma transition of energy E (number of gamma per disintegration),
) E ( l g
R : overall detection yield of the system
An analysis of the equation 6 variables shows that most of the uncertainty term is concentrated in the expression of the overall yield for the system:Rgl. The overall detection yield depends on the characteristics of the source: shape,
distribution of the contaminant within the source, self-attenuation, and the quality and number of screens which separate the source from the detector. The function of the overall yield Rglis the result of combining the intrinsic yield for the
detector Ri with the attenuation factor Ratt.
att i gl R .R R Equation 7
j j i i x . ) E ( µ i j elem , gl d x : avec R . e . ² d . . 4 1 ) R , , d , E ( R j jIt is easily shown that the estimation of the uncertainty associated with the quantity of interest for complex source-detector configurations (distribution in the component not controlled, sources-screen configuration difficult to observe) leads to high values of from 25 to 30% (1) [15]. The results for highly heterogeneous cases, like that of a MOX fuel pellet in a glove box, are absurd. The relative uncertainty for the gamma lines for 400 keV of energy is over 100% [9]. This means the number of parameters of influence must be reduced or, more concretely, the volume observed must be divided up. Reducing the solid angle has the advantage of reducing the zone observed, thereby reducing the impact of the parameters of influence on the uncertainty associated with a quantity of interest. The technological and technical decisions made in this study were motivated by the need to decrease the influence of Ratt expression variables. The detector positioning and the
different solid angles of the system described here (Figure 6) met these requirements and enabled the characterization operation to be calibrated by isolating, for example, a surface whose activity is controlled.
Results of the measurement campaign
To validate the system and the processing method, a series of measurements was carried out in a fuel cycle facility. The radionuclide plutonium is handled in the process equipment which was to be characterized. It is a classical process, contained in very large glove boxes. The glove boxes are fitted with biological protection panels, and have numerous glove rings fitted onto the facades to facilitate maintenance. They are located in relatively small cells, a configuration which meant little space to intervene and in particular to equip the glove box with characterization systems. It was therefore an ideal experimental configuration for testing the radiological characterization system (Figure 5).
The trials were undertaken to check the system’s suitability for acquisition and processing in an operating industrial situation [29]. The conditions enabled validation of the quality of the indicators for the monitoring of a cleanup operation, DF and R. As a facility operating phase is not the target configuration for the system, the estimation of the two indicators was therefore carried out indirectly, assessing the fluence quality for the operator hand zone and the attenuation factor for the biological protection. Two data collection and processing phases were carried out: the first focused on the spectrum quality by separating it into energy zones of interest and analyzing the line quality [24]. An attenuation estimation for the biological protection was the method retained to qualify the technique’s sensitivity to changes in the contamination level. Zone from 30 to 90 keV
The first part of the gamma spectrum is dominated by the line at 59.54 keV (Figure 7) with an emission intensity of 35.6%. This line is preceded by two energy lines at 26.34 keV and 33.19 keV. The width at mid-height of the main line is 4 keV.
Figure 7: Zone from 30 to 90 keV of the gamma spectrum for a 600 s acquisition with a CdZnTe detector, 60 mm3 sensitive volume
The FD for a glove box can easily be estimated through the evolution of the characteristic line for 241Am. It has the advantage of a highly significant fluence. The counting time is therefore compatible with real time functioning.
Zone from 90 to 105 keV
This zone is very rich in gamma lines and represents an interest when using a GeHP detector [24] for spectra whose mid-height peak width (resolution) is low. Using CdZnTe detectors is a practical solution but impacts processing for this zone because of the quality of the peaks, which have a mid-height width greater than 4 keV (Figure 8).
Figure 8: 95-150 KeV zone of the gamma spectrum for a 600 s acquisition with a CdZnTe detector, 60 mm3 sensitive volume A cooled CdTe type crystal is better adapted to measuring plutonium as it gives a smaller mid-height width: 102 keV for the 59.54 keV line [30]. The system can be equipped with this type of detector without any modifications, for example in order to attempt to obtain an isotopy estimation or measure X rays.
Zone: 120-400 keV
The last zone analyzed is dominated by the 208.00 keV line. At high energy, it is completed by three energy lines: 267.54 keV, 322.56/335.37 keV and 368.62. At low energy, the 148.57 keV peak borders this zone on the left (Figure 9).
Figure 9: Plutonium spectrum – gamma spectrum energy zone 120-400 KeV for a 600 s acquisition with a CdZnTe detector, 60 mm3 sensitive volume
The significant lines in this zone are useful for the activity calculation because of the reduced influence of the atomic number Z of the screen material.
Analysis of these three zones of interest on gamma spectra shows the compatibility of this type of detector for the in situ acquisition of gamma spectra in plutonium contaminant characterization. The two 59.54 and 208 keV energy lines give a statistical precision lower than 3%. They are relatively symmetric with only slightly marked tails for a detector of this volume (60 mm3). The detector gives a low energy detection yield which is sufficient to ensure acquisitions with counting times suitable for cleanup monitoring operations. These results consolidated the technological selections made.
Estimation of retention level evolution: Estimation of a decontamination factor
The option retained to validate the evaluation method for the retention change was governed by the technical means available during the in situ measurement campaign. Validation was established based on measurements of the attenuation coefficients for the protection equipment: radiation protection gloves [31] and glove box panels. As these trials qualified the relative processing for the gamma spectra, the gamma spectrum quantitative processing method did not need any special in situ qualification. The qualitative processing method is solely dependent on the hypotheses retained to plot the standard calibration curve. The acquisition method is coupled to location instruments like gamma cameras or exploits scanning methods described in the characterization methods applied to large components.
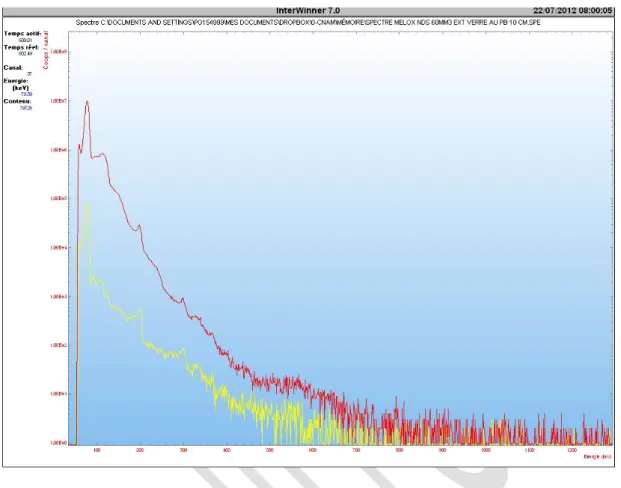
Overlapping two spectra is a means of direct analysis for the efficiency of the screen (Figure 10). Spectrum processing shows the glove suppresses the zone below 25 keV and reduces the gamma fluence for the 59.54 keV line by 28%. This result confirms the dose reduction to human extremities recorded since the equipment was set up.
Figure 10 : Overlapping of two spectra for an evaluation of the protection efficiency of a radiation protection glove; red spectrum without protection, yellow with radiation protection glove
The same type of approach was applied to assess the attenuation from “kiowaglass” walls (polymethyl methacrylate PMMA doped with 30% lead), then from lead glass. The detector was set up without any protection or shielding on either side of the wall in a symmetric configuration.
Figure 11: Red spectrum inside the glove box and yellow outside, protected by lead glass
The attenuation of the 59.54 keV energy rays is comparable to that obtained with the Kiowaglass. It is more than 100 and corresponds to the data supplied by the constructor. These acquisitions were carried out with a 60 mm3 volume detector. The choice of this apparatus was justified by the need to have a system which was sufficiently sensitive for decontamination follow-up, particularly at the end of an operation when the source intensity is reduced. However, at this volume the resolution is degraded and the data obtained is complicated to process. An additional study will be run to improve the spectrum processing for degraded resolutions [32]. Until the results of these new studies are available, a practical solution had to be found. A small-volume detector (5 mm3) was used to improve the data processing. The mid-height width for the 59.54 keV energy line is then 3.4 keV. While this is a certain improvement, it is still not enough for processing the 94 -104 keV zone. Further studies must be carried out with cooled CdTe- base detectors and completed by an advanced spectrum analysis using, for example, the Sigale software dedicated to CdZnTe gamma spectra [33] or interactive deconvolution methods like SINBAD [34].
Conclusion
Gamma spectrometry is adapted to monitoring the evolution of the main radionuclides, 241Am and 241Pu. The quality of the spectra (resolution) and the sensitivity of the technique in the configurations retained for this study confirm the suitability of this in situ analysis technique. The work has confirmed that detectors equipped with CdZnTe crystals are devices which are well-adapted to on-line monitoring of glove box cleanup. When monitoring a cleanup operation, their size (diameter less than 10 mm, length 120 mm) simplifies setting up and they function at ambient temperature. The system will be able to be completed by LaBr3 detectors [35], especially at the end of operations when the level of radioactivity requires a higher
detection yield. However the latter are more bulky and so setting them up in confined spaces like glove boxes is more complicated.
A modular positioning system was used for the detector developed. Location in the position of an operator’s hand, plus the modularity of the collimation enabled two aspects to be followed: for an evaluation of the counting rate evolution for significant peaks (DF) and as an indicator of the measurement configuration which validates the quality stability for the screens placed between the source and the screen (R). The reliability of these indicators was validated in a fuel cycle plant via the evaluation of the biological protection quality and spectrum acquisition in a glove box.
These results open new perspectives for the processing of gamma spectra and of data. Plutonium isotopy estimation is under consideration, coupling deconvolution methods for CdZnTe gamma spectra [33] with the IGA algorithm [27]. This information would complete the other two indicators, DF and R, in cleanup monitoring. It is envisaged to use the R factors to implement the infinite energy method. R is the coefficient for the extrapolation line at infinite energy for mass values recorded for several total absorption peaks [36] [37] [38].
References
[1] NCSP, «US Département of enregy Nuclear Criticality Safety Program,» 1998. [En ligne]. Available: http://ncsp.llnl.gov/. [Accès le 12 2014].
[2] ASN, «La Règle Fondamentale de Sûreté : "R.F.S. "Criticité",» ASN, Paris, 1984.
[3] T. DOUGLAS REILLY, PANDA, Addendum, Nondestructive Assay of Holdup, Los Alamos: Los Alamos National Laboratory, 2007.
[4] IAEA, Safeguards Techniques and Equipement: 2011 Edition, Vienne: IAEA, 2011.
[5] H. Menlove, M. Krick, D. Langner, M. Miller et J. Stewart, «Advances in passive neutron instruments for safeguards use,» chez International symposium on nuclear material safeguards, Vienna, 1994.
[6] D. Henzlova, J. Marlow, H. Menlove, C. Rael et M. Swinhoe, «Neutron Data Collection and Analysis Techniques Comparison for Safeguards,» IAEA, Vienna, 2014.
[7] J. SHIMIZU, K. YAMAYA, M. SUZUKI et e. al., «Development of glovebox unattended assay and monitoring system for JNFL MOX Fuel Fabrication Plant,» chez The 26th annual meeting of INMM, Japanese, 2005.
[8] A. Mulligan et R. Sharpe, «Assay of PCM Crates and Drums using the BIL Solutions Ltd. Imaging DISPIM System,» Tucson, 2006.
[9] P. GIRONES, «Développement d'un système de mesure destiné à l'analyse non destructive d'élément d'installation nucléaire de base en vue de leur démantèlement ou de leur déclassement,» CNAM, Lyon, 1995.
[10] R. Carchon et a. al, «Gamma radiation detectors for safeguards applications,» Nuclear Instruments and Methods in Physics Research Section A: Accelerators, Spectrometers, vol. 579, n° %11, pp. 380-383, 2007.
[11] V. Ivanov, J. Mintcheva, A. Berlozov et A. Lebrun, «Performance Evaluation of New Generation CdZnTe Detectors for Safeguards Applications,» chez Symposium on International Safeguards, Vienna, 2014.
[12] CANBERRA, «In Situ Object Counting Systems (ISOCS),» Canberra, [En ligne]. Available: http://www.canberra.com/products/insitu_systems/isocs.asp. [Accès le 2 12 2014].
[13] D. Vo et P. SEO, «Testing the Ortec’s Isotopic and Eberline’s Snap software for Uranium waste,» chez 25th Annual Symposium on Safeguards and Nuclear Material management, Norra Latin, 2003.
[14] R. DEWBERRY, «Benchmarking Ortec ISOTOPIC Measurements and Calculations,» Savannah River National Lab, 2008. [15] S. DOGNY, «Feedback from the operation of the ISOCS in support to the plutonium facility decommissioning project at
the MARCOULE UP1 reprocessing plant (France) and possible gain for new projects with new CANBERRA systems,» n° %1978-1-4244-5207-1, 2009.
[16] F. LAMADIE, F. DELMAS, C. MAHA, P. GIRONES, C. LE GOALLER et J. COSTES, «Remote alpha imaging in nuclear installations: new results and prospects,» IEEE Transactions on Nuclear Science, vol. 52, n° %16, pp. 3035-3039, 2005. [17] F. LAMADIE, «Étude et qualification d'un prototype de caméra pour la localisation à distance des radioéléments
émetteurs de particule alpha,» CNAM, Paris, 2005.
[18] o. Gal et a. al., «Development of a portable gamma camera with coded aperture,» Nuclear Instruments and Methods in Physics Research Section A: Accelerators, Spectrometers, Detectors and Associated Equipment, vol. 563, n° %11, pp. 233-237, 2006.
[19] M. Gmar et e. al, «Development of coded-aperture imaging with a compact gamma camera,» IEEE Transactions on Nuclear Science, vol. 51, n° %14, pp. 1682-1687, 2004.
[20] F. LAMADIE, C. BRENNEIS, P. GIRONES et S. BARRAS, «Dispositif limitant l'apparition d'artéfacts de décodage pour gamma à masque codé». France Brevet FR0550986, 26 octobre 2005.
[21] P. Russo et D. Vo, «GAMMA-RAY DETECTORS FOR NONDESTRUCTIVE ANALYSIS,» chez Passive Nondestructive Assay Manual - PANDA, Los Alamos, USA, Nuclear Regulatory Commission, 2007, pp. Addendum 1-42.
[23] Laboratoire National Henri Becquerel, «Recommended data,» LNHB, 24 juin 2013. [En ligne]. Available: http://www.nucleide.org/DDEP_WG/DDEPdata.htm. [Accès le 10 mars 2016].
[24] T. Sampson, «Plutonium Isotopic Composition by Gamma-Ray Spectroscopy,» 2006. [En ligne]. Available: http://www.lanl.gov/orgs/n/n1/panda/00326403.pdf. [Accès le 12 juin 2016].
[25] R. GUNNINK, «MGA (Multi-Group Analysis): A gamma-ray spectrum analysis code for determining plutonium isotopic abundances,» UCRL-LR, vol. 1.
[26] P. GIRONES, «Dispositif de suivi de matière nucléaire placé dans une boite à gants». France Brevet WO 2011161057 (A1), 23 12 2011.
[27] A. SIMON, «Determination of Actinide Isotopic Composition: Performances of the IGA Code on Plutonium Spectra According to the Experimental Setup,» vol. 58, n° %12, 2011.
[28] R. ARLT, M. APARO et H. BOECK, «Spectrum catalogue of gamma spectra taken with CdTe and CdZnTe detectors,» vol. 458, n° %11-2, 2001.
[29] C. SANDRINI, «Etude d’une méthode et des moyens de caractérisation radiologique in situ pour l’évaluation de la dosimétrie prévisionnelle pour l’usine de fabrication des combustibles MOX,» CNAM, Paris, 2012.
[30] J.-P. PONPON, Détecteurs à semi conducteur Principes et matériaux pour la détection et l'imagerie des rayonnements nucléaires, Paris: Ellipses, 2007.
[31] J. GUERSEN et a. al., «Intérêt des gants radio-atténuateurs : une évaluation expérimentale,» Radioprotection en radiologie interventionnelle :, vol. 46, n° %13, pp. 387-397, 2011.
[32] D. VO et P. Russo, «PC/FRAM plutonium isotopic analysis of CdTe gamma-ray spectra,» Nuclear Instruments and Methods in Physics Research Section A: Accelerators, Spectrometers, Detectors and Associated Equipment, vol. 486, n° %13, pp. 813-824, 2001.
[33] I. ESPAGNON, A. C. Simon, L. F. et a. M. C., «sIGAle, a new code for automatically determining radionuclide activities using CdZnTe spectrometry,» Advancements in Nuclear Instrumentation Measurement Methods and their Applications, n° %1978-1-4244-5208-8, pp. 1-7, 2009.
[34] T. Vigineix, Exploitation des spectres gamma par méthodes non paramétrique et indépendante d’a priori formulés par l’opérateur, Clermont Ferrand, 2011.
[35] J. Sullivan, M. W. Rawool-Sullivan et T. Wenz, «LaCl3(Ce) and LaBr3(Ce) gamma-ray spectra with various plutonium isotopic and uranium enrichment standards,» Journal of Radioanalytical and Nuclear Chemistry, vol. 276, n° %13, pp. 699-705, 2008.
[36] J. MOREL, «La méthode d'évaluation des quantités de plutnium par sepctroémtru gamma appliquée aux mesures de retention au contrôle de déchets à la surveillance du démantèlement des installations,» CEA, 1987.
[37] A. GODOT, «Détermination par spectrométrie gamma de la teneur en plutonium et en américium de produits issus de séparation Pu/Amapplication aux bains de sels,» CMAN, Paris, 2005.
[38] N. SAUREL, «HDR : Conception et réalisation de systèmes de contrôle non destructif par mesure du rayonnement nucléaire et métrologie associée pour la quantification des radionucléides contaminant les déchets et les procédés de l'industrie nucléaire,» Grenoble, 2013.