HAL Id: hal-00137980
https://hal.archives-ouvertes.fr/hal-00137980
Submitted on 22 Mar 2007
HAL is a multi-disciplinary open access
archive for the deposit and dissemination of
sci-entific research documents, whether they are
pub-lished or not. The documents may come from
teaching and research institutions in France or
abroad, or from public or private research centers.
L’archive ouverte pluridisciplinaire HAL, est
destinée au dépôt et à la diffusion de documents
scientifiques de niveau recherche, publiés ou non,
émanant des établissements d’enseignement et de
recherche français ou étrangers, des laboratoires
publics ou privés.
ALBUM: a tool for the analysis of slitless spectra and
its application to ESO WFI data.
Christophe Martayan, Dietrich Baade, Anne-Marie Hubert, Michele Floquet,
Juan Fabregat, Emmanuel Bertin
To cite this version:
Christophe Martayan, Dietrich Baade, Anne-Marie Hubert, Michele Floquet, Juan Fabregat, et al..
ALBUM: a tool for the analysis of slitless spectra and its application to ESO WFI data.. The 2007 ESO
instrument calibration workshop, Jan 2007, Garching bei Muenchen, Germany. pp.595. �hal-00137980�
hal-00137980, version 1 - 22 Mar 2007
spectra and its application to ESO WFI data.
C. Martayan1,2, D. Baade1, A.-M. Hubert2, M. Floquet2, J. Fabregat3, and
E. Bertin4
1
European Organisation for Astronomical Research in the Southern Hemisphere, Karl-Schwarzschild-Str. 2, 85748 Garching b. Muenchen, Germany
dbaade@eso.org
2
GEPI-Observatoire de Paris, 5 place Jules Janssen, 92195 Meudon cedex, France christophe.martayan@obspm.fr
3
Observatori Astron`omic de la Universitat de Val`encia, Edifici Instituts d’Investigaci´o, Pol´igon La Coma, 46980 Paterna Val`encia, Spain
4
Institut d’Astrophysique de Paris, 98bis boulevard Arago, 75014 Paris, France Summary. ALBUM is a general-purpose tool to visualize and screen large amounts of slitless spectra. It was developed for a search for emission-line stars in SMC and LMC clusters. The observations were obtained with ESO’s Wide Field Imager (WFI) and comprise ∼8 million low-resolution spectra. The tool as well as the re-sults of its application to the SMC part of the database are presented. The inferred frequency of Be stars is compared to the one in the higher-metallicity environment of the Milky Way.
1 Data reduction
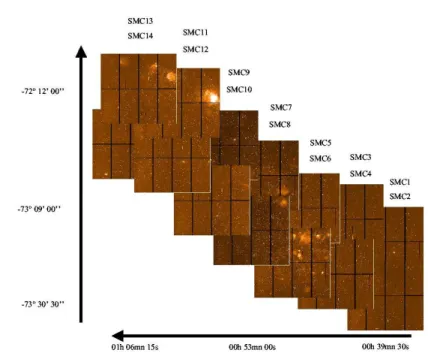
Observations (see Fig. 1) covering much of the Small Magellanic Cloud (SMC) have been obtained in September 2002 with the WFI attached to the 2.2-m MPG Telescope at La Silla. The instrument was used in its slitless spectro-scopic mode. To reduce crowding, the length of the spectra was limited by means of a filter with a bandpass of 7.4 nm centered on Hα. Unfortunately, a large part of the fields suffers from substantial non-homogeneous defocus-ing, which severely reduces the contrast between stars with and without line emission at Hα.
The basic reduction of the CCD images was performed with the MSCRED IRAF tasks except for the astrometry, for which the ASTROM package ([8]) was applied to the extracted 1st-order spectra. The achieved accuracy was 0.5-1” rms. The extraction in 2-D of the spectra was accomplished by means of the SExtractor software ([1]). All in all, about 1 million of the 3 million spectra available in the SMC part of the survey proved usable.
To recognize and distinguish emission-line stars (Em**) from other ob-jects, we created the ALBUM package in idl. Its strategy is based on the assumption that the 2-D point-spread function (PSF) is only slowly varying
2 C. Martayan, D. Baade et al.
Fig. 1.The Small Magellanic Cloud as projected on the WFI frames used in this study.
2006-05-17 file:///scratch/cmartaya/nuit1/SMC/SMC9/ogle107bigr/37330.0or.jpg #1
2006-05-17 file:///scratch/cmartaya/nuit1/SMC/SMC9/ogle107bigr/37330.0subP.jpg #1
Fig. 2.Non Emission line star. Left panel: original source. Right panel: projection of the residual of the subtraction of the mean profile
2006-05-17 file:///scratch/cmartaya/nuit1/SMC/SMC9/ogle107bigr/36804.0or.jpg #1
2006-05-17 file:///scratch/cmartaya/nuit1/SMC/SMC9/ogle107bigr/36804.0subP.jpg #1
Fig. 3. Emission line star. Left panel: original source. Right panel: projection of the residual of the subtraction of the mean profile, due to the emission in Hα and the defocus a ring structure with 2 peaks is observed.
with position in the frame and only insignificantly falsified by the inclusion of emission-line objects in the calculation of the mean local PSF. Typically, 50-250 spectra were aligned (by cross correlation), co-added, and normal-ized. This local template spectrum was subtracted (after cross correlation and shift) from each normalized 2-D spectrum (see Fig. 2) to be checked for Hα line emission. In the case of Em*, the 2-D spectra show a secondary peak (see Fig. 3). But after subtraction of the mean PSF the resulting differ-ence images display a more characteristic and conspicuous ring-like structure, which is due to the large defocus (see Fig. 3). Since this peculiar structure is more readily and reliably recognized by the human eye than by software, the identification of the Em* was done by visual inspection of the album of PSF-subtracted 2-D spectra.
2 Results: frequency of Be stars vs. metallicity
-6 -4 -2 0 2 4 -2 -1 0 1 2 3 Mv (B-V)0 O5V B0V B1V B2V B3V B5V B7V A0V A1V A3V A5V A7V F0V F5V G0IIIG5III K0III K5III M0III M5III
O6IB0I A0I F0I G5I M0I
All stars Em stars Em? stars
Fig. 4. (Mv,(B-V)O diagram for the stars cross-correlated in OGLE database.
The calibration in spectral types comes from [2]. Red ’+’ are for the non-Emission line stars, Blue ’*’ for the Emission line stars, and the green triangles are for the candidate Emission line stars.
We have investigated 85 clusters in the SMC with log(age) between 7 and 9 and E[B-V] available from the OGLE survey ([6]). For a total of 7741
4 C. Martayan, D. Baade et al.
stars, V, B, and I magnitudes were obtained from the OGLE database ([6], [7]). Fig. 4 displays the combined HR diagram of all clusters with the Em** marked. The results can be compared to the relative frequencies of Be stars (Be/(B+Be)) in Milky Way clusters ([5]) in order to search for any effect of the metallicity on the proportion of Be stars and on the still unknown reason for the development of disks around these extremely rapidly rotating stars. The fractions range from 0 to 46% in the SMC and from 0 to 24% in the Milky Way (MW), depending on the parent cluster. There seems to be a trend in that the lower the metallicity, the higher the proportion of Be stars is. This could be explained by higher rotational velocities in the SMC than in the MW ([3], [4]).
3 Conclusions
– A new method and software package for the reduction and analysis of slitless spectra was developed.
– It was applied to WFI data. Catalogues of Be stars in 85 SMC clusters were obtained.
– Metallicity seems to influence the relative proportion of Be stars among all B-type stars: The fraction of Be stars is larger in the SMC than in the MW.
– The equivalent study of the LMC is in progress (additional 5 million spectra).
– The combination of a large field and slitless spectroscopy is very powerful for surveys for objects with distinct spectral properties.
Acknowledgement. C.M. gratefully acknowledges support from ESO’s DGDF 2006.
References
1. E. Bertin, S. Arnouts: A&AS 117, 393 (1996)
2. K. R. Lang: Astrophysical data: Planets and stars, Eds Springer-Verlag, New York (1992)
3. A. Maeder, G. Meynet: A&A 373, 555 (2001)
4. C. Martayan, Y. Fr´emat, A.-M. Hubert, et al.: A&A 462, 683 (2007) 5. M. V. McSwain, D. Gies: ApJS 161, 118 (2005)
6. G. Pietrzy´nski, A. Udalski, M. Kubiak, et al.: AcA 49, 521 (1999) 7. M. Szymanski: AcA 55, 43 (2005)