HAL Id: hal-00316944
https://hal.archives-ouvertes.fr/hal-00316944
Submitted on 1 Jan 2002
HAL is a multi-disciplinary open access
archive for the deposit and dissemination of
sci-entific research documents, whether they are
pub-lished or not. The documents may come from
teaching and research institutions in France or
abroad, or from public or private research centers.
L’archive ouverte pluridisciplinaire HAL, est
destinée au dépôt et à la diffusion de documents
scientifiques de niveau recherche, publiés ou non,
émanant des établissements d’enseignement et de
recherche français ou étrangers, des laboratoires
publics ou privés.
Nansen, Amundsen and Makarov basins
U. Schauer, B. Rudels, E. P. Jones, L. G. Anderson, R. D. Muench, G. Björk,
J. H. Swift, V. Ivanov, A.-M. Larsson
To cite this version:
U. Schauer, B. Rudels, E. P. Jones, L. G. Anderson, R. D. Muench, et al.. Confluence and
redistribu-tion of Atlantic water in the Nansen, Amundsen and Makarov basins. Annales Geophysicae, European
Geosciences Union, 2002, 20 (2), pp.257-273. �hal-00316944�
Annales
Geophysicae
Confluence and redistribution of Atlantic water in the Nansen,
Amundsen and Makarov basins
U. Schauer1,8, B. Rudels1,2, E. P. Jones3, L. G. Anderson4, R. D. Muench5, G. Bj¨ork4, J. H. Swift6, V. Ivanov7, *, and
A.-M. Larsson4
1Alfred-Wegener-Institute for Polar and Marine Research, Bremerhaven, Germany 2Finnish Institute for Marine Research, Helsinki, Finland
3Bedford Institute of Oceanography, Dartmouth, Nova Scotia, Canada 4G¨oteborg University, G¨oteborg, Sweden
5Earth and Space Research, Seattle, USA
6Scripps Institution of Oceanography, La Jolla, USA
7Arctic and Antarctic Research Institute, St. Petersburg, Russia 8Presently at Naval Postgraduate School, Monterey, USA *now at Institute of Marine Studies University of Plymouth, UK
Received: 12 July 2000 – Revised: 11 June 2001 – Accepted: 9 July 2001
Abstract. The waters in the Eurasian Basin are conditioned by the confluence of the boundary flow of warm, saline Fram Strait water and cold low salinity water from the Barents Sea entering through the St. Anna Trough. Hydrographic sections obtained from RV Polarstern during the summer of 1996 (ACSYS 96) across the St. Anna Trough and the Voronin Trough in the northern Kara Sea and across the Nansen, Amundsen and Makarov basins allow for the deter-mination of the water mass properties of the two components and the construction of a qualitative picture of the circula-tion both within the Eurasian Basin and towards the Cana-dian Basin.
At the confluence north of the Kara Sea, the Fram Strait branch is displaced from the upper to the lower slope and it forms a sharp front to the Barents Sea water at depths between 100 m and greater than 1000 m. This front dis-integrates downstream along the basin margin and the two components are largely mixed before the boundary current reaches the Lomonosov Ridge. Away from the continental slope, the presence of interleaving structures coherent over wide distances is consistent with low lateral shear. The re-turn flow along the Nansen Gakkel Ridge, if present at all, seems to be slow and the cold water below a deep mixed layer there indicates that the Fram Strait Atlantic water was not covered with a halocline for about a decade. Anomalous water mass properties in the interior of the Eurasian Basin can be attributed to isolated lenses rather than to baroclinic flow cores. Eddies have probably detached from the front at the confluence and migrated into the interior of the basin. One deep (2500 m) lens of Canadian Basin water, with an anticyclonic eddy signature, must have spilled through a gap of the Lomonosov Ridge.
Correspondence to: U. Schauer
(uschauer@awi-bremerhaven.de)
During ACSYS 96, no clear fronts between Eurasian and Canadian intermediate waters, such as those observed fur-ther north in 1991 and 1994, were found at the Siberian side of the Lomonosov Ridge. This indicates that the Eurasian Basin waters enter the Canadian Basin not only along the continental slope but they may also cross the Lomonosov Ridge at other topographic irregularities. A decrease in salin-ity around 1000 m in depth in the Amundsen Basin probably originates from a larger input of fresh water to the Barents Sea. The inherent density changes may affect the flow to-wards the Canadian Basin.
Key words. Oceanography: general (Artic and
Antar-tic oceanography; descriptive and regional oceanography) Oceanography: physical (hydrography)
1 Introduction
Atlantic water enters the Arctic Ocean from the Greenland-Norwegian Sea through the Fram Strait and the Barents Sea. The Barents Sea’s contribution reaches the central Arctic Ocean primarily via the Kara Sea and the St. Anna Trough and then flows eastward along the Eurasian continental slope. There, it encounters and mixes with the boundary current car-rying the Atlantic water that has entered through the Fram Strait. The two inflows move cyclonically around the central deep Arctic Ocean basins primarily following the topogra-phy. The intersections of the continental slope with the sub-marine ridges impose topographic disturbances to the bound-ary flow, and the general cyclonic circulation in the Arctic Ocean consists of a complex system of basin-wide gyres. The most important bifurcation of the boundary current oc-curs north of the Laptev Sea where one part follows the Eurasian side of the Lomonosov Ridge towards north, while
3 72 58 107 55 73 41 29 97 90 87 82 15 69 99
x
x
-150º -120º -90º -60º -30º 0º 30º 60º 90º 120º 150º 180º 75º 80º 85º Barents Sea Kara Sea Novaya Zemlya St.Anna Trough Nansen Basin Amundsen Basin Greenland Sea Greenland Siberia FranzJosef Land Makarov Basin Svalbard East Siberian Sea Lomonosov Ridge Nansen-Gakkel Ridge Laptev Sea Severnaya Zemlya Fram Strait VoroninT rough Vilkit skij Strait 500 1500 2500 3000 3000 3000Fig. 1. Locations of Polarstern ARKXII
stations in the Arctic Ocean (dots with station numbers). Crosses de-note the position of elevations of the Lomonosov Ridge of less than 1000 m water depth according to the Interna-tional Bathymetric Chart of the Arc-tic Ocean (IBCAO) (2000). The thin line in the Amundsen Basin marks a section occupied in 1991 by Oden, which is used in Fig. 15. The thick lines along the Nansen Basin continen-tal slope mark sections from Polarstern cruises ARKIX-4 1993 (at 40◦E and 125◦E), from ARKXII 1996 (at 95◦E) and from ARKXI-1 1995 (at 105◦E) used in Fig. 14.
the rest enters the Canadian Basin (Aagaard, 1989; Rudels et al., 1994).
In the past decade, observations and conceptual models have indicated that the ventilation of the subsurface layers of the Arctic Ocean is more intense than had been previ-ously thought (Aagaard et al., 1985). The inflow of At-lantic water over the Barents Sea, quantified as about 2 Sv (1 Sv= 106m3/s) (Blindheim, 1989, Loeng et al., 1993), probably provides the largest contribution to this ventilation. In the Barents Sea, the Atlantic water is cooled and in sum-mer, it is freshened by net precipitation, river run-off and ice melt. In winter, the salinity increases due to freezing and brine release. The shelf processes thus seasonally modify the permanent advective flow. In the nineties, the Barents Sea in-flow directly renewed the upper 1500 m of the water column (Schauer et al., 1997), but it is also thought to be a major component of the deep and bottom waters of the Eurasian Basin (Jones et al., 1995).
Dense shelf water is formed on all shelves around the Arc-tic Ocean and is expected to contribute to the deep basins at different levels (Anderson et al., 1999). Relatively fresh wa-ter is added to the upper layers, while saline shelf wawa-ter sinks deeper, resulting in a negative θ − S correlation (θ : poten-tial temperature, S: salinity) in the intermediate and deeper waters. In the Canadian Basin, the boundary current is trans-formed through mixing with such shelf water as it circulates along the slope. Then, water with a negative θ −S slope in the range of −0.6◦C < θ < 0◦C and 34.88 < S < 34.92, called upper Polar Deep Water (Rudels et al., 1994), partly leaves the Arctic Ocean through the Fram Strait and partly recir-culates in a cyclonic loop at the Canadian Basin side of the
Lomonosov Ridge. Here, we use the term “upper Polar Deep Water” in a more restricted sense than Rudels et al. (1994), implying only the water transformed by slope convection in the Canadian Basin, and not the intermediate water mass with negative θ − S relation that is found below the Atlantic layer in the Eurasian basins.
During the summer of 1996, under the Arctic Climate Sys-tem Studies (ACSYS) programme, observations were carried out in the eastern Eurasian Basin during Polarstern cruise ARK XII (Fig. 1). The aim was to document the inflow of the Barents Sea branch of Atlantic water (BSBW) through the St. Anna Trough in order to determine its properties and in com-bination with previous observations, to refine the knowledge about the interaction, distribution and pathways of the two Atlantic water branches in the Arctic Ocean basins. Here, we present the results from this observational programme.
2 Field methods
The hydrographic observations were carried out with a mod-ified Neil Brown Mark III b CTD system, combined with a 36-bottle rosette sampler, both from the Scripps Institution of Oceanography. The CTD was equipped with two platinum thermometers, which monitor the stability of the tempera-ture measurements. The temperatempera-ture and pressure probes of the CTD were calibrated before and after the cruise. Salin-ity values derived from the CTD measurements were cali-brated with water samples analysed during the cruise with a Guildline AutoSal 8400 B salinometer. The processed data are accurate to 0.003◦C in temperature and 3 dbar in
pres-27.90 27.85 27.80 27.50 27.95 28.00 27.20 28.0 0 27.20 -3 -4 -5 -6 -7 -8 -9 -10- -12- -14- -16 -17 -18 -19 -20 -21 -23 -24 5-2 -26 -27 -28 -29 500 250 0 Pressure (dbar ) 0 100 200 300 400 Distance (km) 34 .90 34.90 34.8 5 34.8 0 34.75 34.70 34.50 34.00 34.9 5 34.80 34.8 0 34.00 -3 -4 -5 -6 -7 -8 -9 -10- -12- -14- -16 -17 -18 -19 -20 -21 -23 -24 5-2 -26 -27 -28 -29 500 250 0 Pressure (dbar) 0 100 200 300 400 Distance (km) 2.0 0 1.50 0.0 0 -0 .50 -1.00 -1.50 2.50 -1.70 1.5 0 -0.50 0.50 0.50 -3 -4 -5 -6 -7 -8 -9 -10- -12- -14- -16 -17 -18 -19 -20 -21 -23 -24 5-2 -26 -27 -28 -29 500 250 0 Pressure (dbar ) 0 100 200 300 400 Distance (km)
St. Anna Trough Voronin Trough
S so a) b) c) Q -1.0 -0.5 3.0 -33.5 -1.0 0.90 0.80 0.70 0.60 0.50 0.80 0.70 0.50 0.80 0.40 -3 -4 -5 -6 -7 -8 -9 -10- -12- -14- -16 -17 -18 -19 -20 -21 -23 -24 5-2 -26 -27 -28 -29 600 500 400 300 200 100 0 Pressure (dbar) 0 100 200 300 400 Distance (km) 305.00 315.00 330.00 340.00 310.00 320.00 340.00 315.00 310.00 -3 -4 -5 -6 -7 -8 -9 -10- -12- -14- -16 -17 -18 -19 -20 -21 -23 -24 5-2 -26 -27 -28 -29 600 500 400 300 200 100 0 Pressure (dbar) 0 100 200 300 400 Distance (km)
St. Anna Trough Voronin Trough
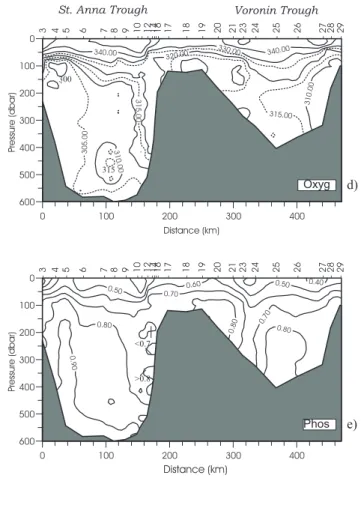
d) e) Oxyg Phos >0.8 <0.7 300 315
Fig. 2. Vertical distribution of (a) potential temperature (◦C), (b) salinity (psu), (c) density (σ0, kg/m3), (d) oxygen (µmol/kg), and (e) phosphate (µmol/l) across the St. Anna Trough and Voronin
Trough.
sure. Strong vertical temperature and salinity gradients in the upper 600 m of the water column led to time-lag errors in the CTD measurements and bottle flushing errors in the rosette samples. Final uncertainties in salinity are estimated to be 0.003 for depths exceeding 600 m, 0.005 for depths be-tween 200 and 600 m and 0.02 for depths less than 200 m. Oxygen analyses were performed using a modified Winkler method as per WOCE protocols, with a precision estimated at ±0.2 µmol/kg. Nutrients (total nitrate, phosphate, silicate) were analysed using an AutoAnalyzer as per WOCE proto-cols, with a precision estimated at ± 2%. Blanks were about 0.2 µmol/l for total nitrate and silicate and, 0.05 µmol/l for phosphate.
3 Results
3.1 Intermediate water exchange in the northern Kara Sea Two deep canyons connect the inner Kara Sea to the Nansen Basin: the St. Anna Trough in the west and the Voronin Trough in the east. The St. Anna Trough also has a direct connection to the 250 m deep passage between Franz Josef Land and Novaya Zemlya into the Barents Sea, which allows the Barents Sea Atlantic water to enter the trough. In con-trast, the Voronin Trough is bounded in the west by a 100 m shallow bank that prevents deeper water from the Barents Sea from entering the trough directly.
27.75 28.00
34.7
34.8
34.9
Salinity
-2
-1
0
1
2
Te
mperature
(degC)
0
25
50
Percentage
Fig. 3. Histogram of potential
tem-perature, and potential temperature vs. salinity of the layer 100 m above the bottom in the eastern St. Anna Trough (stations 6–17; stations 11, 13, 14, 16 were left out to provide spatially equal weight).
Strong east–west temperature and salinity gradients across the St. Anna Trough were present over the entire water col-umn (Fig. 2). A weak salinity and temperature maximum was present at an intermediate depth on the eastern side. The western warm core, with its temperature maximum located at 200 m, was as warm and saline (θ = 3.0◦C, S = 34.96) as the Atlantic layer in the boundary current flowing from the Fram Strait eastward along the continental slope (Schauer et al., 1997). The density stratification corresponds to an in-ternal Rossby radius of 6 km. A bottom-steered boundary current would thus be able to enter the 100 km wide canyon, making the western warm core a continuation of the bound-ary current penetrating into the trough from the north. Han-zlick and Aagaard (1980) traced a similar, but about 1◦C colder, core from the northern St. Anna Trough into the east-ern Barents Sea, and Loeng et al. (1993) found a westward flow south of Franz Josef Land. Evidently, a fraction of the Fram Strait branch of Atlantic water does not continue into the Nansen Basin boundary current but enters the northern Barents Sea.
Outflow of shelf water from the Barents and Kara Seas occurred in the deep layers in the center and at the east-ern slope of St. Anna Trough. The temperature in the low-est 100 m above the bottom was concentrated in two modes (Fig. 3). The minor mode was close to the freezing point (θ ≈ −1.3◦C) and had salinities around 34.75. It was sit-uated at the upper part of the flank and its properties were similar to those of water observed west of Novaya Zemlya, which is modified by freezing and brine rejection (Midttun, 1985; Loeng et al., 1993). The water at the upper slope of the St. Anna Trough might have been formed by the same pro-cess over the shallow banks in the northern Kara Sea. The major mode covering the deep part of the slope and the bot-tom of the trough was considerably warmer (θ ∼ −0.5◦C)
and more saline (S between 34.8 and 34.9). It is most likely not cooled Atlantic water from the Barents Sea branch since its salinity is too low. We believe that this mode also has its origin in ice formation and brine release (Midttun, 1985) formed in the lee polynyas that are frequently present over the shallow bank west of Novaya Zemlya (Martin and Cav-alieri, 1989). Its temperature, far from freezing, indicates a mixture of Atlantic water. As the cold, dense saline water sinks into the deeper depressions in the eastern Barents Sea, it mixes with the warmer, Atlantic water entering from the Norwegian Sea, thereby attaining higher temperatures. Evi-dence of such a process has been seen in the western Barents Sea (Quadfasel et al., 1992; Schauer and Fahrbach, 1999).
The oxygen concentration distribution (Fig. 2d) supports this interpretation. The warm Fram Strait branch water enter-ing on the western side of the St. Anna Trough and the warm mode of bottom water in the central trough have low oxygen concentrations (< 305 µmol/kg), as compared to the water on the eastern upper slope and a patch of water in the central region of the St. Anna Trough between about 400 and 550 m, where the temperature is at a local minimum. Differences be-tween the bottom waters at the eastern upper slope and in the central trough are evident also from nutrients (Fig. 2e) and from oxygen saturation values (not shown here). In the cen-tral part of the trough, the oxygen saturation was extremely low (< 86%) in the water near the bottom, indicating that this water has been near the bottom for a considerable amount of time and that biogenic decay products could have been added from the sediments.
The velocity structure is also consistent with the flow of a dense plume at the bottom. On the eastern half of the St. Anna Trough, the northward component of the geostrophic velocity increases towards the bottom and a large vertical shear is present in the easternmost part. Relative to the
sur-0.0 0.1 0.2 0.3 0.4 speed (m/s) 400 300 200 100 0 depth (m) ADCP Geostrophy
Fig. 4. Profiles of northward velocity in the eastern St. Anna
Trough. Dashed line: geostrophic velocity between stations 14 and 15. Solid line: averaged profile (2 hours) from ship mounted ADCP measurements at station 15.
face, the water below 50 m flows northward with velocities between 0.1 and 0.25 m/s (Fig. 4). The interpretation of the baroclinic velocity profile as a bottom-intensified northward flow is supported by ship-mounted ADCP measurements of the velocity profile which coincide in range and shape with the geostrophic profile. The transport resulting from a mean speed of 0.2 m/s for a 100 m thick layer of cold water at the bottom of the eastern 100 km of the St. Anna Trough would be 2 Sv, which is the same order as the mean eastward flow of 1.9 Sv in the eastern Barents Sea, measured by Loeng et al. (1993) and the inflow to the Barents Sea from the Norwe-gian Sea (Blindheim, 1989). The close agreement of these transports suggests that all of the net inflow from the west is strongly modified in the Barents/Kara Seas, leaving the shelf mostly with temperatures below 0◦C and salinities between 34.7 and 34.9, and entering the Eurasian Basin at depths be-tween 150 m and 600 m.
In the Voronin Trough, the water deeper than 100 m has properties (θ , S, and oxygen) similar to those found in the eastern St. Anna Trough. This is consistent with water leav-ing the St. Anna Trough and it follows the topography into the outer part of the Voronin Trough. Around stations 21 and 27, cores of slightly reduced oxygen and elevated tem-peratures, as compared to the surrounding, probably contain contributions of Fram Strait branch water. There were no in-dications of outflow of dense bottom water from the inner Kara Sea through the Voronin Trough.
3.2 The boundary current in the Eurasian Basin – conflu-ence and redistribution
The main Eurasian Basin section extends from the Kara Sea shelf west of Severnaya Zemlya, across the Nansen and Amundsen Basins, and over the Lomonosov Ridge into the
Makarov Basin with its southern end located 200 km east of the confluence of the two inflows. The Barents Sea branch and that part of the Fram Strait branch which had not en-tered the St. Anna Trough are clearly evident in the water mass properties in the Eurasian Basin north of the Kara Sea (Fig. 5). At the upper continental slope, i.e. where it is shal-lower than 1800 m (stations 30 to 34), below 150 m, there is a cold, low salinity 30 km wide water column that primarily contains water entering from the St. Anna Trough, the Bar-ents Sea branch. It is separated from the warmer and more saline Fram Strait branch (stations 35 to 39) and deeper inte-rior basin water by a sharp front which is narrower than the 13 km distance between stations (Fig. 5). The lower temper-atures associated with the inflow of Barents Sea water extend down to 1000 m as do the elevated oxygen and reduced phos-phate contents. Between 1000 m and 1500 m, the part of the basin water column that has been displaced downward by the injected water causes the temperature and density gradients between the slope and basin waters to reverse (Schauer et al., 1997).
At the narrow front of the confluence of the Fram Strait and Barents Sea branches, as well as further downstream in the boundary current, Rudels et al. (1999, 2000a) observed strong interleaving across the front. Schauer et al. (1997) found that at the Laptev Sea continental slope, the two branches have already lost much of their original proper-ties through mixing. In the upper 500 m in the Amundsen Basin, the boundary current carries about equal contributions of both branches, while at depths greater than 500 m, the con-tribution of the Barents Sea branch is larger. This shows that the converging Fram Strait and Barents Sea branches occupy slightly different density ranges. In fact, on the 1996 basin-wide section, the θ -S properties of the waters in the Nansen and Amundsen basins north of the Fram Strait inflow, and even those in the upper part of the Makarov Basin, lie be-tween those of the Barents Sea and Fram Strait branches (Fig. 6). The mixed water type of station 60 represents that part of the boundary flow which continues from the Laptev Sea along the Lomonosov Ridge (Woodgate et al., 2000).
The strong irregular inversions at the front suggest that they arise from the interleaving between the two different wa-ter columns. More regular inversions, such as at station 43 (Fig. 6), were prominent features across the entire section. Rudels et al. (1999) discussed the possible evolution of these structures through double diffusion from the initial frontal interleaving and their passive advection to the interior basin by the return flow within the Eurasian Basin. They were the most developed and most regular in northern Nansen Basin, primarily in the Atlantic layer, but also at deeper lev-els around 1000 m. Individual inversion layers can be traced to extend into the Amundsen Basin to the Lomonosov Ridge. At the core depth of the Fram Strait Atlantic layer, i.e. be-tween 150 and 350 m, the temperature and salinity decreased northward along the section up to the Nansen-Gakkel Ridge, where the lowest temperatures of this layer in the Eurasian Basin were found (Figs. 5 and 7). (In Fig. 7, we show verti-cally integrated properties to emphasize the horizontal
differ-0.00 -0.50 0.50 -0.80 1.00 -0.90 -0.95 0.50 0 100 200 300 400 500 600 700 800 900 Distance (km) 0.50 0.00 -0.50 -1.00 -1.50 -1.70 1.00 1.50 2.00 2.50 1.00 1.50 -1.50 -1.70 1.00 -2 9 -3 0 - - -33- -35- -37 -38 -39 -40 -41 -42 -43 -44 -45- -47-48 -49 -50 -51 -52 -53 -54 -55 -56 -57 -58-59 -60- -62- -64- -66 - -68 -69 -70- -72 500 250 0 Pressure (dbar) 3000 4000 2000 1000 Q a) 3000 4000 2000 1000 28.05 28.00 28.08 28.09 28.10 28.05 0 100 200 300 400 500 600 700 800 900 Distance (km) 27.95 27.90 27.80 27.50 27.95 27.50 27.20 -2 9 -3 0 - - -33- -35- -37 -38 -39 -40 -41 -42 -43 -44 -45- -47-48 -49 -50 -51 -52 -53 -54 -55 -56 -57 -58-59 -60- -62- -64- -66 - -68-69 -70- -72 500 250 0 Pressure (dbar) so c)
Nansen B Amundsen B Lomo R
3000 4000 2000 1000 34.92 34.92 34.93 34.94 34.90 34.90 -0 100 200 300 400 500 600 700 800 900 Distance (km) 34.80 34.50 34.00 34.85 34.90 34.93 34.95 34.00 33.50 -2 9 -3 0 - - -33- -35- -37 -38 -39 -40 -41 -42 -43 -44-45- -47-48 -49 -50 -51 -52 -53 -54 -55 -56 -57 -58-59 -60- -62- -64- -66 - -68-69 -70- -72 500 250 0 Pressure (dbar) S b) 34.95 34.93 Distance (km) 300.00 298.00 305.00 305.00 0 100 200 300 400 500 600 700 800 900 320.00 340.00 305.00 360.00 300.00 300.00 298.00 -2 9 -3 0 - - -33- -35- -37 -38 -39 -40 -41 -42 -43 -44-45- -47-48 -49 -50 -51 -52 -53 -54 -55 -56 -57 -58-59 -60- -62- -64- -66 - -68-69 -70- -72 500 250 0 Pressure (dbar) 1000 2000 3000 4000
Nansen B Amundsen B Lomo R
d) 300 290 Oxyg 0.90 1.00 1.00 1.00 0.90 0 100 200 300 400 500 600 700 800 900 Distance (km) 0.60 0.80 0.60 0.50 0.40 -2 9 -3 0 - - -33- -35- -37-38 -39 -40 -41 -42 -43 -44-45- -47-48 -49 -50 -51 -52 -53 -54 -55 -56 -57 -58-59 -60- -62- -64- -66 - -68-69 -70- -72 500 250 0 Pressure (dbar) < 298 1000 2000 3000 4000 Phos e) > 0.9
Fig. 5. Vertical distribution of (a) potential temperature (◦C),
(b) salinity (psu), (c) potential density (σ0, kg/m63), (d)
oxy-gen (µmol/kg), and (e) phosphate (µmol/l) across the Nansen, Amundsen and into the Makarov Basin.
ences). Only at station 42 was this trend interrupted by a lens of warmer water. The least eroded (i.e. warmest and most saline) parts of Fram Strait Branch Water (FSBW) appear as isolated lenses at stations 42 and 54 and at the Eurasian side of the Lomonosov Ridge (Fig. 7).
Apart from mixing with the cold BSBW, the warm FSBW Atlantic layer can be eroded through mixing with a cold, overlying layer. The FSBW extends to the surface in the Fram Strait, but in the Arctic Ocean, its upper part evolves into a cold, less saline layer through the interaction with sea ice during the freezing/melting cycle. This upper layer be-comes homogenised through haline convection in winter and allows for direct communication between the sea surface and the warm Atlantic layer of the FSBW in the southern Nansen Basin (Rudels et al., 1996). The convection to the
thermo-cline only becomes broken when low salinity shelf water with contributions from river run-off and/or Pacific inflow enters the interior of the Arctic Ocean and caps the more saline FSBW upper layer. Once this capping has occurred, the previous upper layer becomes a halocline, which will trap the heat lost upward by the Atlantic layer. The longer the convection to the thermocline is maintained, the colder we expect the Atlantic layer to become. The coldest Atlantic layer, found at stations 46 to 50, was below a cold (freezing point) surface mixed layer, reaching down to 150 m with a salinity of 34.3, which is more saline than observed earlier in this region (EWG Atlas, 1997). No halocline was present and the layer was located directly above the thermocline. A similar situation was observed in the Amundsen Basin the year before (Steele and Boyd, 1998) and was attributed to a
27.75 28.00 34.7 34.8 34.9 35.0 Salinity 0.0 3.0 Temperature (degC) 31,32,34 36 43 70,72 60 55 -1.0 4.0 1.0 2.0 -2.0
Fig. 6. Potential temperature vs. salinity along the cross-basin
sec-tion (see Figs. 1 and 5). Stasec-tions 31, 32, 34 represent the Barents Sea inflow; station 36, the Fram Strait Atlantic water inflow; sta-tion 43, the Nansen Basin interior; stasta-tion 55, the Amundsen Basin; station 60, western slope of the Lomonosov Ridge; and stations 70 and 72, the Makarov Basin.
change in the upper circulation with an eastward shift of the injection of low salinity shelf water.
Rudels et al. (1996) and Steele and Boyd (1998) estimated an annual mean heat loss from the Atlantic layer to the sur-face of about 1–3 W/m2in the absence of a halocline, either through turbulence or double diffusive convection. While the deepening of the mixed layer itself could have happened through convection during one or several strong winters, we can use the heat flux to estimate the time that the remaining upper layer of the FSBW has lost heat to the surface layer. Below 220 m at station 50, the regular interleaving structures of the FSBW indicate lateral processes to dominate; there-fore, we limit our cooling estimate to the layer between 150 and 220 m (Fig. 8). If the upper 70 m of FSBW in the bound-ary current, represented by station 37, experienced the heat loss of 1–3 W/m2without mixed layer deepening (which we regard not as very likely), it would require 2 to 5 years to cool the layer to the temperature observed at station 50 at the Nansen Gakkel Ridge. The other extreme would have been a successive mixed layer deepening from 70 to 150 m, and in addition, the layer between 150 and 220 m of the FSBW in the boundary current would have been cooled for 7 to 20 years in order to obtain the mean temperature of that same layer observed at station 50 at the Nansen Gakkel Ridge. Tracer measurements indicate a travel time of the FSBW be-tween the Fram Strait and the central Eurasian Basin in that order of magnitude (10 years apparent tritium/Helium-3 age (Frank et al., 1998)). If the cold water stems from colder Fram Strait inflow in the 1980s, the required heat loss would
0 100 200 300 400 500 600 700 800 900 -0.5 0.0 0.5 1.0 Temperature (degC) 34.8 34.85 34.9 Salinity 42 54 52 S_mean T_mean
Nansen Basin NGR Amundsen Basin
Lomonosov Ridge 400-1000 m 0 100 200 300 400 500 600 700 800 900 Distance (km) 295 300 305 310 Oxygen 150-350 m 400-1000 m
Nansen Basin NGR Amundsen Basin
Lomonosov Ridge 0 100 200 300 400 500 600 700 800 900 0 1 2 3 Temperature (degC) 34.5 34.6 34.7 34.8 34.9 35.0 Salinity 42 54 S_mean T_mean
Nansen Basin NGR Amundsen Basin
Lomonosov Ridge 150-350 m a) b) c)
Fig. 7. Cross-basin distribution of vertically averaged values from
stations 29 to 72 (see Fig. 1) (a) temperature and salinity in the core layer of the Fram Strait Branch Water (FSBW) (150–350 m),
(b) temperature and salinity in the layer of the Barents Sea Branch
Water (BSBW) (400–1000 m), (c) oxygen (µmol/kg) in the layers 150 to 350 m and 400 to 1000 m, respectively. The line at the bottom shows the water depth (NGR: Nansen Gakkel Ridge).
have been smaller, but it would again show that the travel time to the Nansen Gakkel Ridge is long. Given the uncer-tainties of the heat flux and the initial water properties, we do not want to specify times exactly, but rather we wish to make the point that the cold FSBW at the Nansen Gakkel Ridge obviously has a longer residence time than elsewhere in the Eurasian Basin and that it was exposed to a surface mixed layer without shielding halocline for several years.
In the layer between 400 and 1000 m, where the boundary current receives a large input from the Barents Sea, the salin-ity and temperature were the highest in the southern Nansen Basin and decreased across the northern Nansen and the Amundsen Basin (Fig. 5), again with the exception of limited mesoscale features. At the Eurasian side of the Lomonosov Ridge, the oxygen content was above 305 µmol/kg, as in the
-2 -1 0 1 2 3 temperature (°C) 250 200 150 100 50 0 pressure (dbar) 2 to 5 years 7 to 20 years 50 37
Fig. 8. Temperature profiles of the mixed layer and the upper
At-lantic water layer in the boundary current north of the Kara Sea (37) and at the Nansen Gakkel Ridge (50). The arrows show the mean temperatures over a 70 m thick layer and the cooling times to reach the temperature of station 50 if the respective layers of station 37 were exposed to 1–3 W/m2.
Barents Sea Branch Water (BSBW) at the continental slope. Evidently, the contribution of cold, low salinity Barents Sea water is more dominant towards the Lomonosov Ridge than in the interior basin.
On the Makarov Basin side of the Lomonosov Ridge, the deep water below 1000 m is clearly distinguished from the Eurasian Basin deep water, which is warmer and more saline (Figs. 5 and 6). In addition, above that level, there is a boundary in salinity, temperature and oxygen values over the Lomonosov Ridge (Fig. 5), though the distinction between the water masses is less pronounced than it was observed near 88◦N in 1991 during the ODEN 91 expedition (An-derson et al., 1994) or in 1994 (Swift et al., 1997). Along the ODEN 91 section, the intermediate water just east of the Lomonosov Ridge had the characteristics of Upper Po-lar Deep water, i.e. a negative temperature-salinity relation-ship in the density range around 28.0 kg/m3(Station Od26 in Fig. 9). The 1996 stations at 86◦N above and east of the
Lomonosov Ridge had a similar signature but a less clear negative slope, and the water at the FSBW level was much warmer and more saline than at ODEN 91. The front at 86◦N was much broader and had a more complex structure (e.g. three warm cores as opposed to one) than the fronts observed in 1991 and 1994. In addition, in 1996, the regular tempera-ture and salinity inversions mentioned above extended from the Amundsen Basin into the Makarov Basin (Fig. 9), while along the ODEN 91 section, inversions were only present in the Amundsen Basin. The coherence of these layer structures across the ridge implies that the shear across it must be weak
27.75 28.00 34.7 34.8 34.9 35.0 Salinity Te mperature (degC) 1.0 0.0 3.0 -1.0 4.0 2.0 -2.0 64 (AB) Od20 (AB) Od26 (MB) 70 (MB) 66 (LR)
Fig. 9. Temperature vs. salinity at the Lomonosov Ridge from
ARKXII 1996 at 86◦N (black) and from Oden 1991 at 88◦N (grey). Oden station 20 is in the Amundsen Basin and Oden station 26 is in the Makarov Basin. Note that the upper part from Polarstern station 70 (Makarov Basin) is similar to that of station 64 (Amund-sen Basin), while the intermediate part of station 66 (Lomonosov Ridge) shows interleaving structures similar to those at station 70 (Makarov Basin).
enough not to disrupt the structures, i.e. other than suggested in the circulation scheme in Rudels et al. (1994), the flow di-rection might not be opposite at the two sides of the ridge. The section at 86◦N crosses the ridge at the edge of a broad elevation rising to less than 900 m in water depth (see In-ternational Bathymetric Chart of the Arctic Ocean (IBCAO), Jacobsen et al., 2000). Anticyclonic flow around this topo-graphic feature can exchange water between the basins and account for the warm core found at the eastern side of the ridge. Episodic flow across the Lomonosov Ridge was ob-served closer to the Greenland side by Aagaard (1981). Such cross-ridge flow provides an additional input of Atlantic de-rived water from the Amundsen to the Makarov Basin in ad-dition to that from the boundary current along the continental shelf. The water crossing the ridge flows back towards the slope alongside of the colder Atlantic layer of the Makarov Basin, which takes part in a cyclonic circulation in that basin (Rudels et al., 1994; Swift et al., 1997).
Closer to the continental shelf (sections near 83◦N and 81◦N, Fig. 10), Eurasian Basin water extends far into the Canadian Basin and no upper Polar Deep water with a clear negative temperature-salinity relationship is present on these sections (Fig. 11). At 83◦N and at 81◦N, the thermoha-line distribution shows no significant differences between the two sides of the ridge. Oxygen concentrations above 305 µmol/kg indicate the presence of the Barents Sea branch in an almost uniform band at depths from about 400 m to
1100 m (Fig. 10c).
At the continental slope, the difference between the two basins is larger. There is a salinity maximum in the Atlantic layer in the Amundsen Basin that is significantly reduced in the Makarov Basin, and completely removed close to the shelf edge (Fig. 10). Since the sections at 81◦N and 83◦N show no return flow of low salinity upper Polar Deep wa-ter along the Lomonosov Ridge, we conclude that input of dense but low salinity water from the shelf has reduced the salinity of the upper layers of the boundary current along the slope, and is, in fact, in the process of creating the Canadian Basin Upper Polar Deep water (Rudels et al., 1994; Rudels et al., 2000a).
In the Eurasian Basin, the weak doming of the isopyc-nals (Fig. 5c) suggests a general cyclonic flow around the basin. However, the only distinct baroclinic flow is asso-ciated with the eastward-flowing boundary current over the continental slope in the southern Nansen Basin. There is no strong baroclinic signal in the vicinity of the ridges, and the geostrophic velocities referenced to the bottom show a banded structure across the section with values not exceed-ing 0.03 m/s (Fig. 12) and strong, topographically-steered current bands, if present, must be primarily barotropic (Woodgate et al., 2000).
3.3 Lenses and eddies
The Atlantic layer exhibits a large, warm core (stations 35 to 38) and four distinct warmer features that differ from the general horizontal background gradients across the section: in the Nansen Basin (station 42 near 250 m), in the Amund-sen Basin (station 54 near 400 m), and at each side of the Lomonosov Ridge (station 60 near 250 m and station 70 near 250 m) (Fig. 5). According to the circulation scheme pro-posed, for example, by Rudels et al. (1994), the cores in the Eurasian Basin could correspond to the inflow through the Fram Strait and to various return flows within the Eurasian Basin. A closer look at the structure of these features sug-gests that with the exception of the warmest water close to the slope and probably the warm core south of the Lomonosov Ridge, the features are isolated lenses of predominantly Fram Strait water, rather than continuous streams.
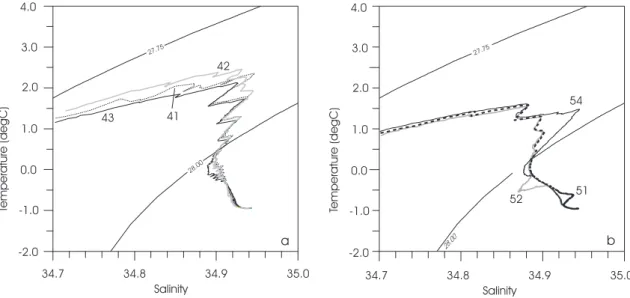
The temperature maximum at station 42, close to the in-flow core (T > 2.2◦C, S > 34.91), appears to be a warm lens detached from the Fram Strait inflow, since it has the baro-clinic structure of an anticyclonic eddy, rather than that of a unidirectional flow (Fig. 5c). At station 42, the 27.8-kg/m3 -isopycnal is doming upwards and the 27.95-kg/m3-isopycnal is dipping downwards, thus forming a lens of lower strat-ification as compared to the surrounding water. This den-sity distribution is consistent with a subsurface anticyclonic geostrophic motion. Such structures were described, among others, in the North Atlantic, where Mediterranean water out-flow forms anticyclonic rotating lenses, so-called “Meddies”. Consequently, the rotational character of the flow appears in the distribution of the baroclinic flow in Fig. 12 with a change of direction. Moreover, the θ − S pattern of the lens
(station 42) is different from that of the interleaving layers, which are present on each side of station 42 (Fig. 13a). An isolated anomalous feature is able to move through a water volume that has a coherent interleaving pattern without de-stroying this pattern, while a continuous westward recircula-tion branch should be an integral part of the layering struc-tures, having the same interleaving pattern. The tempera-ture maximum in the 400 to 500 m depth range at station 54 (Fig. 13b) in the Amundsen Basin is geographically even farther removed from the Fram Strait branch in the Nansen Basin. Again, the density structure is that of a baroclinic sub-surface eddy.
The presence of eddy-like features containing the Fram Strait water suggests instability of this branch of Atlantic wa-ter. Schauer et al. (1997) have shown that downstream of the confluence of FSBW and BSBW, the boundary current can be baroclinically unstable and shed off eddies. FSBW is flowing as a boundary current at the slope north of the Barents Sea. Yet north of the Kara Sea, it is pushed off the slope by the inflow of the Barents Sea branch, as is visible in a sequence of cross-slope sections along the Nansen Basin (Fig. 14). This might provide an additional destabilizing ef-fect for the FSBW. North of the Laptev Sea, the warm core has moved off the slope and topographic steering no longer constrains the flow to a narrow boundary current. Thus, east of the confluence region, only that part of the FSBW which has been mixed into the Barents Sea branch remains in the boundary current at the slope; the rest might evolve into ed-dies and lenses. The confluence of parts of the BSBW and FSBW at the same depths was at least the case in the early nineties. However, varying water mass properties of the two branches might change that distribution, leading to a more vertical separation if the BSBW is denser and/or the FSBW is lighter than observed here. If the BSBW would be much denser, then its main part might sink below the FSBW and a larger part of the FSBW could stay at the slope and continue towards the Canadian Basin.
In the Amundsen Basin, a warm, saline water mass (θ be-tween −0.7 and −0.6◦C, S > 34.93) having an oxygen min-imum was observed at depths between 1500 m and 2600 m at station 51 (Fig. 5d). Its characteristics are close to those of the Canadian Basin Deep water (Fig. 13). Weaker salin-ity maxima were observed in the same depth range further to the west in the Amundsen Basin in 1991 by Jones et al. (1995). They found the greatest salinity maximum just north of Greenland. It was interpreted as evidence of the boundary current re-crossing the Lomonosov Ridge from the Canadian Basin, possibly through a deep gap between the Lomonosov Ridge and the Ellesmere Island shelf. According to Perry and Fleming (1986) and to the International Bathy-metric Chart of the Arctic Ocean (IBCAO) (Jacobsson et al., 2000), a gap in the Lomonosov Ridge, deeper than 2400 m, is situated away from the slope, at about 88◦300N, 150◦E. The presence of waters with Canadian Basin deep water charac-teristics in the Amundsen Basin at only one station (51) in 1996 suggests that it has moved as an isolated water body with the dynamics of an eddy, across the Eurasian Basin.
1.00 1.50 1.00 0.50 -1.50 -1.70 1.50 -1.70 -8 2 -8 1 -8 0 -7 9 -7 8 -7 7 -7 6 -7 5 -7 4 -7 3 500 250 0 Pressure (dbar) 4000 3000 2000 1000 -0.90 -0.50 0.00 0.50 0 100 200 Distance (km) Q a) 34.94 34.93 34.92 34.90 34.92 0 100 200 Distance (km) 34.88 34.80 34.50 34.00 33.50 32.50 -8 2 -8 1 -8 0 -7 9 -7 8 -7 7 -7 6 -7 5 -7 4 -7 3 500 250 0 Pressure (dbar) 4000 3000 2000 1000 S b) f) 83°N 83°N 305.00 305.00 310.00 340.00 360.00 305.00 -8 2 -8 1 -8 0 -7 9 -7 8 -7 7 -7 6 -7 5 -7 4 -7 3 500 250 0 Pressure (dbar) 310 360 298 310 4000 3000 2000 1000 c) 300.00 305.00 290.00 0 100 200 Distance (km) Oxyg 298 380 -0.50 0.00 -0.50 0.00 0 100 200 300 Distance (km) 1.00 0.00 -1.70 1.00 -8 7 -8 6 -85 -84 -88 -89 -90 -91 -92 -93 -94 -95 -96 -97 500 250 0 Pressure (dbar) Q 3000 4000 2000 1000
no
data
1.50 0.50 -1.50 d) 150°E 81°N 0 100 200 300 Distance (km) 34.80 34.00 34.88 -8 7 -8 6 -8 5 -8 4 -8 8 -8 9 -9 0 -9 1 -9 2 -9 3 -9 4 -9 5 -9 6 -9 7 500 250 0 Pressure (dbar) 3000 4000 2000 1000 S e) 150°E 81°N 150°E 81°Nno
data
34.90 34.88 34.85 34.50 33.50 4000 3000 2000 1000 300.00 0 100 200 300 Distance (km) 320.00 305.00 305.00 -8 7 -8 6 -8 5 -8 4 -8 8 -8 9 -9 0 -9 1 -9 2 -9 3 -9 4 -9 5 -9 6 -9 7 500 250 0 Pressure (dbar)no
data
340.00 305.00 290 < > > < Oxyg 1.00 0.50 -1.50 -9 9 -100 - -102 -103 -104 -105 - -107 500 250 0 Pressure (dbar) 3000 4000 2000 1000 g) -0.80 0.00 0 100 Distance (km) Q 34.85 34.50 33.50 34.88 -9 9 -100 - -102 -103 -104 -105 - -107 500 250 0 Pressure (dbar) 3000 4000 2000 1000 h) 34.92 34.90 0 100 Distance (km) S 130°EFig. 10. Vertical distribution of potential temperature (a, d, g), salinity (b, e, h), and oxygen content (c, f) across the Lomonosov Ridge at
28.00 34.7 34.8 34.9 35.0 Salinity -1 0 1 2 Temperature (degC) 83N 81N 86N continental slope
Fig. 11. Potential temperature vs. salinity in the Makarov Basin at
different latitudes.
The density structure of this feature is consistent with an an-ticyclonic rotation with a relative velocity maximum at about 1800 m (Fig. 5c).
On the neighbouring station in the Amundsen Basin (sta-tion 52), a cold lens of low salinity water with a weak oxygen maximum was observed around a depth of 1000 m (Figs. 5 and 13). Water with such extreme properties were not ob-served anywhere else along this section. It was even colder than the water of the Barents Sea branch at the continental slope, but similar characteristics were observed in the St. Anna Trough, and in 1995, water with similar θ − S prop-erties was found at the continental slope north of Severnaya Zemlya (Rudels et al., 1999). We suggest that the lens had spun off the Barents Sea branch soon after it entered the Nansen Basin. The cold lens at station 52 also showed in-versions, which were not present at the same depth at neigh-bouring stations. The inversions were in the same density range as deep inversions found in the Nansen Basin. This supports again the hypothesis that the deep inversions are formed from cross-frontal interactions between the Barents Sea branch water and the water column beneath the Fram Strait inflow core.
Documentation of eddies in the Central Arctic are rare and available so far only for the Canadian Basin (Newton et al., 1974; D’Asaro, 1988; Muench et al., 2000). High resolution numerical simulations show that eddies might spin off also from the Atlantic water boundary current north
of the Barents Sea (Wieslaw Maslowski, pers. comm.,
http://www.oc.nps.navy.mil/sbi/#Vertical_AW).
The observation of four isolated features on one section crossing the Eurasian Basin which originate from distinct, remote source areas (the Fram Strait water features near 200
and 500 m at stations 42 and 54, the cold water from the Barents Sea outflow near 1000 m at station 52, and the deep warm, saline water from the Canadian Basin at station 51) suggest that migrating eddies might contribute considerably to the slope-basin and the inter-basin exchange. Three of these features represent the strongest baroclinic signal on the section (Fig. 12).
4 Temporal changes
Expeditions in the nineties have reported substantial changes in the upper layers of the Arctic Ocean. In 1990, Quadfasel et al. (1991) observed increased temperatures in the Atlantic layer of the Eurasian Basin, and a similar trend was seen in the Makarov Basin in 1993 (Carmack et al., 1995), and at the Chukchi Cap and in the Amundsen Basin in 1994 (Swift et al., 1997). Furthermore, submarine cruises (SCICEX) (Mori-son et al., 1998; Steele and Boyd, 1998) and tracer analy-ses (Ekwurzel et al., 2001) revealed an eastward shift of the fresh surface water, resulting in a deep reaching saline sur-face layer in the Eurasian Basin. Observations during Po-larstern cruises ARK IX/4 in 1993 (Schauer et al., 1997) and ARK XI/1 in 1995 (Rudels et al., 2000a) showed high inter-mediate temperatures also in the eastern Eurasian Basin.
In the Amundsen Basin, basin-wide sections occupied in 1991 and 1996 cover the return flow from the Laptev Sea slope toward the Fram Strait over the entire water column. Since the 1991 section is located closer to the Fram Strait, there is no direct spatial overlap, but downstream changes in the return flow of the water below the surface layer are ex-pected to be small since remote from the boundaries, there are no likely mechanisms to cause changes. If part of the Fram Strait branch were to enter the Amundsen Basin through eddy exchanges west of the 1996 section and return toward the Fram Strait, a synoptic survey would show higher temperatures in the western than in the eastern part of the basin. Instead, if the eastern Amundsen Basin were warmer than the western, this would indicate a warmer inflow to the Arctic Ocean, separating from the continental slope north of the Laptev Sea and replacing the existing colder Atlantic wa-ter.
As in the years before, in 1996, the temperature of the Fram Strait Atlantic layer and also its salinity (not shown here) were higher than in 1991 from the Nansen Basin across the Lomonosov Ridge and in the Makarov Basin (Fig. 15a). During the summer of 1994, Swift et al. (1997) noted mean temperatures of 1.5◦C west of the Lomonosov Ridge and
2◦C west of the Nansen Gakkel Ridge and concluded that the warm water had been advected from the Fram Strait within three years. Within some uncertainty due to lateral inho-mogeneity, the 1996 values at these locations were still that high. This is in agreement with the conclusion of Swift et al. (1997) that the warmer inflow through the Fram Strait continues almost simultaneously with the high NAO until 1995 (Dickson et al., 2000), looping through the Eurasian Basin and returning to the Fram Strait. A year later, in 1997,
0.00 0.00 0.00 0.00 0.00 0.00 0.00 0.00 -2.00 0.00 0.00 0.00 2.00 0.00 2.00 -2 9 -3 0 - - -33- -35 - -37 -38 -39 -40 -41 -42 -43 -44 -45 - -47 -48 -49 -50 -51 -52 -53 -54 -55 -56 -57 -58 -59 -60- -62 - -64 - -66 - -68 -69 -70- -72
4000
3000
2000
1000
0
Pressure
(dbar)
0
100
200
300
400
500
600
700
800
900
Distance (km)
Vel
Nansen B
Amundsen B
Lomo R
p
p
p
p
p
n
n
n
n
n
n
n
n
n
n
Fig. 12. Vertical distribution of the geostrophic velocity (cm/s) in the Nansen, Amundsen and Makarov Basins. The reference level is at the
bottom; p (positive) means flow into section (i.e. towards west in the Nansen Basin), n (negative) means flow out of the section. The isoline difference is 2 cm/s. 34.7 34.8 34.9 35.0 Salinity Temperature (degC) 1.0 0.0 3.0 -1.0 4.0 2.0 -2.0 43 41 42 27.75 28.00 a 27.75 28.00 34.7 34.8 34.9 35.0 Salinity Temperature (degC) 1.0 0.0 3.0 -1.0 4.0 2.0 -2.0 54 52 51 b
Fig. 13. Potential temperature vs. salinity (a) of stations 41, 42 and 43 in the Nansen Basin showing the anomaly of the water at station 42
and (b) of stations 51, 52 and 54 representing features of anomalous water in the Amundsen Basin.
Rudels et al. (2000b) identified water with the signature of the 1996 Nansen Basin and Nansen- Gakkel-Ridge FSBW in the northern Fram Strait.
In contrast to the temperature increase between 1991 and 1994 west of the Lomonosov Ridge, above and east of the Lomonosov Ridge, the temperatures were equally low in 1991 and in 1994 (Swift et al., 1997, their Fig. 2a), i.e. they did not undergo a temporal change. On the other hand,
in 1996, the temperatures were higher than the 1991 val-ues west, above, and east of the Lomonosov Ridge. This discrepancy could be due to spatial rather than to tempo-ral differences, i.e. Atlantic water can cross the Lomonosov Ridge towards the Makarov Basin at 86◦N, but not at 88◦N where Canadian Basin water was present east of the Lomonosov Ridge.
0 1 2 0 -1 2 -1 - - -4000 3000 2000 1000 0 Pressure (dbar) 0 100 Distance (km)
105°E
95°E
40°E
117°E
-1 1 0 0 1 -1 - - - -0 100 200 Distance (km) -1 1 0 0 100 200 Distance (km) 0 1 0 0 2 - - - --1 1 0 0 1 -1 - - - -0 100 Distance (km) 1 0 -1Figure 13
Fig. 14. Sequence of temperature sections along the continental slope of the Nansen Basin (at 40◦E and 125◦E from ARKIX-4 1993,
at 95◦E from ARKXII 1996 and at 105◦E from ARKXI- 1 1995). The light/dark shading means temperatures greater than 2◦C / 2.5◦C, respectively.
Basin and in the Makarov Basin, the temperature in 1996 was slightly above the 1991 values, but the salinity was lower in 1996 by up to 0.01 (Figs. 15b and 15d) in the core around 800 m. This layer was attributed earlier in the paper to the Barents Sea inflow, and the change in properties results in a slightly lower density of BSBW at a particular depth (e.g. 1σ = −0.01 kg/m3at 1000 m depth). A comparison of pro-files at the western flank of the Lomonosov Ridge (Oden sta-tion 20 and ARKXII stasta-tion 61, as an example, Figs. 15d and 15e) shows that the difference in water mass properties extends down to the depth where the potential temperature is −0.4◦C, 1200 m. Below that level, the water, which is warmer at a given depth, is a result of a downward shift of the water column. Consequently, the volume of the deep water layer in the Amundsen Basin must have reduced and the in-termediate layer, fed by the inflow from the Atlantic through the Fram Strait and/or through the Barents Sea, must have increased. This suggests that the inflow in the early nineties was not only warmer, but also greater in volume than the years before.
Almost the entire intermediate water column has become warmer, but the change is most pronounced in the upper layer dominated by the Fram Strait branch water and less in the lower part with the stronger Barents Sea contribution. The changes are consistent with the continuous entry of warmer Atlantic water into the Arctic Ocean in recent years. If both branches proceed with about equal speed (Frank et al., 1998), then the Atlantic water that flows through the Fram Strait obviously is cooled more slowly through surface heat loss and interaction with cold shelf water plumes than the At-lantic water entering through the Barents Sea, where it is
ex-posed to considerable surface cooling before it flows into the deep basin. The increased salinity in the warmer Fram Strait branch is consistent with the positive correlation between the temperature and salinity of the upper Norwegian Atlantic Current, as was measured over decades at Ocean Weather Ship M (Østerhus et al., 1996). The increased temperature of the Atlantic layer has been suggested to be a result of warmer source waters in the Norwegian Sea, which are, in turn, related to reduced winter cooling and correlated with positive anomalies of the North Atlantic Oscillation (NAO) (Swift et al., 1997). Presumably, the observed shift in in-termediate water properties is a change advected from the Nordic Seas. The decrease in salinity in the Barents Sea branch is possibly caused by the freshening of the Norwe-gian Coastal Current. During positive NAO anomalies, the precipitation over western Scandinavia increases (Dickson et al., 2000), leading to a higher continental run-off feeding the Norwegian Coastal current. Other possibilities include dy-namic changes in the advection of the water masses entering the Barents Sea, and/or systematic differences in the surface water mixing along the coast of Norway for years with a high NAO index.
5 Concluding remarks
Most of the Eurasian Basin waters are conditioned by the confluence of the boundary flow of the warm saline Fram Strait water (temperatures in 1996 were around 3◦C and salinities around 35) and cold, fresh water from the Barents Sea entering through the St. Anna Trough (temperatures be-low 0◦C and salinities between 34.7 and 34.9). Since the
0 100 200 300 400 500 600 700 800 900 Distance (km) -5000 0 W ater Depth (m) -0.7 -0.6 -0.5 -0.4 -0.3 Temperature (degC)
Temp 1000-1500 m +1991 ODEN1996 ARK XII
NGR Amundsen B Lomo R Temp 150-400 m 0 100 200 300 400 500 600 700 800 900 Distance (km) -5000 0 W ater Depth (m) -1 0 1 2 Temperature (degC)
+1996 ARK XII1991 ODEN
NGR Amundsen B Lomo R Salinity 0 100 200 300 400 500 600 700 800 900 Distance (km) -5000 0 W ater Depth (m) 34.85 34.90
+1996 ARK XII1991 ODEN
NGR Amundsen B Lomo R Sal 600-1000 m c) b) a) e) Temperature (degC) 28.00 34.90 Salinity -1.0 -0.75 -0.5 -0.25 0.0 34.85 34.95 1991 1996 2500 2000 1500 1000 500 Pressure (dbar) -1.0 -0.5 0.0 0.5 1.0 1.5 2.0 2.5 3.0 Temperature (degC) 34.3 34.4 34.5 34.6 34.7 34.8 34.9 Salinity 1991 1996
Pot Temp Sal
d)
Fig. 15. Cross-basin distribution of
vertically averaged values from the Nansen Gakkel Ridge (NGR) through the Amundsen Basin and over the Lomonosov Ridge (Lomo R) into the Makarov Basin along a section oc-cupied by Oden in 1991 and during ARKXII in 1996 (Fig. 1 for location):
(a) temperature of the Fram Strait
At-lantic layer (150–400 m), (b) salinity of the core of the Barents Sea layer (600– 1000 m), (c) temperature between 1000 and 1500 m. At the bottom of each panel, the bottom topography along the two sections is given (Oden 1991: dot-ted line, ARK XII 1996: solid line).
(d) Vertical profiles of potential
tem-perature and salinity and (e) potential temperature vs. salinity at two stations at the western flank of the Lomonosov Ridge, noted by an arrow in (c).
Fram Strait branch splits at the western St. Anna Trough, with part of it entering the trough and leaving it much colder and less saline, the dominance of the Fram Strait water in the Eurasian Basin is reduced (Fig. 16). At the confluence, the FSBW part which had not entered the St. Anna Trough and the BSBW form a sharp front. The FSBW is displaced from the upper to the lower continental slope which might have consequences for its dynamic stability. Apart from the boundary current north of the Kara Sea, the purest FSBW appeared in isolated patches which, according to their
den-sity structure, can be addressed as anticyclonic eddies. In addition, one lens of pure BSBW water was found in the Amundsen Basin. Here, no clear eddy-like structure could be identified in the density distribution. The possibility for the boundary current to become baroclinically unstable has been shown earlier (Schauer et al., 1997) and these features might be manifestations of such instability. Fast recircula-tion of the FSBW along the Nansen Gakkel Ridge is not sup-ported by our data since there, the coldest FSBW with a long residence time of the order of a decade was found.
Recir--150º -120º -90º -60º -30º 0º 30º 60º 90º 120º 150º 180º 75º 80º 85º Barents Sea Kara Sea Novaya Zemlya St.Anna Trough Nansen Basin Amundsen Basin Greenland Sea Greenland Siberia FranzJosef Land Makarov Basin Svalbard East Siberian Sea Nansen-Gakkel Ridge Laptev Sea Severnaya Zemlya Fram Strait VoroninT rough Vilkit skij Strait 500 1500 2500 3000 3000 3000
X
X
Lomonosov RidgeFig. 16. Distribution of intermediate water masses in the eastern Eurasian Arctic. Solid line arrows display the flow of the Fram Strait branch
of Atlantic water, the Barents Sea branch, and, east of the confluence and mixing area, the flow of the mixture of both. The grey filled circles denote eddy-like structures with water originating from the Makarov Basin, the Fram Strait branch and the Barents Sea branch. The dashed arrows do not show pathways, but rather connect the anomalous water parcels with their area of origin. The light grey shading shows the region dominated by the mixed water type. The heavy line arrow in the Makarov Basin denotes the flow of Upper Polar Deep water (Rudels et al., 1994). Crosses denote the position of elevations of the Lomonosov Ridge of less than 1000 m in water depth (Perry and Fleming, 1986), possibly steering the cross-ridge flow of intermediate water.
culation of the FSBW probably occurs rather in the Nansen Basin itself, since Rudels et al. (2000a) estimated that it takes two years time for the advection from the eastern part of the Nansen Basin to the Fram Strait. The cold water below a deep mixed layer at the Nansen Gakkel Ridge indicates that the Fram Strait Atlantic water found there was not covered with a halocline for about a decade.
A mixture of BSBW and FSBW returns along the Eurasian side of the Lomonosov Ridge, obviously observed from the slightly elevated temperature, salinity and oxygen values as compared to the interior basin. No clear front between the Eurasian and Canadian intermediate waters, such as that ob-served further north in 1991 and 1994 (Swift et al., 1997),
was found at the Lomonosov Ridge between the Laptev Sea and 86◦N. We conclude that the Eurasian Basin water pos-sibly flows around seamounts on the ridge to the Makarov Basin (Fig. 16), in addition to its flow along the continen-tal slope. On the other hand, Canadian Basin deep wa-ter crossed the ridge at a deep passage and migrated in the Eurasian Basin as an anticyclonic eddy extending down to more than 2500 m.
The presence of interleaving structures which possibly have evolved through double diffusive fluxes and which are coherent over wide distances is consistent with low lateral shear across the Eurasian Basin. The horizontal tempera-ture and salinity gradients from the southern Nansen Basin
toward the Nansen-Gakkel Ridge and the interleaving lay-ers show that the BSBW is present there as well and is advected together with the FSBW toward the Fram Strait within the Nansen Basin. This, together with the pres-ence of the detached patches from the boundary flow and the crossing of the Eurasian Basin water at topographic features along the Lomonosov Ridge, indicates that the flow within the Eurasian Basin is more complex than a straight return flow of the two branches organized along the ridges (Rudels et al., 1994).
The temperature and salinity changes between 1991, 1994 and 1996 are consistent with a warmer Fram Strait Atlantic inflow. A greater vertical separation between the Fram Strait branch and the Barents Sea branch at the confluence, proba-bly resulting from the Fram Strait inflow being warmer and thus less dense, would allow for a larger fraction of little-diluted Fram Strait branch water to remain at the slope and to pass into the Makarov Basin, thus resulting in a warmer At-lantic layer there. The lack of comparable data from the Bar-ents Sea inflow to the Arctic Ocean leaves unanswered the question of which branch is most important for the change observed in the Canadian Basin (McLaughlin et al., 1996). It is possible that due to the strong heat loss to the atmo-sphere occurring in the Barents Sea, the temporal variabil-ity in the temperature of the Barents Sea branch is reduced and is thus much smaller than the variability in temperature of the Fram Strait branch. The inflow from the St. Anna Trough would then sink primarily below the warm core of the boundary current. However, the salinity variation coun-teracts the density difference that drives the vertical separa-tion of the two branches. A larger fresh water content in the Barents Sea branch, possibly a result of higher precipita-tion in northern Europe (Gerdes and K¨oberle, 1999), was ob-served in 1996 along with higher salinities in the Fram Strait branch. Both variations (higher precipitation and higher tem-peratures, combined with higher salinities in the Atlantic wa-ter at Ocean Weather Ship M) are observed during periods of a high NAO index (Dickson et al., 2000). However, even a warmer Fram Strait branch component in the mixed water boundary current that continues towards the Makarov Basin would increase the temperature there.
Acknowledgement. We wish to acknowledge support from the Canadian Panel on Energy Research and Development (EPJ) and from the Swedish Council for natural research (NFR). Participation of R.D. Muench in this analysis was funded through ONR grants N00014–95–1-1294 and N00014–96- 1–0855 to Earth & Space Re-search. We thank one anonymous reviewer for his valuable com-ments. This is AWI-contribution number 1532.
Topical Editor N. Pinardi thanks two referees for their help in evaluating this paper.
References
Aagaard K.: On the deep circulation in the Arctic Ocean, Deep-Sea Research, 28, 251–268, 1981.
Aagaard, K.: A synthesis of the Arctic Ocean circulation, Rap-ports et Proc`es-verbeaux des R´eunions, Conseil International pour l‘Exploration de la Mer, 188, 11–22, 1989.
Aagaard, K., Swift, J. H., and Carmack, E. C.: Thermohaline cir-culation in the Arctic Mediterranean Seas, J. Geophys. Res., 90, 4833–4846, 1985.
Anderson, L. G., Bj¨ork, G., Holby, O., Kattner, G., Koltermann, P. K., Jones, E. P., Liljeblad, B., Lindegren, R., Rudels, B., and Swift, J.: Water Masses and Circulation in the Eurasian Basin: Results from the Oden 91 North Pole Expedition, J. Geophys. Res., 99, 3273–3283, 1994.
Anderson, L. G., Jones, E. P., and Rudels, B.: Ventilation of the Arc-tic Ocean estimated by a plume entrainment model constrained by CFCs. J. Geophys. Res., 104, 13 423–13 429, 1999.
Blindheim, J.: Cascading of Barents Sea bottom water into the Nor-wegian Sea, Rapp. P.-v. Reun. Cons. int. Explor. Mer, 188, 49– 58, 1989.
Carmack, E. C., Macdonald, R. W., Perkin, R. G., McLaughlin, F. A., and Pearson, R.: Evidence for warming of Atlantic wa-ter in the southern Canadian Basin of the Arctic Ocean: Re-sults from the Larsen-93 Expedition, Geophys. Res. Let., 22 (9), 1061–1064, 1995.
D’Asaro, E. A.: Observation of small eddies in the Beaufort Sea, J. Geophys. Res., 93, 6669–6684, 1988.
Dickson, R. R., Osborn, T. J., Hurrell, J. W., Meincke, J., Blind-heim, J., Adlandsvik, B., Vinje, T., Alekseev, G., Maslowski, W. and Cattle, H.: The Arctic Ocean Response to the North Atlantic Oscillation, Journal of Climate, 13(15), 2671–2696, 2000. Ekwurzel, B., Schlosser, P., Swift, J. H., Mortlock, R. A., and
Fair-banks, R. G.: River runoff, sea ice meltwater, and Pacific wa-ter distribution and mean residence times in the Arctic Ocean, J. Geophys. Res., 106, 9075–9092, 2001.
Environmental Working Group (EWG): Joint U.S.-Russian Atlas of the Arctic Ocean (CD-ROM), Natl. Snow and Ice Data Center, Boulder, Co., USA, 1997.
Frank, M., Smethie, W. M., and Bayer, R.: Investigation of sub-surface water flow along the continental margin of the Eurasian Basin using the transient tracers tritium, 13-He, and CFCs. Jour-nal of Geophysical Research, 103(C13), 30 773–30 792, 1998. Gerdes, R. and K¨oberle, C.: Numerical simulation of salinity
anomaly propagation in the Nordic Seas and the Arctic Ocean, Polar Research, 18, 159–166, 1999.
Hanzlick, D. and Aagaard, K.: Freshwater and Atlantic Water in the Kara Sea, J. Geophys. Res., 85, 4937–4942, 1980.
Jakobsson, M., Cherkis, N. Z., Woodward, J., Macnab, R., and Coakley, B.: New grid of Arctic bathymetry aids scientists and mapmakers; Eos, Transactions, AGU, 81, 9, 29 February 2000, International Bathymetric Chart of the Arctic Ocean (IBCAO), http://www.ngdc.noaa.gov/mgg/bathymetry/arctic.html, 2000. Jones E. P., Rudels, B., and Anderson, L. G.: Deep Waters of the
Arctic Ocean: origins and circulation, Deep-Sea Research, 42, 737–760, 1995.
Loeng., H., Ozhigin, V., Adlandsvik, B., and Sagen, H.: Current measurements in the north-eastern Barents Sea, ICES C. M., C: 40, 22, 1993.
Martin, S. and Cavalieri, D. J.: Contributions of the Siberian shelf polynyas to the Arctic Ocean Intermediate and Deep Water, J. Geophys. Res., 94, 12 725–12 738, 1989.
McLaughlin, F. A., Carmack, E. C., Macdonald, R. W., and Bishop, J. K. B.: Physical and geochemical properties across the At-lantic/Pacific water mass front in the southern Canadian Basin, J. Geophys. Res., 101, 1183–1197, 1996.
Midttun, L.: Formation of dense bottom water in the Barents Sea, Deep-Sea Research, Part A, 32, 1233–1241, 1985.
Morison, J., Steele, M., and Andersen, R.: Hydrography of the up-per Arctic Ocean measured from the nuclear submarine U.S.S. Pargo, Deep Sea Research I, 45(1), 15–38, 1998.
Muench R. D., Gunn, J. T., Whitledge, T. E., Schlosser, P., and Smethie, W.: An Arctic Ocean cold core eddy, J. Geophys. Res., 105, 23 997–24 006, 2000.
Newton, J. L, Aagaard, K., and Coachman, L. K.: Baroclinic eddies in the Arctic Ocean, Deep-Sea Research, 21, 707–719, 1974. Østerhus, S., Gammelsrød, T., and Hogstad, R.: Ocean Weather
Ship Station M (66 N, 2 E): The longest Homogeneous Time Se-ries from the Deep Ocean, International WOCE Newsletter, 24, 31–33, 1996.
Perry, A. K. and Fleming, H. S.: Bathymetry of the Arctic Ocean, scale 1:4,704,075 at 78–80 N, Geol. Soc. of America, Boulder, Colourado, 1986.
Quadfasel, D., Sy, A., Wells, D., and Tunik, A.: Warming in the Arctic, Nature, 350, 385, 1991.
Quadfasel, D., Rudels, B., and Selchow, S.: The Central Bank vor-tex in the Barents Sea: Water mass transformation and circula-tion, ICES Mar. Sci. Symp., 195, 40–51, 1992.
Rudels, B., Jones, E. P., Anderson, L. G., and Kattner, G.: On the Intermediate Depth Waters of the Arctic Ocean, in: The Polar Ocean and their Role in Shaping the Global Environment, (Eds) Johannessen, O. M., Muench, R. D., and Overland, J. E., AGU, Washington, 85, 33–46, 1994.
Rudels, B., Anderson, L. G., and Jones, E. P.: Formation and evolu-tion of the surface mixed layer and halocline of the Arctic Ocean, J. Geophys. Res., 101, 8807–8821, 1996.
Rudels, B., Bj¨ork, G., Muench, R. D., and Schauer, U.: Double-Diffusive Layering in the Eurasian Basin of the Arctic Ocean., J. Marine Systems, 21, 3–27, 1999.
Rudels, B., Muench, R. D., Gunn, J., and Schauer, U.: The Arctic Ocean north of the Siberian shelves: Advection, lateral mixing, slope convection and intermediate and deep water characteristics. J. Marine Systems, 25, 77–99, 2000a.
Rudels, B., Meyer, R., Fahrbach, E., Ivanov, V., Østerhus, S., Quad-fasel, D., Schauer, U., Tverberg, V., and Woodgate, R. A.: Water Mass Distribution in Fram Strait and over the Yermak Plateau in Summer 1997, Ann. Geophysicae, 18, 687–705, 2000b. Schauer, U., Muench, R. D., Rudels, B. and Timokhov, L.: The
Impact of Eastern Arctic Shelf Waters on the Nansen Basin In-termediate Layers, J. Geophys. Res. 102, 3371–3382, 1997. Schauer, U. and Fahrbach, E.: A dense bottom water plume in the
western Barents Sea: Downstream modification and interannual variability, Deep-Sea Research, 46, 2095–2108, 1999.
Steele, M. and Boyd, T.: Retreat of the cold halocline in the Arctic Ocean, J. Geophys. Res., 103, 10 419–10 435, 1998.
Swift, J. H., Jones, E. P., Aagaard, K., Carmack, E. C., Hingston, M., Macdonald, R. W., McLaughlin, F. A., and Perkin, R. G.: Waters of the Makarov and Canada Basins, Deep-Sea Research II, 44, 1503–1529, 1997.
Woodgate, R., Aagaard, K., Muench, R. D., Gunn, J., Bj¨ork, G., Rudels, B., Roach, A. T., and Schauer, U.: The Arctic Ocean Boundary Current along the Eurasian slope and the adjacent Lomonosov Ridge: Water mass properties, transports and trans-formations from moored instruments, Deep-Sea Research I, 48 1757–1792, 2000.