HAL Id: hal-00304600
https://hal.archives-ouvertes.fr/hal-00304600
Submitted on 1 Jan 2001HAL is a multi-disciplinary open access
archive for the deposit and dissemination of sci-entific research documents, whether they are pub-lished or not. The documents may come from teaching and research institutions in France or abroad, or from public or private research centers.
L’archive ouverte pluridisciplinaire HAL, est destinée au dépôt et à la diffusion de documents scientifiques de niveau recherche, publiés ou non, émanant des établissements d’enseignement et de recherche français ou étrangers, des laboratoires publics ou privés.
Atlantic ocean temperatures
R. L. Wilby
To cite this version:
R. L. Wilby. Downscaling summer rainfall in the UK from North Atlantic ocean temperatures. Hy-drology and Earth System Sciences Discussions, European Geosciences Union, 2001, 5 (2), pp.245-257. �hal-00304600�
Downscaling summer rainfall in the UK from North Atlantic ocean
temperatures
R.L.Wilby
Department of Geography, King’s College London, Strand, London, WC2R 2LS, UK Email: rob.wilby@kcl.ac.uk
Abstract
Annual series of three stochastic rainfall model parameters — the seasonal wet day amount (or intensity), the conditional dry–day probability (or dry–spell persistence), and the conditional wet-day probability (or wet-spell persistence) — were examined using daily rainfall records for ten UK stations for the period 1901–1995. The purpose was first, to determine the extent to which these indices of summer (June–August) rainfall were correlated with empirical orthogonal functions (EOFs) of summer North Atlantic sea surface temperature (SST) anomalies: second, to evaluate the skill of EOFs of preceding winter (December–February) SSTs for summer rainfall forecasting and downscaling. Correlation analyses suggest that observed increases in summer dry-spell persistence since the 1970s coincided with positive SST anomalies in the North Atlantic. In contrast, wet-spell persistence and intensities were relatively weakly correlated with the same patterns, implying that the use of SSTs is justifiable for conditioning occurrence but not intensity parameters. Furthermore, the correlation strengths were greater for EOFs of SSTs than those reported for area-average SST anomalies, indicating that the pattern of SST anomalies conveys important information about seasonal rainfall anomalies across the UK. When EOFs of winter SSTs were used to forecast summer rainfall in Cambridge, the skill was once again greater for dry-spells than either wet-spells or intensities. However, even for dry–spells, the correlation with observations — whilst statistically significant — was still rather modest (r<0.4). Nonetheless, the results are comparable to previous investigations of summer rainfall across Europe, and suggest that forecasting skill (across the UK) originates from the predictability of the rainfall occurrence process.
Key words: North Atlantic, ocean temperatures, downscaling, rainfall, forecasting, UK
Introduction
Statistical downscaling is analagous to the “model output statistics” (MOS) and “perfect prog” approaches used for short-range numerical weather prediction (Klein and Glahn, 1974). All three applications use empirical relationships between climate variables at large spatial (or temporal) scales to simulate weather at smaller scales, given gridded predictor variables. Such techniques have been implemented widely within the climate change impacts community to generate high resolution climate series from the output of General Circulation Models (see the reviews of Giorgi and Mearns, 1991; Wilby and Wigley, 1997). It is evident that large-scale weather indices can also be downscaled for seasonal forecasting of hydrometeorological variables at station and river catchment scales (Clark et al., 2001; Wilby, 2001).
However, it is recognised that statistical downscaling models, conditioned only by sequences of daily atmospheric circulation patterns, seldom fully characterise low-frequency
behaviour in precipitation records. This deficiency applies more generally to weather generator models and has been discussed at length elsewhere (e.g. Buishand, 1978; Gregory
et al., 1993; Katz and Parlange, 1998; Wilks, 1989, 1999;
Wilks and Wilby, 1999). Perhaps the most appealing explanation for the ‘missing variance’ is that observed rainfall statistics vary over decadal time-scales, and that conventional statistical models — employing parameters that change only through fixed seasonal or annual cycles — are not sufficiently complex to capture such variability. This assertion is supported by studies in which unconditional weather models have been compared with models that use mixtures of slowly and rapidly varying predictor variables. For example, Katz and Parlange (1993, 1996) used a two-state index of monthly mean sea level pressure to condition daily rainfall parameters for sites in California and found that the conditional model reduced the over-dispersion of monthly precipitation that was evident in the output of an unconditional model. Kiely et al. (1998) applied a similar
approach to condition the occurrence and intensity parameters of a daily precipitation model for Valentia, Ireland and acquired improved estimates of the standard deviation of monthly precipitation. Wilby (1998) obtained modest improvements in monthly precipitation statistics for sites in central and eastern England using the North Atlantic Oscillation (NAO) index and sea surface temperature (SST) anomalies linearly to condition the seasonal parameters of a stochastic rainfall model.
Such results suggest that the realism of statistical rainfall models may be enhanced using mixtures of stochastic processes. In this respect, SST anomalies are potentially useful conditioning variables because a significant component of inter-annual (and inter-decadal) regional climate variability is due to ocean-atmosphere coupling (e.g. Cayan et al., 1998; Dai et al., 1998; Fraedrich and Muller, 1992; Gershunov and Barnett, 1998; Wilby, 1993). As well as describing historic variations in atmospheric circulation patterns, regional rainfall and temperature, SSTs have also been used for seasonal weather prediction. For example, knowledge of North Atlantic SST anomaly patterns in winter can be used to make forecasts of subsequent summer weather across Europe (e.g. Barnston, 1994; Colman, 1997; Colman and Davey, 1999; Johansson et al., 1998). By using SSTs as one of the inputs to an expert system-based approach, it may be possible even to offer climatic forecasts (or outlooks) one to several years in advance (Rodionov and Martin, 1999).
In the present study, the annual series of three stochastic rainfall model parameters (the seasonal wet day amount or intensity, µ, the conditional dry–day probability, pdd, and the conditional wet–day probability, pww) are examined for multiple stations in the UK. Each parameter was derived
from 92 days of daily rainfall in summer (June–August) for each year since 1901. This analysis was made firstly to determine the extent to which the three parameters correlate with summer North Atlantic SST anomalies because of concerns about marked changes in the spatial and temporal character of summer rainfall across the British Isles since the 1970s, with concomitant water resource impacts (Conway, 1998; Jones and Conway, 1997; Marsh and Turton, 1996; Mayes, 1996, 1998). Secondly, it was done to evaluate the skill of summer rainfall forecasts derived from statistical downscaling models that use preceding winter (December–February) SSTs. This work complements previous investigations of seasonal forecasting of rainfall at regional and national scales (Colman and Davey, 1999), and provides further insight into the predictability of summer rainfall anomalies across the UK. As in previous work, it is assumed that large-scale predictor(s) reproduce the spatial dependency of precipitation amongst neighbouring sites (e.g. Hughes and Guttorp, 1994).
Data and methods
Two data sets were used to investigate the relationship between eigenvectors of North Atlantic SST anomalies and summer rainfall parameters during the period 1901–1995.
DAILY RAINFALL
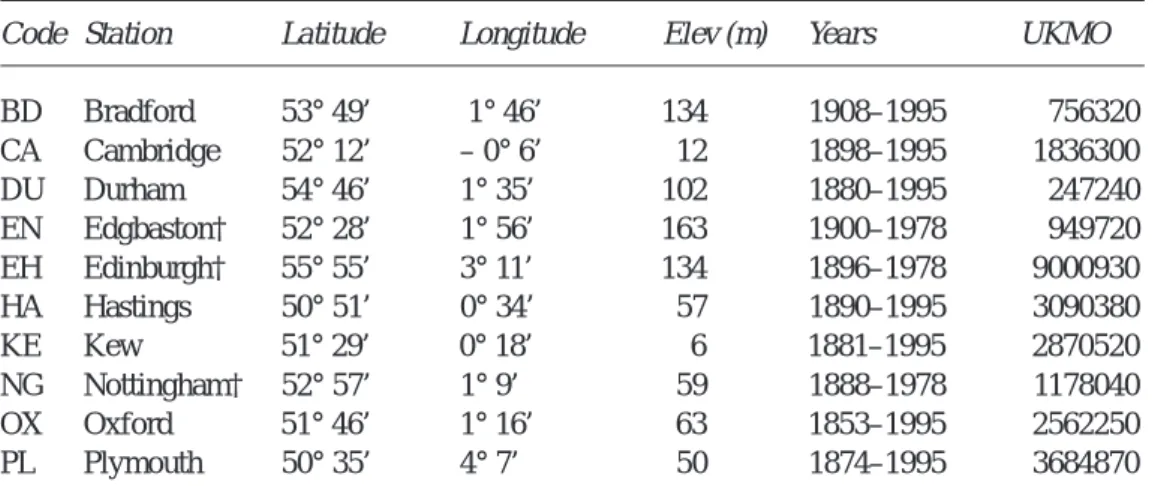
Data were obtained for ten UK Meteorological Office stations (see Table 1 and Fig. 1), selected on the basis of their longevity and geographic coverage of central, southern and eastern England/Scotland. These regions were chosen because they were most severely impacted by recent summer
Table 1. Daily rainfall records
Code Station Latitude Longitude Elev (m) Years UKMO
BD Bradford 53° 49’ 1° 46’ 134 1908–1995 756320 CA Cambridge 52° 12’ – 0° 6’ 12 1898–1995 1836300 DU Durham 54° 46’ 1° 35’ 102 1880–1995 247240 EN Edgbaston† 52° 28’ 1° 56’ 163 1900–1978 949720 EH Edinburgh† 55° 55’ 3° 11’ 134 1896–1978 9000930 HA Hastings 50° 51’ 0° 34’ 57 1890–1995 3090380 KE Kew 51° 29’ 0° 18’ 6 1881–1995 2870520 NG Nottingham† 52° 57’ 1° 9’ 59 1888–1978 1178040 OX Oxford 51° 46’ 1° 16’ 63 1853–1995 2562250 PL Plymouth 50° 35’ 4° 7’ 50 1874–1995 3684870
droughts (Marsh and Turton, 1996). To remove the effect of “trace” rainfall amounts on parameter estimates, all days with precipitation totals less than or equal to 0.3 mm were treated as “dry” days. Two conditional rainfall probabilities were computed for each summer season in the period 1901– 1995, resulting in a pair of sequences 95-values long at each site. Both probability statistics were calculated for the period June to August (i.e. from a sample of 92 days every year).
The conditional dry-day probability, pdd, given by
pdd = Pr {no precipitation on day t | no precipitation on
day t–1} (1a)
and the conditional wet–day probability, pww, by
pww = Pr {precipitation on day t | precipitation on day t–
1}, (1b)
describe the general tendency for wet- and dry-days to cluster, and assume geometric distributions of spell lengths. The two parameters underpin conventional Markov models of the rainfall occurrence process and are used initially as indices of summer dry-/wet-spell persistence since 1901.
In addition, one rainfall intensity parameter was derived for each summer season at each station for 1901–1995. The simplest reasonable model for daily precipitation amounts is the exponential distribution (Richardson, 1981), whose probability density function is:
f(x) = 1/µ exp [–x/µ] (2)
and requires specification of only one parameter, µ, the average non-zero precipitation amount. Despite its simplicity, the distribution reproduces qualitatively the strong positive skewness exhibited by daily precipitation data, with variance σ2 = µ2.
Several of the stations have been used previously to investigate long-term rainfall variations across the British Isles (as in Wigley and Jones, 1987; Gregory et al., 1991; Jones and Conway, 1997). However, to produce continuous series, it was necessary to homogenise data at three sites (EN, EH and NG) by overlapping records from “old” and “new” station locations. The homogenisation was accomplished by computing the three parameters (µ, pdd and
pww) at both stations, next regressing equivalent pairs of parameters and, finally, interpolating missing parameters at the original sites. Table 2 provides details of the stations used to homogenise the rainfall series, the amount of explained variance and the standard error of the bridging equations. Clearly the regression procedure does not preserve all of the variance in the series on a year to year basis, but decadal scale variability in the reconstructed parameters was considered adequate for the detection of decadal scale forcing.
SEA SURFACE TEMPERATURES
Gridded (4° latitude by 4° longitude) monthly sea surface temperatures for the North Atlantic sector (40°N–65°N and 40°W–10°E) were extracted from the corrected GISST2.3 (Global Sea Ice and Sea Surface Temperature) data set (Folland and Parker, 1995). Seasonal anomalies were computed relative to the 1901–1995 climatology to maintain consistency with the precipitation series (see above). The chosen domain approximates that employed by Colman (1997) to forecast July–August Central England Temperatures, but it is acknowledged that further work is needed to verify the optimal size, shape and location of the domain with respect to the explanation of target variables
(see Braud et al., 1993). Separate sets of empirical orthogonal functions (EOFs) were computed for winter (December–February) and summer (June–August) using annual series of gridded SST anomalies for each season.
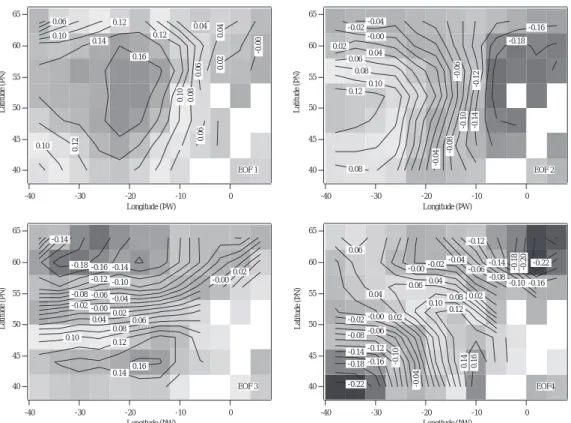
The four leading EOFs of the winter (Fig. 2) and summer (Fig. 3) SSTs explain the majority of the variance (79% and 82% respectively). EOF1 explains 32% of the total variance in winter and 34% in summer, and is associated with positive loadings throughout the domain in both seasons. EOF2 explains 24% of the total variance in winter and 20% in summer. This pattern is characterised by positive loadings in the western Atlantic and negative loadings to the north and east. EOF3 is most strongly correlated with the NAO time series based on the normalised difference in mean sea level pressure between Stykisholmur in Iceland and Lisbon, Portugal (Hurrell, 1995). The correlation between EOF3 and the NAO index (1901–1995) was slightly stronger in winter (r = –0.41) than in summer (r = –0.37). Finally, the loadings of EOF4 display a tripole pattern with positive loads to the south and west of the European seaboard and strong negative loads in the mid Atlantic and off the coast of Scandinavia.
North Atlantic forcing of summer
rainfall
Figures 4, 5 and 6 show the 30-year moving averages of summer pdd, pww and µ parameters respectively at each station. The expected variability (standard error) due to sampling is also shown with respect to corresponding long-term means. Parameter values lying outside shaded regions were not, therefore, considered representative of the long-term mean, or attributable to sampling effects. Rather, the
Table 2. Details of regression equations used to homogenise daily precipitation records
at Edgbaston (EN), Edinburgh (EH) and Nottingham (NG)
Code UKMO Years Parameter Gradient Intercept r2 (%) SE
EN 968930 1960–1995 pdd 0.857 +0.097 84 0.031 pww 0.418 +0.328 30 0.057 µ 0.844 +1.037 52 0.967 EH 8994310 1959–1995 pdd 0.751 +0.183 57 0.049 pww 0.809 +0.103 69 0.047 µ 1.095 –0.144 76 0.685 NG 1176260 1960–1993 pdd 0.733 +0.216 76 0.035 pww 0.996 –0.033 49 0.076 µ 0.702 +1.506 58 0.931
65 60 55 50 45 40 Latitude (ÞN) -40 -30 -20 -10 0 Longitude (ÞW) 0.16 0.14 0.12 0.12 0.12 0.10 0.10 0.10 0.08 0.06 0.06 0.06 0.04 0.04 0.02 -0.00 EOF 1 65 60 55 50 45 40 Latitude (ÞN) -40 -30 -20 -10 0 Longitude (ÞW) 0.12 0.10 0.08 0.08 0.06 0.04 0.02 -0.00 -0.02 -0.04 -0.04 -0.06 -0.08 -0.10 -0.12 -0.14 -0.16 -0.18 EOF 2 65 60 55 50 45 40 Latitude (ÞN) -40 -30 -20 -10 0 Longitude (ÞW) 0.16 0.14 0.12 0.10 0.08 0.06 0.04 0.02 0.02 -0.00 -0.00 -0.02 -0.04 -0.06 -0.08 -0.10 -0.12 -0.14 -0.14 -0.16 -0.18 EOF 3 65 60 55 50 45 40 Latitude (ÞN) -40 -30 -20 -10 0 Longitude (ÞW) 0.16 0.14 0.12 0.10 0.08 0.06 0.06 0.04 0.04 0.02 0.02 -0.00 -0.00 -0.02 -0.02 -0.04 -0.04 -0.06 -0.06 -0.08 -0.08 -0.10 -0.10 -0.12 -0.12 -0.14 -0.14 -0.16 -0.16 -0.18 -0.18 -0.20 -0.22 -0.22 EOF4 65 60 55 50 45 40 Latitude (ÞN) -40 -30 -20 -10 0 Longitude (ÞW) 0.14 0.12 0.10 0.10 0.10 0.08 0.08 0.06 0.04 EOF 1 65 60 55 50 45 40 Latitude (ÞN) -40 -30 -20 -10 0 Longitude (ÞW) 0.18 0.16 0.14 0.12 0.10 0.08 0.08 0.06 0.04 0.02 0.00 0.00 -0.02 -0.04 -0.06 -0.08 -0.10 -0.10 -0.12 -0.14 -0.16 -0.18 EOF 2 65 60 55 50 45 40 Latitude (ÞN) -40 -30 -20 -10 0 Longitude (ÞW) 0.16 0.14 0.12 0.10 0.08 0.08 0.08 0.06 0.04 0.04 0.02 0.00 -0.02 -0.04 -0.06 -0.06 -0.08 -0.10 -0.12 -0.14 -0.16 -0.18 -0.20 -0.20 -0.22 EOF 3 65 60 55 50 45 40 Latitude (ÞN) -40 -30 -20 -10 0 Longitude (ÞW) 0.14 0.12 0.10 0.08 0.06 0.06 0.04 0.04 0.02 0.02 -0.00 -0.00 -0.02 -0.02 -0.04 -0.04 -0.06 -0.06 -0.08 -0.08 -0.10 -0.10 -0.12 -0.12 -0.14 -0.14 -0.16 -0.16 -0.16 -0.20 -0.22 -0.24 -0.26 EOF 4
Fig. 2. EOFs of winter North Atlantic sea surface temperature anomalies between 38° and 66°N from GISST2.3 data for 1901-1995. EOF1
explains 32% of total variance, EOF2 explains 24%, EOF3 explains 15% and EOF4 explains 8%. The UK is represented by the grid-box centred on 2°W and 52°N.
Fig. 3. EOFs of summer North Atlantic sea surface temperature anomalies between 38° and 66°N from GISST2.3 data for 1901-1995. EOF1
explains 34% of total variance, EOF2 explains 20%, EOF3 explains 17% and EOF4 explains 11%. The UK is represented by the grid–box centred on 2°W and 52°N.
.64 .65 .66 .67 .68 .69 .7 .71 .72 .73 1900 1910 1920 1930 1940 1950 1960 1970 1980 1990 2000 Year Probability .66 .67 .68 .69 .7 .71 .72 .73 1900 1910 1920 1930 1940 1950 1960 1970 1980 1990 2000 Year Probability .62 .64 .66 .68 .7 .72 .74 1900 1910 1920 1930 1940 1950 1960 1970 1980 1990 2000 Year Probability .72 .725 .73 .735 .74 .745 .75 .755 .76 .765 .77 .775 .78 1900 1910 1920 1930 1940 1950 1960 1970 1980 1990 2000 Year Probability .7 .71 .72 .73 .74 .75 .76 .77 .78 1900 1910 1920 1930 1940 1950 1960 1970 1980 1990 2000 Year Probability .71 .72 .73 .74 .75 .76 .77 .78 .79 .8 1900 1910 1920 1930 1940 1950 1960 1970 1980 1990 2000 Year Probability .66 .67 .68 .69 .7 .71 .72 .73 .74 .75 1900 1910 1920 1930 1940 1950 1960 1970 1980 1990 2000 Year Probability .74 .745 .75 .755 .76 .765 .77 .775 .78 1900 1910 1920 1930 1940 1950 1960 1970 1980 1990 2000 Year Probability .69 .695 .7 .705 .71 .715 .72 .725 .73 .735 .74 .745 .75 .755 .76 1900 1910 1920 1930 1940 1950 1960 1970 1980 1990 2000 Year Probability .69 .7 .71 .72 .73 .74 .75 .76 .77 1900 1910 1920 1930 1940 1950 1960 1970 1980 1990 2000 Year Probability Bradford Cambridge Durham Edgbaston Edinburgh Hastings Kew Nottingham Oxford Plymouth
Fig. 4. Thirty–year moving averages of summer pdd at selected UK sites. The shading indicates the long–term mean, plus or minus the standard
error (an indication of the variability expected due to sampling).
inference is that large-scale forcing is at work.
Significant (α<0.05) linear trends in the annual time-series of pdd for the period 1901–1995 arose at five stations (CA, EN, NG, OX and PL). As Fig. 4 indicates, however, all sites display a marked and synchronous increase in pdd since the
1970s, indicating a tendency towards more persistent summer dry-spells in recent decades. Over the same period there was a general reduction in the persistence of wet-spells as indicated by the pww parameter (Fig. 5), but only the declines in the annual series at BD and PL were statistically
.6 .61 .62 .63 .64 .65 .66 .67 .68 1900 1910 1920 1930 1940 1950 1960 1970 1980 1990 2000 Year Probability .475 .48 .485 .49 .495 .5 .505 .51 .515 1900 1910 1920 1930 1940 1950 1960 1970 1980 1990 2000 Year Probability .52 .525 .53 .535 .54 .545 .55 .555 .56 .565 .57 .575 .58 1900 1910 1920 1930 1940 1950 1960 1970 1980 1990 2000 Year Probability .535 .54 .545 .55 .555 .56 .565 .57 .575 .58 1900 1910 1920 1930 1940 1950 1960 1970 1980 1990 2000 Year Probability .52 .525 .53 .535 .54 .545 .55 .555 .56 .565 .57 .575 .58 .585 .59 1900 1910 1920 1930 1940 1950 1960 1970 1980 1990 2000 Year Probability .45 .455 .46 .465 .47 .475 .48 .485 .49 .495 .5 .505 .51 1900 1910 1920 1930 1940 1950 1960 1970 1980 1990 2000 Year Probability .45 .46 .47 .48 .49 .5 .51 .52 .53 .54 .55 1900 1910 1920 1930 1940 1950 1960 1970 1980 1990 2000 Year Probability .49 .5 .51 .52 .53 .54 .55 .56 .57 1900 1910 1920 1930 1940 1950 1960 1970 1980 1990 2000 Year Probability .49 .5 .51 .52 .53 .54 .55 .56 .57 1900 1910 1920 1930 1940 1950 1960 1970 1980 1990 2000 Year Probability .5 .52 .54 .56 .58 .6 .62 1900 1910 1920 1930 1940 1950 1960 1970 1980 1990 2000 Year Probability Bradford Cambridge Durham Edgbaston Edinburgh Hastings Kew Nottingham Oxford Plymouth
Fig. 5. As in Figure 4, but for summer pww.
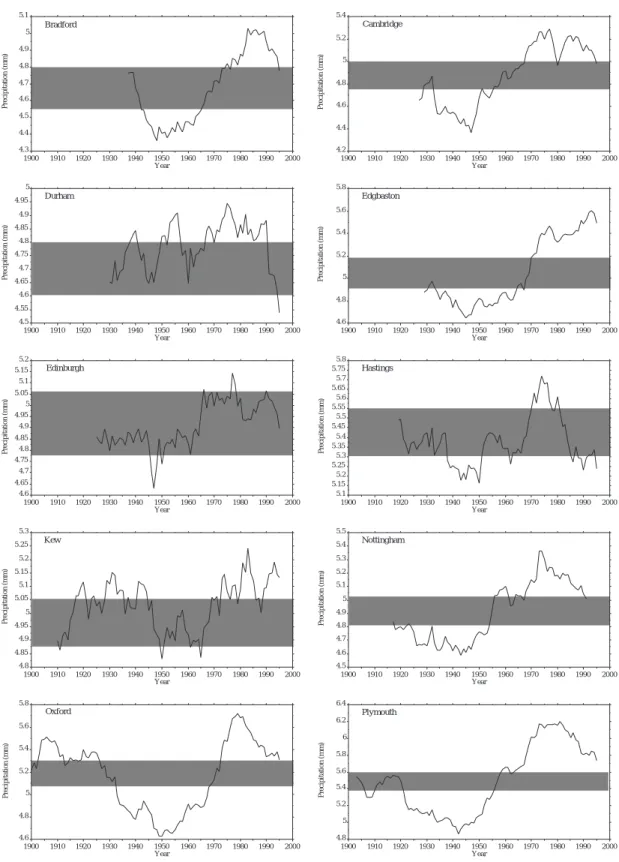
significant. The series for µ show less homogeneity between sites and only EN returns a significant increase in mean summer wet-day amounts. Nonetheless, most stations display a wet-day minimum for the 30-year period ending in the 1950s, an increase over the following three decades,
and thereafter a general decline. The consensus of Figs. 4 to 6 is a shift towards shorter summer wet-spells with lower intensities, separated by longer dry-interludes — a pattern that is consistent with reports of increased summer drought severity (Marsh and Turton, 1996) and higher summer
4.3 4.4 4.5 4.6 4.7 4.8 4.9 5 5.1 1900 1910 1920 1930 1940 1950 1960 1970 1980 1990 2000 Year Precipitation (mm) 4.2 4.4 4.6 4.8 5 5.2 5.4 1900 1910 1920 1930 1940 1950 1960 1970 1980 1990 2000 Year Precipitation (mm) 4.5 4.55 4.6 4.65 4.7 4.75 4.8 4.85 4.9 4.95 5 1900 1910 1920 1930 1940 1950 1960 1970 1980 1990 2000 Year Precipitation (mm) 4.6 4.8 5 5.2 5.4 5.6 5.8 1900 1910 1920 1930 1940 1950 1960 1970 1980 1990 2000 Year Precipitation (mm) 4.6 4.65 4.7 4.75 4.8 4.85 4.9 4.95 5 5.05 5.1 5.15 5.2 1900 1910 1920 1930 1940 1950 1960 1970 1980 1990 2000 Year Precipitation (mm) 5.1 5.15 5.2 5.25 5.3 5.35 5.4 5.45 5.5 5.55 5.6 5.65 5.7 5.75 5.8 1900 1910 1920 1930 1940 1950 1960 1970 1980 1990 2000 Year Precipitation (mm) 4.8 4.85 4.9 4.95 5 5.05 5.1 5.15 5.2 5.25 5.3 1900 1910 1920 1930 1940 1950 1960 1970 1980 1990 2000 Year Precipitation (mm) 4.5 4.6 4.7 4.8 4.9 5 5.1 5.2 5.3 5.4 5.5 1900 1910 1920 1930 1940 1950 1960 1970 1980 1990 2000 Year Precipitation (mm) 4.6 4.8 5 5.2 5.4 5.6 5.8 1900 1910 1920 1930 1940 1950 1960 1970 1980 1990 2000 Year Precipitation (mm) 4.8 5 5.2 5.4 5.6 5.8 6 6.2 6.4 1900 1910 1920 1930 1940 1950 1960 1970 1980 1990 2000 Year Precipitation (mm) Bradford Cambridge Durham Edgbaston Edinburgh Hastings Kew Nottingham Oxford Plymouth
Fig. 6. As in Figure 4, but for summer µ.
indices (Mayes, 1998) since the 1970s.
From these preliminary analyses it is evident that there have been significant inter-decadal variations in the parameters describing UK summer rainfall since 1901. To investigate possible relationships between daily rainfall
occurrence and the four leading EOFs of the North Atlantic SST anomalies, it was first necessary to transform pdd and
pww using the technique of logistic regression (see Kilsby et
al., 1998). This ensures properly bounded probability
and one). Precipitation model parameters and EOFs for the 50-year period 1946–1995 were used for both the correlation and regression analyses described below.
Table 3a shows that summer pdd was most strongly and most consistently correlated with EOF1 (and to a lesser extent EOF3) when considering summer SSTs. All sites returned significant correlations for EOF1 and EOF3 (with the marginal exception of EH for EOF3). Correlations with EOF1 ranged from r = +0.38 at DU to r = +0.54 at PL, and from r = –0.27 at DU to r = –0.42 at CA for EOF3. Only CA and PL returned statistically significant correlations between pdd and EOF2, and there were no significant correlations between pdd and EOF4 at any of the sites.
In comparison with pdd, equivalent correlations for pww were both weaker and less numerous (Table 3b). The strongest correlation between pww and EOF1 was r = –0.46 (NG), and for EOF3, r = +0.35 (EH). No significant correlations were returned for pww versus either EOF2 or EOF4 at any site. These results suggest that North Atlantic SSTs exert greater influence on conditional dry-day probabilities than wet-day probabilities. In other words, ocean temperatures are more useful predictors of wet-day absence than occurrence. This is to be expected given the highly problematic task of statistically downscaling summer rainfall events which tend to be of convective origin and often highly localised phenomena.
For the same reasons, Table 3c shows that North Atlantic SSTs have very limited explanatory power for summer rainfall intensities across the UK. Given that two significant correlations would be expected to occur by chance from 40 tests at a confidence level of 95%, it is unreasonable to draw any definitive conclusions from the few significant results returned. This outcome supports previous studies showing that most of the UK lies outside the region of significant correlations between summer SSTs and rainfall amounts (Colman, 1997; Colman and Davey, 1999; Wilby, 1998).
From the preceding trend and correlation analyses, it is clear that dry-spell persistence was most sensitive to summer SST forcing and that wet-spell persistence and intensities had only limited predictability — even from concurrent ocean temperatures. Therefore, the remainder of the paper will focus on pdd. Accordingly, Fig. 7 shows the extent to which the combination of EOF1, EOF2 and EOF3 (see Table 3a) describes year-to-year variations in pdd at CA when entered into a multiple linear regression model. The three leading EOFs explain 46% of the observed variance in pdd, for the period 1946–1995 but it is conceded that the results for CA are likely to be the best-case scenario (given the relatively high correlations shown in Table 3a). Although the modelled and observed pdd time–series are in broad
Table 3a. Significant correlations (α<0.05) between summer
pdd and the four leading EOFs of summer North Atlantic SSTs for 1946–1995
Station June–August SSTs (concurrent season) code
EOF1 EOF2 EOF3 EOF4
BD +0.47 –0.41 CA +0.48 –0.32 –0.42 DU +0.38 –0.27 EN +0.54 –0.37 EH +0.46 HA +0.47 –0.36 KE +0.49 –0.28 NG +0.42 –0.41 OX +0.51 –0.40 PL +0.53 –0.29 –0.33
Table 3b. Significant correlations (α<0.05) between summer
pww and the four leading EOFs of summer North Atlantic SSTs for 1946–1995
Station June–August SSTs (concurrent season) code
EOF1 EOF2 EOF3 EOF4
BD –0.39 +0.32 CA DU –0.37 +0.28 EN –0.27 EH –0.35 +0.35 HA KE NG –0.46 OX –0.32 PL –0.27
Table 3c. Significant correlations (α<0.05) between summer
µ and the four leading EOFs of summer North Atlantic SSTs
for 1946–1995
Station June–August SSTs (concurrent season) code
EOF1 EOF2 EOF3 EOF4
BD CA DU EN –0.30 EH –0.31 HA +0.30 KE NG OX PL –0.29
1997). For example, Colman and Davey (1999) report a maximum correlation strength of 0.37 between January– February ocean temperatures and July–August rainfall totals (over west-central Europe), compared with 0.48 for sea level pressure (near Newfoundland), and >0.50 for surface air temperatures (in France and southern England).
Table 4a shows that EOF3 of the winter SSTs (see Fig. 3) was significantly (negatively) correlated with summer dry-spell persistence, pdd at six out of the ten sites, with a minimum of r = –0.41 for CA. In comparison, the pww and µ parameters returned no consistent preference for any of the leading EOF predictors. Therefore, using winter (December–February) EOF3, predictions were made only for pdd at Cambridge (CA) considering each year in turn between 1946–1995. As in Colman and Davey (1999) a jack-knife technique and inflated linear regression were used to relate the series. The jack-knifing excludes the target year from the data when the logistic regression equation is trained. The two years immediately following the target year were also excluded to negate autocorrelation effects. Finally, the inflated regression ensures that the variance of the regressed pdd was made equal to the variance of the observed
pdd. (Predictions for CA, once again, probably demonstrate the model at its best).
Jack-knife predictions of summer pdd were significantly positively correlated with observed series at CA (r = +0.34). Negative (positive) values of EOF3 for winter SSTs were associated with higher (lower) dry-spell persistence. As Fig. 8a shows, the forecasted time-series of pdd captured the general (upward) trend of the observations over the 50-year period but performed rather poorly for individual seasons. The significant underestimation of pdd by the model in 1966 and over-estimation in 1984 were particularly noteworthy. However, the forecasting skill of the model was still greater than persistence, a simple measure of zero-order forecast skill. For example, the autocorrelation between pdd in spring and pdd in summer was r = +0.04.
The forecasting skill of the logistic regression model of summer pdd was attributed to three factors: [1] strong persistence of North Atlantic SST anomalies between winter and summer (Colman, 1997; Wilby, 1998); [2] covariance between North Atlantic SSTs, atmospheric circulation patterns and precipitation over northwest Europe (Hurrell, 1995); and [3] higher predictability of precipitation absence than occurrence across the UK.
Figure 8b (and a comparison of Fig. 2 versus Fig. 3) shows that the winter EOF3 and summer EOF3 series were highly correlated (r = +0.54). Furthermore, EOF3 for both winter and summer were correlated with the winter NAO index, with high (low) values of EOF3 corresponding to negative (positive) phases of the NAO. This is consistent with agreement, the predictors failed to reproduce the magnitude
of the most severe dry-spell in 1976. However, the regression model did capture the general increase in dry-spell persistence between the 1960s and 1980s, as well as the very persistent dry-spells in 1983, 1989, 1990 and 1995.
Seasonal forecasting of summer
dry-spells
Analyses of UK rainfall records suggests that there have been significant decadal variations in the parameters that typically underpin ‘chain dependent’ stochastic rainfall models (see Figs. 2 to 4), and that many of these changes correlate with summer ocean temperatures in the North Atlantic. Specifically, there has been an increase in dry-spell persistence since the 1970s that attained unprecedented levels in the 1990s at all sites but was most pronounced in central England (CA, EN, NG and OX). This parameter was most strongly (positively) correlated with EOF1 of the summer SSTs (which was characterised by positive anomalies throughout the North Atlantic), and negatively correlated with EOF3 (which was in turn correlated with the North Atlantic Oscillation, a measure of the strength and position of the westerlies across the British Isles). In contrast, the wet-spell persistence parameter was weakly (negatively) correlated with EOF1, and the rainfall intensity parameter was generally uncorrelated with any of the four leading EOFs. These findings suggest that it is legitimate to condition the occurrence parameters of multi-site statistical models of UK summer rainfall on concurrent SSTs but not necessarily for the intensity parameter.
This raises the question: might summer precipitation
occurrence be more predictable from preceding SSTs than
summer precipitation amounts? Previous studies have already concluded that forecasting summer rainfall totals is more problematic than summer temperatures (Colman,
Fig. 7. Annual series of observed and modelled summer pdd at Cambridge, 1946–95.
Higuchi et al. (1999) who found a significant coherent relationship between the NAO and North Atlantic SSTs at interannual and interdecadal timescales. Since positive phases of the NAO are generally associated with a more northerly track of the westerlies and with above normal rainfall over Scotland and negative rainfall anomalies over central, eastern and southern England (Wilby et al., 1997), this pattern largely explains the recent tendency for longer summer dry-spells at Cambridge.
Concluding remarks
Long-term (>90 year) records of daily rainfall at ten stations in the UK exhibit decadal variations in parameters that are frequently used for stochastic rainfall modelling and statistical downscaling (see the review of Wilks and Wilby, 1999). For instance, summer dry-spell persistence, pdd, has increased steadily since the 1970s at all sites. In contrast, statistically significant changes in the mean wet-day amounts, µ, were found at only one station (compared with significant increases in pdd at five sites). This implies that long-term changes in the frequency and severity of UK summer droughts have been due to greater dry-spell persistence (i.e. fewer rain days) as opposed to lower rainfall intensities.
Rainfall occurrence parameters (pdd and pww), computed
Table 4a. Significant correlations (α<0.05) between summer
pdd and the four leading EOFs of winter North Atlantic SSTs for 1946–1995
Station December–February SSTs (two season lead) code
EOF1 EOF2 EOF3 EOF4
BD –0.34 CA –0.41 DU EN –0.30 EH –0.27 HA KE NG OX –0.33 PL –0.32
Table 4b. Significant correlations (α<0.05) between summer
pww and the four leading EOFs of winter North Atlantic SSTs for 1946–1995
Station December–February SSTs (two season lead) code
EOF1 EOF2 EOF3 EOF4
BD +0.37 CA DU –0.34 EN EH HA KE NG OX PL
Table 4c. Significant correlations (α<0.05) between summer
µ and the four leading EOFs of winter North Atlantic SSTs
for 1946–1995
Station December–February SSTs (two season lead) code
EOF1 EOF2 EOF3 EOF4
BD CA DU +0.35 EN EH HA KE NG +0.29 OX PL
Fig. 8. Annual series of (a) observed and forecasted summer pdd at Cambridge; (b) winter and summer EOF3, 1946–95.
for all summers between 1946–1995, were correlated significantly with leading EOFs of summer North Atlantic SSTs. Conditional dry-day probabilities, pdd were most positively correlated with EOF1, a pattern associated with positive SST anomalies in the mid-Atlantic, and negatively correlated with EOF3, a pattern anti-phased with the North Atlantic Oscillation (NAO) index. Thus, a greater affinity for longer summer dry-spells over central, southern and eastern England coincides with above average ocean temperatures and positive phases of the NAO. As might be expected a priori, these periods also coincided with lower wet-spell persistence, as indicated by the pww parameter. However, interannual variations in summer rainfall intensities, µ, were not consistently conditioned by any of the leading EOFs of summer SSTs. These findings indicate that there is some rationale for conditioning rainfall occurrence parameters on concurrent SSTs, but not intensity parameters — a distinction that might account for the rather modest improvements in monthly rainfall statistics reported for other conditional models (Katz, pers. comm.; Wilby, 1998).
A further explanation for the low percentage of explained variance in precipitation parameters reported in earlier studies is that domain average SSTs or sea-level pressure anomalies were employed as predictors rather than EOFs. In other words, a significant component of the forcing is attributed to the distribution of SST or pressure anomalies in the North Atlantic as well as their absolute values. For example, using a comparable domain to the present study and the same data sets, Wilby (1998) showed that area-average SST anomalies explained just 5% of the variance in summer pdd at Cambridge, compared with 46% reported herein for the three leading EOFs. Clearly EOFs have greater information content than simple area-averages; they may also aid elucidation of the underlying physical mechanisms (e.g. changes in dominant storm tracks, blocking patterns, regional airflows, etc.)
The analysis of model parameters also implies that the forecasting skill for summer rainfall totals over England and Wales reported by Colman and Davey (1999) may originate from skillful predictions of the rainfall occurrence (pdd and pww) component rather than mean rain day amounts,
µ . This is because only summer pdd was correlated significantly with winter SSTs at the chosen sites. Even so, the forecasting skill for pdd in the present study was still relatively low (r = +0.34) compared with that of >0.5 reported for July–August Central England Temperatures (Colman, 1997). This raises the issue of the practical (as opposed to statistical) significance of such forecasts. For individual years, it was demonstrated that the forecasted
pddvalues may be in significant error; yet over decadal
timescales, the SSTs track the tendency towards greater drought severity since the 1970s. This implies that the strategic management of water resources in the UK may benefit from improved understanding of the current and future multi-decadal behaviour of North Atlantic ocean temperatures. In this respect, spectral analyses might help elucidate the periods of maximum coherence between SSTs and station rainfall whilst recognising the non-stationarity of the variability in both series (as in Benner, 1999).
Finally, it should be acknowledged that statistically downscaling daily precipitation parameters for summer months using spatially and temporally remote predictors is problematic. By nature, summer rainfall is highly localised in space and time; therefore, greater forecasting success might be expected at the station scale for other seasons when frontal as opposed to convective mechanisms predominate. In contrast, rainfall absence is probably most skillfully downscaled in spring and summer when anticyclonic airflows are most prevalent.
Acknowledgements
This research was supported by ACCORD (Atmospheric Circulation Classification and Regional Downscaling) under the European Community Environment Research Programme (contract: ENV4–CT97–0530) and by ACACIA (A Consortium for the Application of Climate Impact Assessments, National Center for Atmospheric Research, Boulder, Colorado). NCAR is sponsored by the National Science Foundation. The author is grateful for the constructive comments of two anonymous referees, and for the technical assistance provided by John Shacklock (University of Derby).
References
Barnston, A.G., 1994. Linear statistical short-term climate predictive skill in the northern hemisphere. J. Climate, 7, 1513– 64.
Benner, T.C., 1999. Central England temperatures: long–term variability and teleconnections. Int. J. Climatol., 19, 391–403. Braud, I., Obled, C. and Pham Dinh, T., 1993. Empirical Orthogonal Functions (EOF) analysis of spatial random fields: theory, accuracy of the numerical approximations and sampling effects. Stoch. Hydrol. Hydraul., 7, 146–160.
Buishand, T.A., 1978. Some remarks on the use of daily rainfall models. J. Hydrol., 36, 295–308.
Cayan, D.R., Dettinger, M.D., Diaz, H.F. and Graham, N.E., 1998. Decadal variability of precipitation over western North America.
J. Climate, 11, 3148–66.
Clark, M.P., Hay, L.E., McCabe, G.J., Leavesley, G.H., Serreze, M.C. and Wilby, R.L., 2001. The use of weather and climate information in management of water resources in the western United States. Proceedings of the Special Conference on Climate
Atmospheric Administration, Boulder, CO, USA, in press. Colman, A.W., 1997. Prediction of summer central England
temperature from preceding north Atlantic winter sea surface temperature. Int. J.Climatol., 17, 1285–1300.
Colman, A.W. and Davey, M.K., 1999. Prediction of summer temperature, rainfall and pressure in Europe from preceding winter north Atlantic ocean temperature. Int. J. Climatol., 19, 513–36.
Conway, D., 1998. Recent climate variability and future climate change scenarios for Great Britain. Prog. Phys. Geog., 22, 350– 74.
Dai, A., Trenberth, K.E. and Karl, T.R., 1998. Global variations in droughts and wet spells: 1900–1995. Geophys. Res. Lett., 25, 3367–70.
Folland, C.K. and Parker, D.E., 1995. Correction of instrumental biases in historical sea surface temperature data using a physical approach. Quart. J. Roy. Meteorol. Soc., 121, 319–67. Fraedrich, K. and Muller, K., 1992. Climate anomalies in Europe
associated with ENSO extremes. Int. J. Climatol., 12, 25–31. Gershunov, A. and Barnett, T.P., 1998. Interdecadal modulation
of ENSO teleconnections. Bull. Amer. Meteorol.Soc., 79, 2715– 25.
Giorgi, F. and Mearns, L.O., 1991. Approaches to the simulation of regional climate change. A review. Rev. Geophys., 29, 191– 216.
Gregory, J.M., Jones, P.D. and Wigley, T.M.L., 1991. Precipitation in Britain: an analysis of area–average data updated to 1989.
Int. J. Climatol., 11, 331–45.
Gregory, J.M., Wigley, T.M.L. and Jones, P.D., 1993. Application of Markov models to area–average daily precipitation series and interannual variability in seasonal totals. Clim. Dynam., 8, 299–310.
Higuchi K., Huang J.P., Shabbar A., 1999. A wavelet characterization of the North Atlantic oscillation variation and its relationship to the North Atlantic sea surface temperature.
Int. J. Climatol., 19, 1119–1129.
Hughes, J.P. and Guttorp, P., 1994. Incorporating spatial dependence and atmospheric data in a model of precipitation.
J. Appl. Meteorol., 33, 1503–15.
Hurrell, J.W., 1995. Decadal trends in the North Atlantic Oscillation: regional temperature and precipitation. Science, 269, 676–79.
Johansson, A., Barnston, A., Saha, S. and Van den Dool, H.. 1998. On the level and origin of seasonal forecast skill in Europe. J.
Atmos. Sci., 55, 103–27.
Jones, P.D. and Conway, D., 1997. Precipitation in the British Isles: an analysis of area–average data updated to 1995. Int. J.
Climatol., 13, 655–63.
Katz, R.W. and Parlange, M.B., 1993. Effects of an index of atmospheric circulation on stochastic properties of precipitation.
Water Resour. Res., 29, 2335–44.
Katz, R.W. and Parlange, M.B.. 1996. Mixtures of stochastic processes: application to statistical downscaling. Climate Res., 7, 185–93.
Katz, R.W. and Parlange, M.B., 1998. Overdispersion phenomenon in stochastic modeling of precipitation. J. Climate, 11, 591– 601.
Kiely, G., Albertson, J.D., Parlange, M.B. and Katz, R.W., 1998. Conditioning stochastic properties of daily precipitation on indices of atmospheric circulation. Meteorol.Appl., 5, 75–87. Klein, W.H. and Glahn, H.R., 1974. Forecasting local weather by
means of model output statistics. Bull. Amer. Meteorol. Soc., 55, 1217–1227.
Kilsby, C.G., Cowpertwait, P.S.P., O’Connell, P.E. and Jones, P.D., 1998. Predicting rainfall statistics in England and Wales using atmospheric circulation variables. Int. J. Climatol., 18, 523– 39.
Marsh, T.J. and Turton, P.S., 1996. The 1995 drought — a water resource perspective. Weather, 51, 46–53.
Mayes, J., 1996. Spatial and temporal fluctuations of monthly rainfall in the British Isles and variations in the mid–latitude westerly circulation. Int. J. Climatol., 16, 585–96.
Mayes, J., 1998. United Kingdom summer weather over 50 years — continuity or change? Weather, 53, 2–11.
Richardson, C.W., 1981. Stochastic simulation of daily precipitation, temperature, and solar radiation. Water Resour.
Res., 17, 182–90.
Rodionov, S.N. and Martin, J.H., 1999. An expert system–based approach to prediction of year–to–year climatic variations in the North Atlantic region. Int. J. Climatol., 19, 951–74. Wigley, T.M.L. and Jones, P.D., 1987. England and Wales
precipitation: a discussion of recent changes in variability and an update to 1985. J. Climatol., 7, 231–46.
Wilby, R.L., 1993. Evidence of ENSO in the synoptic climate of the British Isles since 1880. Weather, 48, 234–9.
Wilby, R.L., 1998. Statistical downscaling of daily precipitation using daily airflow and seasonal teleconnection indices. Climate
Res., 10, 163–78.
Wilby, R.L.. 2001. Seasonal forecasting of UK river flows using preceding North Atlantic pressure patterns. J. Chart. Inst. Water
Environ. Manage., 15, 56–63.
Wilby, R.L. and Wigley, T.M.L., 1997. Downscaling general circulation model output: a review of methods and limitations.
Prog.Phys.Geog., 21, 530–548.
Wilby, R.L., O’Hare, G. and Barnsley, N., 1997. The North Atlantic Oscillation and British Isles climate variability 1865– 1995. Weather, 52, 266–76.
Wilks, D.S., 1989. Conditioning stochastic daily precipitation models on total monthly precipitation. Water Resour. Res., 25, 1429–39.
Wilks, D.S., 1999. Interannual variability and extreme–value characteristics of several stochastic daily precipitation models.
Agric. Forest Meteorol., 93, 153–69.
Wilks, D.S. and Wilby, R.L., 1999. The weather generation game: a review of stochastic weather models. Prog. Phys. Geog., 23, 329–57.