HAL Id: hal-00304698
https://hal.archives-ouvertes.fr/hal-00304698
Submitted on 1 Jan 2002HAL is a multi-disciplinary open access archive for the deposit and dissemination of sci-entific research documents, whether they are pub-lished or not. The documents may come from teaching and research institutions in France or abroad, or from public or private research centers.
L’archive ouverte pluridisciplinaire HAL, est destinée au dépôt et à la diffusion de documents scientifiques de niveau recherche, publiés ou non, émanant des établissements d’enseignement et de recherche français ou étrangers, des laboratoires publics ou privés.
Dynamic nitrogen deposition thresholds during forest
stand development in a Douglas fir forest analysed with
two nitrogen models SMART2 and MERLIN
A. Tietema, J. P. Mol-Dijkstra, J. Kros, W. de Vries
To cite this version:
A. Tietema, J. P. Mol-Dijkstra, J. Kros, W. de Vries. Dynamic nitrogen deposition thresholds during forest stand development in a Douglas fir forest analysed with two nitrogen models SMART2 and MERLIN. Hydrology and Earth System Sciences Discussions, European Geosciences Union, 2002, 6 (3), pp.375-382. �hal-00304698�
Dynamic nitrogen deposition thresholds during forest stand
development in a Douglas fir forest analysed with two nitrogen
models SMART2 and MERLIN
A. Tietema
1, J.P. Mol-Dijkstra
2, J. Kros
2and W. De Vries
21Centre for Geo-ecological Research (ICG), Institute for Biodiversity and Ecosystem Dynamics (IBED)-Physical Geography, University of Amsterdam, Nieuwe Achtergracht 166, 1018 WV Amsterdam, The Netherlands
2Alterra-Green World Research, P.O. Box 47, 6700 AA Wageningen, The Netherlands
Email for corresponding author: [email protected]
Abstract
In contrast to the classical critical load (CL) concept, based on long-term steady state conditions, a dynamic deposition threshold (DDT) is introduced. This DDT takes into account all relevant dynamic aspects of vegetation development/forest growth, mineralisation, immobilisation and denitrification, depending on the successional stage of the forest. DDT values for nitrogen were determined for a Douglas fir rotation by two process-based nitrogen models SMART2 and MERLIN using three different criteria for critical nitrogen leaching. During most of the rotation time, the predicted DDT values were higher than the corresponding traditional CL. SMART2 and MERLIN predicted a maximum
DDT of 4.9 and 4.6 kmol N ha-1 yr-1 (69 and 64 kg N ha-1 yr-1), respectively, when accepting a critical N leaching level of 1.73 kmol N
ha-1 yr-1 related to impacts on ground water quality. This is due mainly to relatively high tree uptake during the first 50 years of a forest
rotation, compared to a long-term estimate, i.e. the average tree uptake during a rotation period, used in the traditional CL calculation. At the lowest critical N leaching level of 0.10 kmol N ha-1 yr-1, corresponding to a level that might be critical for vegetation changes, the calculated
DDT value and related N availability was such that it influenced tree growth, indicated by an increased CN ratio in foliage and organic
matter. The two models SMART2 and MERLIN predicted comparable absolute levels of DDT but with a completely different temporal pattern. This was caused by differences in timing of mineralisation in the soil. Both models showed the importance of the soil for supplying N for tree growth in young and productive forests, but the timing of this mobilisation of N from the soil was different. This difference between the two models reflects the lack of knowledge of the mechanisms of the role of soil organic matter in satisfying tree N demand. Nevertheless, this method has a high potential for increasing more detailed insight into the dynamic behaviour of CL, which will make it possible to focus management options on a smaller spatial and temporal scale.
Keywords: critical load, dynamic deposition threshold, nitrogen, forest, SMART2, MERLIN
Introduction
The critical load (CL) concept was developed in an attempt to determine thresholds of pollutant inputs from atmospheric sources. A CL is defined as a quantitative estimate of an exposure to one or more pollutants below which no significant harmful effects on specified sensitive elements of the environment occur (Grennfelt and Thörnelöf, 1992). A widely accepted method to quantify a CL is the steady-state mass balance approach (e.g. Posch et al., 1995). Different CL values are defined using different criteria for environmental effects. The CL for nitrogen (N) as a nutrient (CL(N)) for instance, aims at preventing eutrophication of
the terrestrial ecosystem and linked freshwater ecosystems. It is calculated as the total amount of N that, given a certain critical N leaching level, can be absorbed by major long-term N sinks (net vegetation uptake, long-long-term acceptable soil N immobilisation and denitrification) without long-term adverse ecological effects.
One of the crucial aspects of the critical load concept is that it considers only an ecosystem at steady state. That means that all dynamic aspects in the nitrogen cycle are ignored. This assumption is made to gain insight into long-term acceptable loads, thus focusing the policy makers’ view on the ultimate emission reductions that are needed (De
A. Tietema, J.P. Mol-Dijkstra, J. Kros and W. De Vries
Vries, 1993; Sverdrup et al., 1990). This implies that critical loads are relevant to assess the ultimate emission reductions, but an excess of those loads does not necessarily imply that the forest ecosystem is at risk yet. To gain insight into the relationship between ecosystem risk and atmospheric deposition, the threshold at the time under consideration must be known. Such thresholds are denoted as present deposition thresholds (De Vries et al., 2002), being the deposition levels that lead to concentrations of nitrogen (or acidity) in soil solution that are equal to critical limits at present (not in a steady-state situation).
To gain insight into the dynamics of impacts of emission reductions up to critical loads, dynamic models are needed since the dynamics in ecosystem behaviour lead to situations where the presently acceptable N input is higher or lower than the CL(N) (Pardo and Driscoll, 1996). For instance, if pH increases due to deposition reduction, mineralisation will accelerate, which in turn will result in higher nitrate leaching fluxes. Consequently, during such (temporary) circum-stances a nitrogen input at critical load will still cause violation of the critical N leaching level. Conversely, in the case of a newly planted forest, net N accumulation in the trees will be rather large, which in turn may tolerate a higher N deposition level without violating the critical leaching level. It might even be possible that N inputs equal or less than CL(N) result in an unfavourable situation in respect of forest growth.
In this paper, a procedure for a dynamic critical load calculation is proposed that takes into account relevant site specific dynamic aspects of the N cycle. In accordance with the present deposition threshold, this is called the Dynamic Deposition Threshold (DDT).
Contrary to the classical CL that can be assessed by using a steady state model, the DDT can be assessed only by dynamic models. SMART2 (Kros et al., 1995) and MERLIN (Cosby et al., 1997) are two process-based dynamic N models, which are suitable for the calculation of such a DDT. Both models are developed to simulate N cycling at scales varying from the ecosystem scale up to a regional scale. In addition, both models have been applied to the Douglas fir experimental forest near Speuld (Tiktak et al., 1995; Tietema
et al., 1998). These two models have been used to evaluate
the DDT during stand development in this Douglas fir forest.
Material and Methods
SITE DESCRIPTION
The Speulderbos (52°13´N, 5°39´E) is located a few kilometres south of the town of Speuld, in “de Veluwe”, in the central part of The Netherlands. At the study site, an
oak coppice, planted in 1909, was felled in 1960. The soil was neither ploughed nor fertilised before planting Douglas fir seedlings (Pseudotsuga menziesii (Mirb.) Franco.) in 1962.
At the time of the experiments, tree density was about 800 ha–1 and average tree height around 22 metres. There was no undergrowth present. The forest soil has a 4–7 cm thick organic layer. The humusform was classified as a mormoder (Green et al., 1993), the soil as a Haplic Podzol (Koopmans et al., 1995) or as a Cambic Podzol (Tiktak et
al., 1995). The soil is well-drained, consisting of fluviatile
deposits with textures ranging from fine sand to sandy loam. Soil pHH2O ranges from 3.7 in the organic layer to 5.1 in the mineral soil. Base saturation in the mineral soil is almost zero. The groundwater table is always below 40 m.
Total N deposition in The Netherlands increased in the early 1950s, coinciding with the start of the massive development of agricultural activity after the second world war. The current level of deposition was reached in 1980 (Erisman and Bleeker, 1997). Atmospheric nitrogen input measured as throughfall in this forest in the period from 1985 to 1995 ranged from 40 to 50 kg N ha–1 yr–1, about 75% as ammonium.
MODEL DESCRIPTION
SMART2
SMART2 is a simple soil acidification and nutrient cycling model that includes the major hydrological and biogeochemical processes in the vegetation, litter and mineral soil (Kros et al., 1995; Mol-Dijkstra et al., 1998). The soil consists of two compartments, a litter layer and a mineral soil layer. Apart from pH, the model predicts changes in aluminium (Al3+), base cation (BC), ammonium (NH4+), nitrate (NO
3–) and sulphate (SO42–) concentrations in the soil solution and solid phase characteristics depicting the acidification status, i.e. carbonate content, base saturation, readily available Al content and N content in organic matter. The SMART2 model consists of a set of mass balance equations, describing the soil input-output relationships, and a set of equations describing the rate-limited and equilibrium soil processes. The soil solution chemistry in SMART2 depends on net element input from the atmosphere and groundwater, canopy interactions, geochemical interactions in the soil and a complete nutrient cycle (root uptake, litterfall, mineralisation, nitrification and denitrification) for basic cations, sulphur and nitrogen. The model is based on the assumption that the amount of organic matter (C) is in a steady state. N mineralisation is described in SMART2 by a first order reaction. Growth and litterfall
of the vegetation are modelled by a logistic growth function, which acts as a forcing function for nutrient uptake. Nutrient uptake is limited only when there is a shortage in the soil solution. Microbial N immobilisation is described in SMART2 by an increase in N content in soil organic matter. MERLIN
MERLIN (Cosby et al., 1997) is an aggregated, ecosystem-scale mass balance model of linked carbon and nitrogen cycling, simulating nitrogen cycling and leaching in forested ecosystems. The structure of MERLIN includes a tree compartment and two organic soil compartments. The plant compartment is an aggregated pool of carbon and nitrogen representing the “active” portion of the vegetation. In forests, this pool conceptually includes foliage and fine roots. Wood production can be thought of as long-term storage losses from that pool. Soil organic material is divided into labile organic matter (LOM) and refractory organic matter (ROM). The LOM pool may be identified as the forest floor, providing a soil organic compartment that can respond rather quickly to changing external conditions. The ROM pool represents the bulk of slowly decomposing organic matter in the soil profile down through the A, B and C horizons. Fluxes in and out of the ecosystem and between compartments included in MERLIN are atmospheric deposition, hydrological discharge, plant uptake, litterfall, wood production, microbial immobilisation and mineralisation and nitrification. Nitrogen fluxes between compartments are controlled by carbon productivity, by the C/N ratios of organic compartments and by inorganic nitrogen availability in soil solution. MERLIN requires the input of historical sequences of carbon pools and fluxes, of hydrological discharge, and of external sources of inorganic nitrogen, as well as current amounts of nitrogen in the compartments. In addition, it needs parameters specifying plant uptake and microbial immobilisation and soil characteristics such as depth, porosity and bulk density. The output generated by MERLIN includes fluxes of inorganic nitrogen in drainage, total nitrogen contents and C/N ratios of the compartments and rates of nitrogen immobilisation (uptake) and mineralisation. A detailed description of MERLIN is given by Cosby et al. (1997).
DYNAMIC DEPOSITION THRESHOLD Calculation method of the Critical Load
A critical load for nitrogen (CL(N)) is defined as the maximum total N input to an ecosystem, which consists of the sum of permanent plant uptake, long term accumulation of N in the soil, denitrification, and the acceptable leaching
of nitrogen from the perspective of eutrophication (Nilsson and Grennfelt, 1988) according to (cf. De Vries, 1993):
le(crit) de m im, gu N
N
N
N
N
CL
=
+
+
+
(1) where:Ngu = Net growth uptake of N (molc ha–1 yr–1)
Nim,m = Net microbial N immobilisation (molc ha–1 yr–1)
Nde = N denitrification (molc ha–1 yr–1)
Nle(crit) = Critical N leaching (molc ha–1 yr–1)
In Eqn. (1) all terms at the right hand side are in fact influenced by atmospheric deposition. For the calculation of critical loads these terms must be derived at a deposition level that equals the critical load (De Vries, 1993). Furthermore, the critical load concept considers only an ecosystem at steady state. That means that all dynamic aspects in the nitrogen cycle are ignored.
Calculation method of the Dynamic Deposition Threshold
The calculation of the DDT is comparable to the steady-state CL (see Eqn. (1)), but it differs in having time-dependent terms for N uptake through vegetation development/forest growth (Nup), N (im)mobilisation in the soil (Nim) and denitrification (Nde). Similar to the steady-state CL, these terms are dependent on deposition. The DDT (molc ha–1 yr–1) at a particular time (t) is calculated as:
(2) where:
Nup (t) = net change of N in the vegetation at time t
Nim(t) = net change of N in the soil at time t
Nde(t) = N denitrification at time t
Nle(crit)= critical N leaching (molc ha–1 yr–1)
The net change in the vegetation (Ngu (t)) consists of the total N uptake by the vegetation, to be divided in maintenance uptake (Nmu) and growth uptake (Ngu) minus the loss through litterfall (Nlf):
)
(
)
(
)
(
)
(
t
N
t
N
t
N
t
N
up=
gu+
mu−
lf (3) where:Ngu(t) = growth uptake N at time = t
Nmu(t) = maintenance uptake N at time = t
Nlf(t) = litterfall N at time = t Nle(crit) de im up t N t N t N N DDT(t)= ( )+ ( )+ ( )+
A. Tietema, J.P. Mol-Dijkstra, J. Kros and W. De Vries
In a steady state situation, assumed in the CL(N) calculation, litterfall equals maintenance uptake and Nup calculated with Eqn. (3) equals Ngu calculated with Eqn. (1).
The net change in the soil nitrogen pools (Nim (t)) consists of the total N input through litterfall (Nlf) and the microbial N immobilisation (Nim,m) minus the loss through mineralisation (Nmi):
)
(
)
(
)
(
)
(
t
N
t
N
t
N
t
N
im=
lf−
mi+
im,m (4) where:Nmi(t) = N mineralisation flux at time = t
Nim,m(t) = microbial N immobilisation at time = t
In a steady state situation, litterfall equals mineralisation and Nim calculated with Eqn. (4) equals the net microbial N
immobilisation Nim,m calculated with Eqn. (1). Combining Eqns. (2), (3) and (4) results in:
le(crit) im de mi tu t N t N t N t N N DDT(t)= ( )− ( )+ ()+ ()+ (5)
where Ntu(t) stands for the total (or gross) uptake by the vegetation, i.e. the sum of the maintenance and growth uptake. In this study, the time and deposition dependent terms (i.e. Ntu, Nmi and Nde) were calculated using the two dynamic N cycling models MERLIN and SMART2. Since these terms are dependent on the deposition, used as model input, the calculation of DDT makes sense only when it is calculated at a deposition level that equals the DDT. So, Eqn. (5) has to be solved with the deposition equal to DDT. In this study, however, the DDT was approximated by updating its value, used as model input, at each timestep (t) by using the difference between the critical N leaching flux (Nle(crit)) and the modelled N leaching flux (Nle,M). This yields the maximum allowable deposition that meets the N leaching limit. The DDT at time = t is thus calculated as:
(
, ( ) ( ))
) ( ) (t DDT t 1 NleM t Nlecrit DDT = − − − (6) where:DDT(t-1) = the DDT from the previous time step, i.e. the N deposition used for the calculation of
Nle,M (t) (molc ha–1 yr–1)
Nle,M (t) = N leaching flux at time = t and deposition = DDT(t–1) (molc ha–1 yr–1)
Nle(crit) = critical N leaching (molc ha–1 yr–1)
At t = 1, the value of DDT(t–1) was set equal to the present deposition. When DDT(t–1) became negative, it was set to zero. This method assumes that the difference between
Nle,M(t), that follows from the calculation with DDT (t–1) being the N deposition used for the calculation, and Nle(crit), that should be the outcome when calculating a DDT, can be compensated directly by either increasing or decreasing the
DDT value. This is, however, a simplification because all
relevant processes depend on the N deposition and will thus change accordingly. Ideally, the value of DDT should have been calculated iteratively within an optimisation procedure. However, neglecting iteration affects the outcome only in the first years. Within a short time the difference Nle,M(t) –
Nle(crit) is small thus reducing the error to a negligible value.
Criteria
DDT values were evaluated with three criteria on Nle(crit) (Table 1).The EU standard of 50 mg l–1 (0.8 mol
c m–3) was used as drinking water standard (Nle, crit (dw)). For the application of the models MERLIN and SMART2, a constant precipitation excess of 216 mm yr–1 was used. This implies that Nle(crit) (dw) = 0.8 molc m–3 × 2160 m3 ha–1 = 1730 molc ha–1 yr–-1. The criterion based on preventing
vegetation changes (Nle(crit) (vc)) was set to 100 molc ha–1yr–1 (De Vries, 1996). The critical N leaching related to a critical N content in needles (Nle(crit) (nc)) was based on a
Table 1. Overview of the critical N leaching, NO3 concentration and CL(N) values used for the dynamic deposition threshold (DDT) calculations.
Criteria Description N leaching flux*) NO
3 concentration CL(N)
(kmolc ha–1 yr–1) (mol
c m–3) (kmolc N ha–1 yr–1)
Nle,crit(dw) Drinking water standard 1.73 0.80 2.68 Nle,crit(nc) Critical N content in foliage 0.91 0.42 1.76
Nle,crit(vc) Vegetation changes 0.10 0.05 0.87
content of 1.8%, which is a value from pine forests (Erisman
et al., 1998). To link this foliage N concentration to a soil
solution concentration, data from 150 extensively monitored forest sites were evaluated (De Vries and Leeters, 2001; Leeters et al., 1994). From this set, 25 spruce and Douglas fir sites were used to identify the following regression model:
) log( 443 . 0 967 . 1 cN fl ctN = + ⋅ (7) with R2
adj = 51 and N = 25, where ctNfl = N content in foliage (%) and cN= N concentration in the soil solution of the 0–30 cm layer (molc m–3). Using a critical ctN
fl of 1.8% and a precipitation excess of 216 mm yr–1, Eqn. (9) yields a
Nle(crit)(nc) of 0.42 molc m–3 × 2160 m3 ha–1 = 907 mol c ha–1 yr–1. The soil solution concentration thus derived is close to the target value for drinking water in the Netherlands, i.e. 0.40 molc m–3 (25 mg l–1).
For the three criteria used, the classical site specific CL(N) values were calculated with Eqn. (1). Site specific values for growth uptake (Ngu) and immobilisation (Nim) were derived from Tiktak et al. (1995). For Ngu 425 molc ha–1yr–1 was used, based on a average growth rate of 10.7 m3 ha–1 yr–1 during the rotation period. For N
im a value of 329 molc ha–1 yr–1 was used, based on a litter layer of 3 cm to be formed over the past 100 years. Denitrification (Nde) was calculated as a fraction of the critical N leaching flux according to (cf. De Vries, 1993):
(8)
where frde is the denitrification fraction, which was set to a
generic value for dry sandy soils of 0.1 (De Vries, 1996). Depending on the criterion used, CL(N) resulted in a range from 0.87 to 2.68 kmol ha–1 yr–1 (see Table 1). The spread in range is determined fully by the critical N leaching.
The present calculation method, assuming a critical N leaching of 0.4 kmol ha–1 yr–1, yielded a CL of 1.20 kmol ha–1 yr–1
. This valueis above the maximum of the range of calculated CL(N) values for the Speuld site by Reynolds et
al. (1998) who reported a minimum of 0.47 and a maximum
of 1.04 kmol ha–1 yr–1, with the same value of 0.4 kmol ha– 1 yr–1 as critical N leaching. This range was caused by uncertainties in tree uptake due to a wide range of possible values based on the use of the nutrient limitation method of calculating this term.
MODEL ADAPTATIONS AND APPLICATION
To make an objective comparison between the SMART2 and MERLIN applications, a few adaptations to both models
were made. A response function between N concentration in foliage and in soil water according to Eqn. (9) was included in SMART2 to get a more direct coupling between the two characteristics. To calculate two entire growth cycles, whole tree harvesting was included in SMART2 by adding an amount of N and base cations in debris to the amount of N and base cations in litter. Foliar uptake of nitrogen was included in MERLIN as a fraction (10%) of total deposition. For this analysis of dynamic critical loads, existing applications of both models on the Speuld site were used (Tiktak et al., 1995; Tietema et al., 1998). To minimise the effects of differences in data used by both models, the input data for both models were tuned. The hydrology was constant during the whole period. In both models, a precipitation surplus of 216 mm yr–1 was used as input, based on measurements of precipitation and modelled evapo-transpiration (Belmans et al., 1983; Van der Salm et al., 1998). For both models the N deposition was calculated as
DDT according to Eqn. (6). Litterfall was included as an
input sequence corresponding to the MERLIN application at Speuld (Tietema et al., 1998). The N content in litterfall was estimated at 1.8% in the MERLIN application and 1–2.5% in the SMART2 application depending on N deposition.
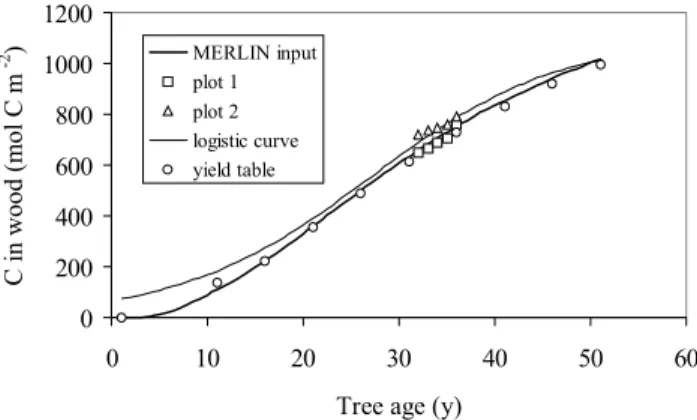
The litter mineralisation rate constant in SMART2 was calibrated to simulate the same litter amounts in 1980 and 1990 as simulated by MERLIN. In SMART2, a logistic growth function for woody biomass was used, based on the fit to a growth curve for Douglas fir given by Jansen et al. (1996). This curve fitted the increase of biomass between 1990 and 1995 at Speuld (Fig. 1). These stem biomass data were derived by regression from yearly diameter and tree height measurements (Steingröver and Jans, 1995; Dik,
0 200 400 600 800 1000 1200 0 10 20 30 40 50 60 Tree age (y)
C in wood (mol C m -2 ) MERLIN input plot 1 plot 2 logistic curve yield table
Fig. 1. Net accumulation of carbon in the trees: yield table results
(Jansen et al. 1996), the logistic growth curve used in SMART2 and the carbon sequence used in MERLIN. In addition, stem biomass data from the Speuld forest between 1990 and 1994 on two different experimental plots are given.
) ( 1 de lecrit de de N fr fr N − =
A. Tietema, J.P. Mol-Dijkstra, J. Kros and W. De Vries
1984). The growth curve refers to the gross increase of biomass, which means that the result of thinning was added to the net increase of biomass. In MERLIN the same curve was used as an input sequence for wood biomass (Fig. 1).
Results and discussion
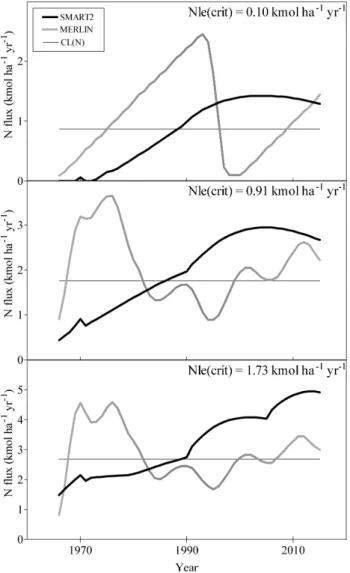
The DDT, calculated by SMART2 and MERLIN differed considerably during the simulation period (Fig. 2). In general, at all three critical leaching levels, MERLIN predicted the highest DDT values (up to 4.6 kmol ha–1 yr–1 or 64 kg N ha–1 yr–1 with 1.73 as criterion for critical leaching level) during the first 15 years of the rotation. Conversely, SMART2 predicted the highest DDT values (up to 4.9 kmol
ha–1 yr–1 or 69 kg N ha–1 yr–1) in the mature 50-year old Douglas fir forest. During most of the rotation time, the predicted DDT values were higher than the corresponding traditional CL(N) (Fig. 2).
The dynamics of the DDT during the rotation depended on the model. The differences between both models could be attributed largely to differences in the timing of N immobilisation in the soil (Fig. 3). In the MERLIN application, net N immobilisation decreased from approximately +1.8 to –1.9 kmol ha–1 yr–1. This decrease in N immobilisation was caused primarily by an increased gross mineralisation rate in the refractory organic matter (ROM) pool that contributed to supplying N for tree growth. During the second half of the rotation, gross mineralisation of ROM decreases again, causing a positive net N immobilisation in the soil (Fig. 3). In general, N dynamics are highly constrained by C dynamics and optimal CN ratios in the vegetation and soil compartments in MERLIN. Both characteristics are input to the model. In the Speuld application they were based on data characteristic of the oak coppice in 1960 and the data collected around 1990 in the Douglas fir forest. The input sequences of C pools between 1960 and 1990 and the optimal CN ratios in 1960
Fig. 2. Dynamic Deposition Threshold (DDT) values predicted by
SMART2 and MERLIN, in relation to the CL(N). The three graphs correspond with different critical N leaching criteria. All graphs with a time sequence start in 1966 to avoid the large fluctuations occurring as a result of clear-cutting and planting the young Douglas firs in the period 1960 – 1965.
Fig. 3. Dynamic Deposition Threshold (DDT), net N accumulation in
the trees (Nupt), net N immobilisation in the soil (Nimm), N leaching (Nlea) and corresponding CL (N) at a critical N leaching level of 0.91 kmol ha-1 yr-1 calculated by MERLIN (above)
and SMART2 (below).The N flux by denitrification (Nde) is calculated by both models as being negligible in this dry sandy soil.
and 1990 were obtained by interpolation, based on the results of the NITREX experiments (Tietema et al., 1998). These experiments showed a very fast reaction of nitrate leaching to a sudden decrease in N deposition. This fast reaction implied a decreased role of N mineralisation from ROM in 1990 and as such it constrained the interpolation of the ROM C sequence. This input sequence was kept constant in this application. In SMART2, net immobilisation in the soil increased steadily from –2.3 to –0.7 kmol ha–1 yr–1 during the rotation (Fig. 3). This increase in net immobilisation is caused solely by a decreased gross mineralisation in litter. In SMART2, it is the mineralisation of N in fresh litter that contributes to the N supply for tree growth. This mineralisation is an autonomous first-order process governed by litterfall, the amount of litter and a mineralisation rate constant. This rate constant was obtained by calibrating to 1980 and 1990 C pool values simulated by MERLIN. However, the temporal pattern of N mineralisation rate between these years is determined purely by litterfall. As with the terms of the CL calculation, the immobilisation term in the soil is the great unknown relative to the other terms. The dynamics of this process is of the utmost importance for analysing DDT values. This generates a relatively weak basis for this DDT calculation, as little is known about the role of the soil in supplying N to fast growing young trees.
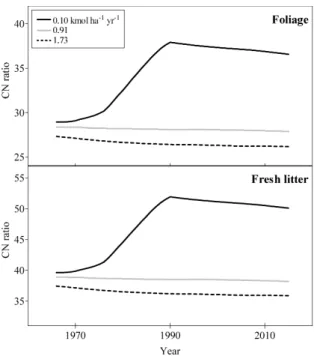
With the lowest critical value of 0.1 kmol ha–1 yr–1, corresponding to the objective to avoid the occurrence of nitrophilous plant species, the ecosystem is kept at a very low level of nitrogen nutrition which means that all nitrogen deposition is retained. The effect of the lack of nitrogen in a growing forest with such a strict leaching criterion can be seen in the dynamics of the CN ratio in all organic N compartments calculated by SMART2 (Fig. 4). The CN ratios in foliage and in litter are higher during most of the simulation period using the 0.10 kmol N ha–1 yr–1 leaching criterion compared to the other criteria. Similar increased CN ratios in the ecosystem compartments — plants, LOM and ROM — are predicted by MERLIN at the lowest critical leaching criterion of 0.10 kmol ha– yr–1 (Fig 5).
The results indicate that the DDT can fluctuate a great deal during a forest rotation. This is not surprising as steady state conditions in semi-natural ecosystems in a rapidly changing global environment are an illusion. The assumption of steady state facilitated the definition of the traditional CL as a relatively easy-to-use, standardised measure of critical loads of pollutants in the long term. On a short time scale, the steady state approach may not be appropriate, especially when focussing on (i) set intermediate goals (target loads) and (ii) performing conservation management.
Fig. 4. CN ratios of the ecosystem compartments foliage and litter,
calculated by SMART2 at three different levels of critical N leaching (0.10, 0.91 and 1.73 kmol ha-1 yr-1).
.
Fig. 5. CN ratios of the ecosystem compartments plants, LOM and
ROM, calculated by MERLIN at three different levels of critical N leaching (0.10, 0.91 and 1.73 kmol ha-1 yr-1).
A. Tietema, J.P. Mol-Dijkstra, J. Kros and W. De Vries
During most of the time, the DDT is higher than the traditional CL calculated with the mass balance approach. Despite its uncertainties, the presented method of analysing temporal patterns in CL load may be of great importance in evaluating the effects of management on the CL. In this study deposition was optimised with a criterion of nitrate leaching. With the same approach, it is possible to optimise, for instance, plant uptake within an actual deposition scenario. Plant uptake can be influenced by various forest management options such as fertilisation and thinning.
Acknowledgements
This work was funded by the Dutch National Programme on Nitrogen and supported by the EU (Project EVK1-1999-00011).
References
Belmans, C., Wesseling, J.G. and Feddes, R.A., 1983. Simulation model of the water balance of a cropped soil providing different types of boundary conditions: SWATRE. J. Hydrol., 63, 27– 286.
Cosby, B.J., Ferrier, R.C., Jenkins, A., Emmett, B.A., Wright, R.F. and Tietema, A., 1997. Modelling the ecosystem effects of nitrogen deposition: Model of Ecosystem Retention and Loss of Inorganic Nitrogen (MERLIN). Hydrol. Earth Syst. Sci., 1, 137–158.
De Vries, W., 1993. Average critical loads for nitrogen and sulphur and its use in acidification abatement policy in the Netherlands.
Water Air Soil Pollut. 68, 399–434.
De Vries, W., 1996. Critical loads for acidity and nitrogen for
dutch forests on a 1 km x 1 km grid. Wageningen, the
Netherlands, DLO Winand Staring Centre for Integrated Land, Soil and Water Research, report 113, 44 pp.
De Vries, W. and Leeters, E.E.J.M., 2001. Chemical composition
of the humus layer, mineral soil and soil solution of 150 forest stands in the Netherlands in 1990. Wageningen, Alterra, Green
World Research. Alterra-Report 424.1. 113 pp.
De Vries, W., Reinds, G.J., van Dobben, H., de Zwart, D., Posch, M., Voogd, J.C.H., Auee, J. and Vel, E.M., 2002. Intensive
Monitoring of Forest Ecosystems in Europe. Technical Report 2002. UN/ECE and EC, Geneva and Brussels, Forest Intensive
Monitoring Coordinating Institute, 146 pp (in press).
Dik, E.J., 1984. De schatting van het houtvolume van staande
bomen van een aantal in de bosbouw gebruikte soorten (in Dutch). Uitvoerig verslag Band 19, nr 1. Rijksinstituut voor
onderzoek in de bos- en landschapsbouw ‘De Dorschkamp’, Wageningen, The Netherlands. 114 pp.
Erisman, J.W. and Bleeker, A., 1997. Emission, concentration and deposition of acidifying substances. In: Acid atmospheric
deposition and its effects on terrestrial ecosystems in the Netherlands, G.J. Heij and J.W. Erisman (Eds.), Studies in environmental Sciences, 69. Elsevier. Amsterdam, The
Netherlands. 21–81.
Erisman, J.W., Draaiers, G.P.J., Steingröver E.G., van Dijk, H.F.G., Boxman, A.W. and De Vries, W., 1998. Assessment of the exposure and loads of acidifying and eutrophying pollutants and ozone, as well their harmful influence on the vitality of the trees and the Speulder forest as a whole. Water Air Soil Pollut. 105, 539–571.
Green, R.N., Trowbridge, R.L. and Klinka, K., 1993. Towards a taxonomic classification of humus forms. Forest Science
Monograph 26. 49 pp.
Grennfelt, P. and Thörnelöf, E., 1992. Critical loads for nitrogen. NORD 1992:41, Nordic Council of Ministers, Copenhagen. 428 pp.
Jansen, J.J., Sevenster, J. and Faber, P.J., 1996. Opbrengsttabellen
voor belangrijke boomsoorten in Nederland (in Dutch). IBN rapport 221. IBN-DLO, Wageningen, The Netherlands. 202 pp.
Koopmans, C.J., Lubrecht, W.C. and Tietema, A., 1995. Nitrogen transformations in two nitrogen saturated forest ecosystems subjected to an experimental decrease in nitrogen deposition.
Plant Soil 175, 205–218.
Kros, J., Reinds, G.J., de Vries, W., Latour, J.B. and Bollen, M.J.S., 1995. Modelling soil acidity and nitrogen availability in natural
ecosystems in response to changes in acid deposition and hydrology. Report 95. Winand Staring Centre, Wageningen,
Netherlands. 90 pp.
Mol-Dijkstra, J.P., Kros, J. and van der Salm, C., 1998. Comparison of simulated forest soil response to acid deposition reduction with two models of differing complexity. Hydrol. Earth Syst.
Sci. 2, 473–483.
Leeters, E.E.J.M., Hartholt, H., de Vries, W. and Boumans, L.J.M., 1994. Effects of acid deposition on 150 forest stands in the
Netherlands. Relationships between deposition level, stand and site characteristics and the chemical composition of needles, mineral soil, soil solution and groundwater. Report 69.4, DLO
Winand Staring Centre, Wageningen, The Netherlands. 156 pp. Nilsson, J. and Grennfelt, P., (Eds.) 1988. Critical loads for sulphur
and nitrogen. Report from a Workshop held at Skokloster,
Sweden, March 19-24, 1988. Miljø rapport 1988: 15. Nordic Council of Ministers, Copenhagen, Denmark. 418 pp. Pardo, L.H. and Driscoll, C.T., 1996. Critical loads for nitrogen
deposition: case studies at two northern hardwood forests. Water,
Air Soil Pollut. 89, 105–218.
Posch, M., de Smet, P.A.M., Hettelingh, J.P. and Downing, R.J., 1995. Calculation and mapping of critical thresholds in Europe:
Status report 1995, RIVM report No. 259101004, RIVM,
Bilthoven Netherlands. 198 pp.
Reynolds, B., Wilson, E.J. and Emmett, B.A., 1998. Evaluating critical loads of nutrient nitrogen and acidity for terrestrial systems using ecosystem-scale experiments (NITREX). Forest
Ecol. Manage. 101, 81–94.
Steingröver, E.G. and Jans, W.W.P., 1995. Physiology of
forest-grown Douglas-fir trees effects of air pollution and drought.
Report 793315-03 RIVM, Bilthoven, The Netherlands. 78 pp. Sverdrup, H., De Vries, W. and Henriksen, A., 1990. Mapping
critical loads. A guidance manual to criteria, calculation methods data collection and mapping. Miljø rapport 1990: 14.
Nordic Council of Ministers, Copenhagen. 124 pp.
Tiktak, A., van Grinsven, J.J.M., Groenenberg, J.E., van Heerden, C., Janssen, P.H.M., Kros, J., Mohren, G.M.J., van der Salm, C., van de Veen, J.R. and De Vries, W., 1995. Application of
three forest-soil-atmosphere models to the Speuld experimental forest. RIVM, Report no. 733001003, Bilthoven, Netherlands.
95 pp.
Tietema, A., Emmett, B.A. and Cosby, B.J., 1998. Applying MERLIN for modelling nitrate leaching in a nitrogen saturated Douglas fir forest in the Netherlands after decreased atmospheric nitrogen input. Hydrol. Earth Syst. Sci. 2, 431–438.
Van der Salm, C., Groenenberg, E.J. and Boxman, A.W., 1998. Modelling the response of soil and soil solution chemistry upon roofing a forest in an area with high nitrogen deposition. Hydrol.