HAL Id: hal-00297018
https://hal.archives-ouvertes.fr/hal-00297018
Submitted on 4 Jul 2007
HAL is a multi-disciplinary open access
archive for the deposit and dissemination of
sci-entific research documents, whether they are
pub-lished or not. The documents may come from
teaching and research institutions in France or
abroad, or from public or private research centers.
L’archive ouverte pluridisciplinaire HAL, est
destinée au dépôt et à la diffusion de documents
scientifiques de niveau recherche, publiés ou non,
émanant des établissements d’enseignement et de
recherche français ou étrangers, des laboratoires
publics ou privés.
Reflectance spectroscopy of indoor settled dust in Tel
Aviv, Israel: comparison between the spring and the
summer seasons
A. A. Chudnovsky, E. Ben-Dor, H. Saaroni
To cite this version:
A. A. Chudnovsky, E. Ben-Dor, H. Saaroni. Reflectance spectroscopy of indoor settled dust in Tel
Aviv, Israel: comparison between the spring and the summer seasons. Advances in Geosciences,
European Geosciences Union, 2007, 12, pp.51-57. �hal-00297018�
www.adv-geosci.net/12/51/2007/ © Author(s) 2007. This work is licensed under a Creative Commons License.
Geosciences
Reflectance spectroscopy of indoor settled dust in Tel Aviv, Israel:
comparison between the spring and the summer seasons
A. A. Chudnovsky1, E. Ben-Dor1, and H. Saaroni2
1Remote Sensing and GIS Laboratory, Department of Geography and the Human Environment, Tel-Aviv University, Israel 2Unit for Applied Climatology and Environmental Aspects, Department of Geography and the Human Environment, Tel-Aviv
University, Israel
Received: 16 February 2007 – Revised: 27 May 2007 – Accepted: 26 June 2007 – Published: 4 July 2007
Abstract. The influence of mineral and anthropogenic dust
components on the VIS-NIR-SWIR spectral reflectance of artificial laboratory dust mixtures was evaluated and used in combination with Partial Least Squares (PLS) regression to construct a model that correlates the dust content with its re-flectance. Small amounts of dust (0.018–0.33 mg/cm2)were collected using glass traps placed in different indoor envi-ronments in Tel Aviv, Israel during the spring and summer of 2005. The constructed model was applied to reflectance spectroscopy measurements derived from the field dust ples to assess their mineral content. Additionally, field sam-ples were examined using Principal Component Analysis (PCA) to identify the most representative spectral pattern for each season. Across the visible range of spectra two main spectral shapes were observed, convex and concave, though spectra exhibiting hybrid shapes were also seen. Spectra de-rived from spring season dust samples were characterized mostly by a convex shape, which indicates a high mineral content. In contrast, the spectra generated from summer samples were characterized generally by a concave shape, which indicates a high organic matter content. In addition to this seasonal variation in spectral patterns, spectral dif-ferences were observed associated with the dwelling posi-tion in the city. Samples collected in the city center showed higher organic content, whereas samples taken from loca-tions at the city margins, near the sea and next to open areas, exhibited higher mineral content. We conclude that mineral components originating in the outdoor environment influence indoor dust loads, even when considering relatively small amounts of indoor settled dust. The sensitive spectral-based method developed here has potentially many applications for environmental researchers and policy makers concerned with dust pollution.
Correspondence to: A. A. Chudnovsky
(chudnovs@post.tau.ac.il)
1 Introduction
To date, when considering health problems related to dust ex-posure, the focus has been on dust inhalation, due to dust sus-pended in the air, whereas contact with settled (or sediment) dust has been largely ignored. However, exposure to cer-tain types of settled dust and its associated contaminant load can be detrimental to human health, and has been associated with various pathologies, including systemic poisoning, hard metal disease, several irritations, nasal obstruction, eye prob-lems, infections, and dermatological aberrations (Maertens et al., 2004). Children, who tend to play or crawl on the floor and place objects in their mouths that have been in in-timate contact with dusty floors, are particularly at risk from such health complications. In certain environments, airborne particles and settled dust are especially undesirable, as they constitute contaminants that interfere with the activities con-ducted in these environments (Morawska and Salthammer, 2004). For example, in medical facilities a lack of cleanli-ness can endanger the lives of patients, and in facilities where electronic equipment is manufactured the presence of any form of dust contamination disturbs significantly the product quality. More generally, the composition of indoor settled dust, in addition to reflecting the degradation of indoor mate-rials, is a key indicator of air pollution (Vallack and Shillito 1998; Shneider, 2004). Thus, in order to regulate effectively polluting emissions, policy makers need accurate informa-tion regarding indoor settled dust and specifically how its composition reflects the outdoor environment.
Outdoor particles infiltrate into the indoor environment and have been shown to contribute significantly to indoor dust loads (Riley et al., 2002). In the outdoor environment natural sources of dust particles include sand, clay, soil, or-ganic materials, pollen, forest fire emissions and volcanic debris. Anthropogenic sources of dust include fossil fuel combustion (e.g., coal, oil), wood combustion, waste in-cineration and a variety of industrial processes (e.g., iron
52 A. A. Chudnovsky et al.: Reflectance spectroscopy of indoor settled dust in Tel Aviv founding, construction). In the indoor environment, in
addi-tion to the particles from natural and anthropogenic outside sources, there are particles from skin, hair, mites, clothing fibers and furnishings, cooking emissions, bacteria, smoke residuals, cleaning products, organic acids, building materi-als, and from a multitude of other materials present or uti-lized indoors (Roberts et al., 1992). The myriad indoor and outdoor sources of settled indoor dust result in a complex mixture, which is extremely heterogeneous, varying from place to place and across time. This heterogeneity is reflected by the diverse sizes, shapes, composition, chemistry and con-centration of indoor dust particles. Accordingly, the compo-sition of settled house dust can differ not only among geo-graphic locations, but even between rooms of a single house (Lioy et al., 2002; Morawska and Salthammer, 2004).
Summarily, the level and composition of indoor settled dust is affected by outdoor environment characteristics, in-door activity, and life patterns. Discerning accurately what influences the composition of indoor settled dust has become an urgent goal for both environmental researchers and pol-icy makers. A large variety of field techniques for assessing settled dust have been described in the literature. Recently, Chudnovsky et al. (2007) developed a new spectral-based method for assessing quantitatively and accurately small amounts of dust (from 0.018–0.45 mg/cm2). For any given sample, its Visible-Near Infrared-Short Wave Infrared (VIS-NIR-SWIR) spectrum (400–2400 nm) contains invaluable di-agnostic information concerning both organic and inorganic constituents, making reflectance spectroscopy a promising tool for environmental research. Nevertheless, before the work of Chudnovsky et al. (2007) very few studies had used reflectance spectroscopy for assessing settled dust and those few dealt only with large amounts of settled dust to ensure measurement of strong spectral responses (Ong et al., 2003; Arimoto et al., 2002, and a research study conducted by the United States Geological Survey in collaboration with NASA, http:/greenwood.cr.usgs.gov). Chudnovsky’s method combines reflectance measurements with multivariate regres-sion analysis. When the method was applied to analyze in-door dust samples collected during the spring, it was found that samples could be categorized into two types according to their spectral shape: (type A) a convex slope across the VIS due to significant mineral content, which was mostly representative of dwellings, and (type B) a concave slope across the VIS due to dominant anthropogenic/organic con-tent, mostly representative of office environments (Chud-novsky and Ben Dor, 2007). In this study, the new spectral-based method is used to evaluate in detail the influence of outdoor environmental conditions on indoor settled dust col-lected from dwellings in Tel-Aviv, Israel.
Other studies have addressed more generally the environ-mental impact of dust storms on daily life. The negative consequences of dust deposition include urban air pollution, biodiversity reduction, as well as sand encroachment on pro-ductive land, human settlements and infrastructure. It is
es-timated that between 30 and 50% of indoor floor dust is de-rived from soils (Fergusson and Kim, 1991). Here, in or-der to gain a more quantitative unor-derstanding of how dust storms affect indoor dust, we compare the spectral behavior of indoor settled dust collected during two seasons, the spring (which are associated with dust storms) and the summer.
2 Method
2.1 Dust traps and spectral measurements
We have found that the optimal configuration for a dust trap is a glass disk (2 mm thick) with a black carbon background placed underneath. This configuration maximizes the capac-ity to detect meaningful spectral characteristics due to the dust mixture resting on the glass. Spectral measurements were recorded for each glass trap before and after dust ex-posure to enable precise identification of dust-related spec-tral changes. Dust samples were scanned by the Analytical Spectral Devices FieldSpec Pro (ASD 2001) spectrometer, which has a large spectral range (350–2500 nm). The contact probe (“potato”) device was attached to the dust sample. The “potato” was set on a stable tripod base and maintained in a constant position at a nadir-looking angle. BaSO4powder
in the same geometry was used as a white reference to en-able conversion of the measurement data into reflectance val-ues. In addition, the gravimetric weight of each dust trap was measured using a sensitive analytical scale (Mettler AE163), with a precision of 0.01 mg.
2.2 Location of dust traps
Two field experiments of one month length were conducted, the first during the spring (April 2005) and the second dur-ing the summer (August 2005). The dust traps were placed in similar locations during the spring and the summer sea-sons, but in the summer experiment more dwellings were under study. Forty-five residential dwellings from the north-ern and central parts of Tel Aviv were sampled during April 2005, and one hundred and thirty-five residential dwellings were sampled during August 2005. The traps (2–4 in each dwelling) were placed on flat surfaces (tables, shelves, and boxes) at a height of 1.3 m above the floor, at least 0.5 m away from large electrical appliances, and positioned so that the column of air above the sampling surface was unob-structed (Edwards et al., 1998). Additionally, several traps were placed outdoors.
2.3 Study period
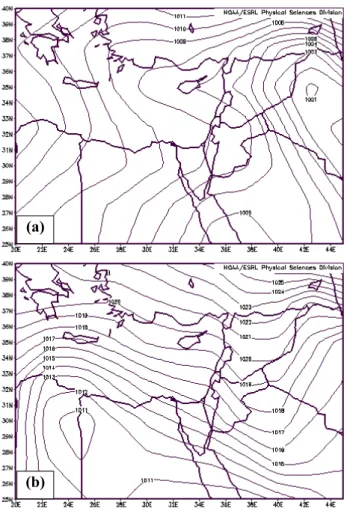
During the summer months in Israel the lower atmospheric levels are dominated by a synoptic system known as the “Persian Trough”, which is associated with persistent north-westerly, Etesian winds (Alpert et al., 1990; Saaroni and Ziv, 2000; Ziv et al., 2004). Figure 1a presents the average
sea level pressure (SLP) map for August 2005, indicating a Persian Trough with a northwesterly flow. In contrast, the spring season is characterized by transient systems including the “Sharav” cyclones that move eastward along the North African coast and are responsible for severe dust events over the Eastern Mediterranean (Alpert and Ziv, 1989). During April 2005 five dust storms swept across Israel mostly as a result of “Sharav” cyclones (30–31 March, 6–7 April, 11–12 April, 17–18 April, and 22 April). An average of 9.3 dusty days was recorded during the sampling period of April 2005. Figure 1b presents the average SLP map for 7 April 2005, showing a “Sharav” cyclone located over western Egypt and a warm sector of the cyclone over Israel, which resulted in south-easterly winds that transported the dust to Israel. 2.4 Laboratory spectral assessment of the dust source In order to create reference dust samples that reveal the spec-tral influence of anthropogenically generated materials on natural substances, we constructed artificial mixtures of dust and soot. We added known amounts of soot to a certain amount of dust (collected after a dust storm), to produce mixtures with 25, 50, and 75% soot content. Very small amounts of each mixture were spread homogeneously and gently above a glass trap. Before and after the dust was spread, these four glass traps were weighed and spectral mea-surements taken (see Sect. 2.5).
2.5 Data analyses
For spectral analyses of small amounts of dust, we used the Difference Index (DI) (Chudnovsky et al., 2007). Difference Index (DI) spectra were calculated for each waveband, as follows:
DI(λ)=Brad(λ)−Bbackground(λ), (1)
where Brad(λ) is the reflectance of the dust plus the
re-flectance of the glass disk, plus the rere-flectance of the black carbon background and where Bbackground(λ)is the reflectance
of the clean glass disk plus that of the black carbon back-ground.
To analyze and compare the spectra of samples collected during the two seasons, we employed two methods: Partial Least Squares (PLS) regression and Principal Component Analysis (PCA). All data management, calculations, PLS and PCA analyses were performed using Unscrambler soft-ware, Version 9.1 (Camo, Norway 2004).
PLS Regression: A PLS model was calculated using the laboratory mixtures with total mineral content (100, 75, 50, 25, and 0%) and correlated with VIS-NIR-SWIR spectra: Y n = A + A1DI1+A2DI2+A3DI3... + AnDIn, (2)
where Yn is the mineral content of the artificial dust sample, Ai are empirical coefficients, and DIi is the DI spectral
re-flectance at a specific wavelength. Statistical parameters for
(a)
a
(b)
Fig. 1. Sea level pressure (a) averaged over August 2005 and (b) for
7 April 2005, based on the NCEP-NCAR CDAS-1 archive (Kalnay et al., 1996; Kistler et al., 2001).
the model were calculated by leave-one-out-cross-validation (only one sample at a time is kept out of the calibration and used for prediction) (Adams, 1995). The constructed model was run on the two field data sets (spring and summer sets) to assess the presence or absence of mineral content among dif-ferent indoor dust samples. For each data set, the “center of gravity” (CG, or the mean center of both the X- and Y axes) of a predicted values distribution was calculated (Lloyd and Dicken, 1972).
Principal Component Analyses (PCA): DI spectra of sam-ples from both field data sets were examined by PCA to dif-ferentiate the dust composition between the seasons. PCA transforms the original independent variables (wavelengths) into new axes, or principal components (PCs). These PCs are orthogonal, so that the datasets presented on these axes are uncorrelated with each other (Esbensen, 2002). The spec-tral patterns derived using PCA provide information about the characteristic peaks, indicating which are the most sig-nificant ones when discriminating dust samples according to season.
54 A. A. Chudnovsky et al.: Reflectance spectroscopy of indoor settled dust in Tel Aviv
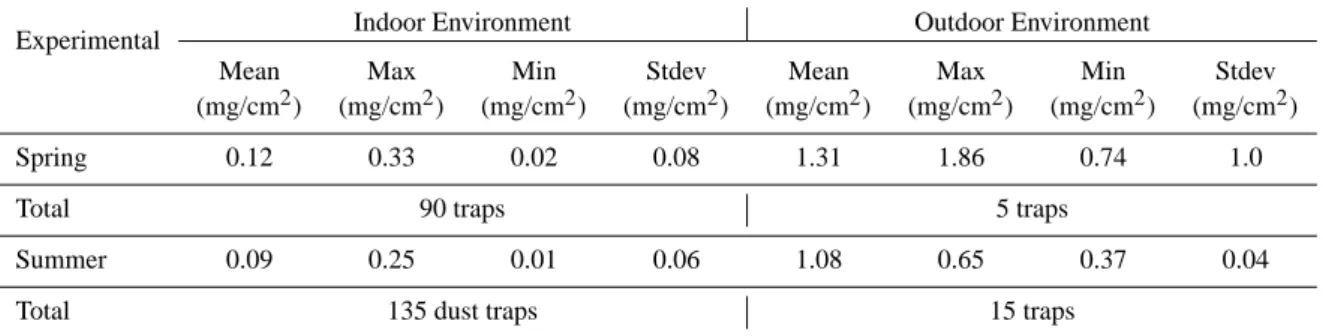
Table 1. Basic statistical parameters describing the amounts of settled indoor and outdoor dust collected during the spring and summer
seasons.
Experimental Indoor Environment Outdoor Environment
Mean Max Min Stdev Mean Max Min Stdev (mg/cm2) (mg/cm2) (mg/cm2) (mg/cm2) (mg/cm2) (mg/cm2) (mg/cm2) (mg/cm2)
Spring 0.12 0.33 0.02 0.08 1.31 1.86 0.74 1.0
Total 90 traps 5 traps
Summer 0.09 0.25 0.01 0.06 1.08 0.65 0.37 0.04
Total 135 dust traps 15 traps
0 0.005 0.01 0.015 0.02 0.025 0.03 0.035 0.04 0.045 400 600 800 1000 1200 1400 1600 1800 2000 2200 2400 Wavelength, nm D I R efl ec tan ce 100 % dust 100 % soot 75 % dust, 25% soot 50 % dust, 50% soot 25 % dust, 75% soot
Fig. 2. Difference reflectance spectra (DI) of constructed artificial
mixtures of dust and soot: 1) 100% dust, 2) 75% dust and 25% coal, 3) 50% dust and 50% coal, 4) 25% dust and 75% coal, and 5) pure coal. 0 0.005 0.01 0.015 0.02 0.025 0.03 0.035 0.04 400 600 800 1000 1200 1400 1600 1800 2000 2200 2400 Wavelenght (nm) D if fe re n ce Re fl ec ta nc e Inde x
High Mineral Content
High Organic Content
Fig. 3. Representative DI spectra of dust samples collected in
vari-ous indoor environments. (a) denotes a spectrum that indicates high mineral content, (b) denotes a spectrum that indicates high organic content.
3 Results
During the spring, the gravimetric weight of an indoor dust sample (90 samples) ranged from 0.02 mg cm−2 to
0.33 mg cm−2, with an average of 0.12 mg cm−2 (Table 1).
During the summer, the gravimetric weight of an indoor dust sample (135 samples) was generally lower, rang-ing from 0.01 mg cm−2 to 0.25 mg cm−2, with an average
of 0.09 mg cm−2. This seasonal difference in indoor dust
load is likely explained by the observed large seasonal disparity in outdoor dust loads resulting from the spring dust storm events. The outdoor dust samples ranged from 0.74 to 1.86 mg cm−2 during the spring and from 0.37 to
0.65 mg cm−2 during the summer (Table 1). These
obser-vations corroborate the general tenet that outdoor dust has a significant effect on the indoor dust environment. Alternative parameters that might be influencing indoor dust deposition loads include anthropogenic activity and crowding. How-ever, the discrepant environmental conditions in the various dwellings (open and closed windows, different indoor activ-ities, etc.) mean it is impossible to conclude unequivocally how these other parameters contribute to quantitative differ-ences in gravimetric weight among samples.
Laboratory and field dust samples: Figure 2 presents the
DI spectra of different kinds of artificial dust mixtures that
were spread above glass traps under controlled laboratory conditions (the total dust loads varied from 1.5 to 2.5 mg). The presence of iron oxides results in elevated reflectance in the red portion of the spectrum (500–700 nm, VIS) and there-fore contributes to a convex shape for the slope appearing in the VIS-NIR spectral region, termed a strong absorption edge. Notably, increasing the soot content of a dust sample converts this slope from a convex to a concave shape between 500 and 1400 nm. Figure 3 shows the spectra of several rep-resentative indoor dust samples from both seasons. In the spectral region from 400–1000 nm, each spectrum exhibits a distinct slope, ranging from convex to concave and including various hybrids of these shapes. These spectral data indi-cate that there are varying amounts of mineral and organic contents in the samples, which is supported by the divergent colors of the indoor dust samples observed during both sea-sons. However in general, gray dust samples were observed mostly during summer (indicating a higher organic content), whereas a shade of red-yellow was prevalent among dust samples during spring (reflecting a higher mineral content).
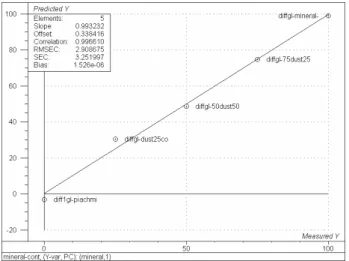
Fig. 4. PLS modeling of mineral content based on artificial
labo-ratory dust mixtures: 1) diffgl-mineral corresponds to 100% min-eral dust, 2) diffgl-75dust-25coal corresponds to 75% dust and 25% coal, 3) 50dust50 relates to 50% dust and 50% coal, 4)
diffgl-dust25 corresponds to 25% dust and 75% coal, and 5) diff1gl-piachmi to pure coal (negative value).
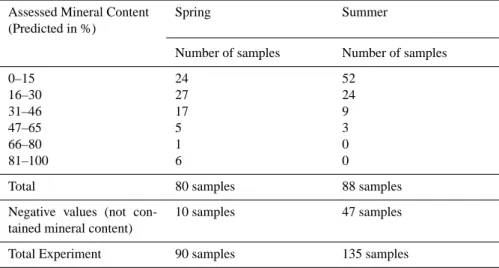
PLS modeling and prediction of mineral content: Figure 4 shows PLS modeling of mineral content based on artificial laboratory dust mixtures. The model provides good precision (R2=0.98 or r=0.99) and accuracy (RMSEP=2.5%), with a slope of 0.96. This model was run on the field data sets; Figs. 5a and b present the predicted mineral contents for the spring and summer samples, respectively. For the spring data set, a prediction could be made for 80 out of the 90 samples; the model gave negative values for the “unpredictable” 10 samples, perhaps indicating the absence of mineral content (not shown in Fig. 5a). The model enabled predictions for 87 out of 135 summer dust samples, and for the remaining 48 samples negative values were received (Fig. 5b, data not shown). The calculated CG values support that the spring samples have higher mineral content (with a mean predicted mineral content of 28.6%), whereas the summer samples ex-hibit lower mineral content (with a mean predicted mineral content of 16.8%; Table 2). Of note, among the summer data set a convex spectral behavior dominates in samples that were located adjacent to the seashore, open areas, and near areas under construction. In contrast, samples located in the city center are characterized by distinctive concave spectral slopes indicative of high soot content.
PCA Analyses: Figure 6 shows the first Principal Com-ponent (PC), which represents a first-order approximation to the “pure” component spectrum. This approximation is use-ful for deciding rationally which absorption peaks are most important in this analysis. In agreement with the results of PLS modeling, a general difference in spectral shape be-tween the two data sets is evident (convex vs. concave across the VIS region), supporting seasonal variance in the mineral
Center Gravity 0 10 20 30 40 50 60 70 80 90 100 110 0 5 10 15 20 25 30 35 40 45 50 55 60 65 70 75 80 85
Indoor Dust Samples
P re d ic te d M in er al C on te n t (%)
Predicted Mineral Content Predicted+STDEV Predicted-STDEV Center Gravity
(a) Spring Center Gravity 0 10 20 30 40 50 60 70 80 90 100 110 0 5 10 15 20 25 30 35 40 45 50 55 60 65 70 75 80 85
Indoor Dust Samples
P re d ic te d M in er al C on te n t (%)
Predicted Predicted+STDEV Predicted-STDEV Center Gravity
(b) Summer
Fig. 5. Predicted mineral contents for spring (upper, a) and summer (lower, b) dust samples with corresponding standard deviations.
0 0.005 0.01 0.015 0.02 0.025 0.03 0.035 400 600 800 1000 1200 1400 1600 1800 2000 2200 2400 Wavelength, nm P C Load in gs Spring Summer
Fig. 6. First PC loading vector according to PCA analyses for each
season.
content of samples. The second PC for both data sets (fig-ure not shown) allows visualization across the SWIR spec-tral region (1100–2400 nm) of the scattering effect due to the assortment of dust particles present in the samples (Chud-novsky et al., 2007), and also confirms differences in spec-tral shape across VIS between seasonal dust samples. In spring, distinctive absorptions appear at 2220 nm, 2340 nm, and 2360 nm, which can be attributed to minerals such as clay and carbonates, respectively (Hunt, 1977). Absorbance
56 A. A. Chudnovsky et al.: Reflectance spectroscopy of indoor settled dust in Tel Aviv
Table 2. Assessed Mineral Content (in %).
Assessed Mineral Content (Predicted in %)
Spring Summer
Number of samples Number of samples 0–15 16–30 31–46 47–65 66–80 81–100 24 27 17 5 1 6 52 24 9 3 0 0
Total 80 samples 88 samples Negative values (not
con-tained mineral content)
10 samples 47 samples
Total Experiment 90 samples 135 samples
at 2200 nm is observed in samples from both seasons. The higher mineral content among summer samples is likely due to the Etesian winds and sea breeze causing sand from the beach to infiltrate indoors. In summary, the data reflects that the five major dust storms, which occurred during the spring data acquisition, influenced the composition of indoor dust, and resulted in a higher mineral content for spring indoor dust samples as compared with summer indoor dust samples.
4 Summary and future applications
Chudnovsky et al. (2007) developed a method based on near infrared reflectance spectroscopy (NIRS) in the 1250– 2400 nm spectral range to examine quantitatively small amounts of sediment dust. They demonstrated that the con-struction of a reliable multivariate calibration model enables precise prediction of a particulate dust sample’s gravimetric weight from its spectral data. In the present study we report that using similar methods it is possible also to assess quanti-tatively the mineral content of a dust sample from its spectral data. Specifically, spectra derived from artificial laboratory dust mixtures were used in combination with PLS regression analysis to generate predicted mineral contents for field dust samples based on their reflectance spectra.
The shape of the spectrum reflects strongly the chemistry of the settled dust sample and was used to characterize the seasonal dust loads. Both the spectral shapes and predicted mineral contents indicate that dust loads in the spring are dif-ferent from those in the summer. During the spring season most samples exhibit a convex spectral shape across the VIS region indicative of higher mineral content, and a concave spectral shape indicative of higher anthropogenic content is seldom observed. The opposite was found in the summer season. These seasonal differences are explained by the
se-vere dust events during the spring season, which do not oc-cur during the summer. Dust load research carried out in Northern China and Africa indicates also that dust sediments can exhibit a high mineral content, likely due to iron oxides, hematite or goethite (Arimoto et al., 2002; Shen et al., 2006); in these studies large amounts of dust collected on bulk filters were analyzed using spectral and chemical methods.
The spectral method developed in this report can poten-tially be applied to measure quantitatively other components within settled dust, such as pollen, soil, asbestos, cement, and iron oxides. For these dust constituents, dust loads of any size have pathological significance, even if the dust never becomes airborne (Morawska and Salthammer, 2004). Al-though pollen and asbestos have unfortunate, wide reach-ing effects on human health, these materials have the ad-vantage of possessing significant spectral fingerprints and therefore represent promising candidates for spectral study. Another potential application of the methods described here is qualitative mapping of the chemical components of set-tled particles; for this multivariate calibration analyses would need to be combined with reflectance spectroscopy. Im-portantly, the methods developed here potentially represent the basis for a system that provides comprehensive spectral-spatial overviews of indoor environments in almost real time. Such a system would require imaging spectroscopy (IS) cam-eras that can determine quantitatively dust levels, and the data generated would be recorded and stored. Therefore the spectral-based technology described here has significant po-tential to bridge the gap between required and existing meth-ods for rapid assessment of indoor dust distribution.
5 Conclusions
It is demonstrated here that reflectance spectroscopy in con-junction with multivariate calibration analysis enables rapid and accurate assessment of settled dust composition, even when monitoring only small amounts of chemical material. The presented optical method is validated to be reliable and has many potential applications. Environmental researchers and policy makers can use the information generated by this method about the nature of dust loads to improve indoor con-ditions and to track dust contamination following environ-mental change.
Acknowledgement. This study was supported by the Israeli Science
Foundation (ISF, grant no. 764/06). We thank all residents and individuals who agreed to participate in the field study experiments.
Edited by: P. Alpert, H. Saaroni, and E. Heifetz Reviewed by: two anonymous referees
References
Adams, M.: Chemometrics in Analytical Spectroscopy, Cambridge, Royal Society of Chemistry, 1995.
Alpert, P., Abramski, R., and Neeman, B. U.: The prevailing sum-mer synoptic system in Israel – subtropical high, not Persian trough, Isr. J. Earth Sci., 39, 93–102, 1990.
Alpert, P. and Ziv, B.: The Sharav Cyclone – Observation and some theoretical considerations, J. Geophys. Res., 94(D15), 18 495– 18 514, 1989.
Arimoto, R., Balsamb, W., and Schloesslina, C.: Visible spec-troscopy of aerosol particles collected on filters: iron-oxide min-erals, Atmos. Environ., 36, 89–96, 2002.
Chudnovsky, A., Ben-Dor, E., and Paz, E.: Using NIRS for rapid assessment of sediment dust in the indoor environment, JNIRS, 15(1), 59–70, 2007.
Chudnovsky, A. and Ben Dor, E.: Reflectance spectroscopy as a tool for settled dust monitoring in office environment, Int. J. En-viron. Waste Manage., special issue on “Urban Air Pollution: Problems, Control Technologies and Management Practices”, ac-cepted, 2007.
Edwards, R., Yurkow, E., and Lioy, P.: Seasonal deposition of housedusts onto household surfaces, Sci. Total Environ., 224(1– 3), 69–80, 1998.
Esbensen, K.: Multivariate Data Analyses, an Introduction to Mul-tivariate Data Analyses and Experimental Design, 5th Edition, Alborg University, CAMO, 2002.
Fergusson, J. and Kim, N.: Trace elements in street and house dusts: sources and speciation, Sci. Total Environ., 100, 125–150, 1991. Kalnay, E., Kanamitsu, M., Kistler, R., Collins, W., Deaven, D., Gandin, L., Iredell, M., Saha, S., White, G., Woollen, J., Zhu, Y., Chelliah, M., Ebisuzaki, W., Higgins, W., Janowiak, J., Mo, K. C., Ropelewski, C., Wang,J., Leetmaa, A., Reynolds, R., Jenne, R., and Joseph, D.: The NCEP/NCAR 40-Year Reanal-ysis Project, B. Am. Meteorol. Soc., 77, 437–471, 1996.
Kistler, R., Kalnay, E., Collins, W., Saha, S., White, G., Woollen, J., Chelliah, M., Ebisuzaki, W., Kanamitsu, M., Kousky, V., van den Dool, H., Jenne, R., and Fiorino, M.: The NCEP/NCAR 50-year reanalysis: Monthly means CD-ROM and documentation, B. Am. Meteorol. Soc., 82, 247–267, 2001.
Lioy, P., Freeman, N., and Millette, J.: Dust: a metric for use in residential and building exposure assessment and source charac-terization, Environ. Health Perspect., 110, 969–983, 2002. Lloyd, P. E. and Dicken, P.: Location in Space: A Theoretical
Ap-proach to Economic Geography, New York, Evanston, San Fran-cisco, and London, Harper & Row, pp. 186–93, 1972.
Maertens, R., Bailey, J., and White, P.: The mutagenic hazards of settled house dust: a review, Mutation Res., 567, 401–425, 2004. Morawska, L. and Salthammer, T.: Fundamentals of Indoor cles and Settled Dust, in: Indoor Environment: Airborne Parti-cles and Settled Dust, edited by: Morawska, L. and Salthammer, T., Germany, WILEY-VCH, 1–46, 2004.
Hunt, G. R.: Spectral signatures of particulate minerals, in the visi-ble and near-infrared, Geophys., 42, 501–513, 1977.
Ong, C. H., Cudahy, T. J., Caccetta, M. S., and Piggott, M. S.: Deriving quantitative dust measurements related to iron ore handling from airborne hyperspectral data, Mining Technology: IMM Transactions section A, 112(3), 158–163(6), 2003. Riley, W. J., McKone, T. M., Lai, A. C. K., and Nazaroff, W.
W.: Indoor particulate matter of outdoor origin: Importance of size-dependent removal mechanisms, Environ. Sci. Technol., 36, p. 1868, 2002.
Roberts, J. W., Budd, W. T., Ruby, M. G., Camann, D. E., Fortmann, R. C., Lewis, R. G., Wallace, L. A., and Spittler, T. M.: Human exposure to pollutants in the floor dust of homes and offices, J. Exposure Analysis & Environ Epidemiology, Suppl. 1, 127–146, 1992.
Saaroni, H. and Ziv, B.: Summer rainfall in a Mediterranean climate – The case of Israel: climatological – dynamical analysis, Int. J. Climatol., 20, 191–209, 2000.
Shen, Z., Cao, J., Zhang, X., Arimoto, R., Ji, J., Balsam, W., Wang, Y., Zhang, R., and Li, X.: Spectroscopic analysis of iron-oxide minerals in aerosol particles from northern China, Sci. Total En-viron., 367, 2–3, 899–907, 2006.
Shneider, T.: Sampling of Surface Dust in Buildings, in: Indoor Environment: Airborne Particles and Settled Dust, edited by: Morawska, L. and Salthammer, T., Germany, WILEY-VCH, pp. 82–104, 2004.
Vallack, H. and Shillito, D.: Suggested Guidelines for Deposited Ambient Dust, Atmos. Environ., 32(16), 2737–2744, 1998. Ziv, B., Saaroni, H., and Alpert, P.: The factors governing the
sum-mer regime of the eastern Mediterranean, Int. J. Climatol., 24, 1859–1871, 2004.