HAL Id: hal-00304621
https://hal.archives-ouvertes.fr/hal-00304621
Submitted on 1 Jan 2001HAL is a multi-disciplinary open access archive for the deposit and dissemination of sci-entific research documents, whether they are pub-lished or not. The documents may come from teaching and research institutions in France or abroad, or from public or private research centers.
L’archive ouverte pluridisciplinaire HAL, est destinée au dépôt et à la diffusion de documents scientifiques de niveau recherche, publiés ou non, émanant des établissements d’enseignement et de recherche français ou étrangers, des laboratoires publics ou privés.
water chemistry in Scotland during the past three
decades
R. Harriman, A. W. Watt, A. E. G. Christie, P. Collen, D. W. Moore, A. G.
Mccartney, E. M. Taylor, J. Watson
To cite this version:
R. Harriman, A. W. Watt, A. E. G. Christie, P. Collen, D. W. Moore, et al.. Interpretation of trends in acidic deposition and surface water chemistry in Scotland during the past three decades. Hydrology and Earth System Sciences Discussions, European Geosciences Union, 2001, 5 (3), pp.407-420. �hal-00304621�
Interpretation of trends in acidic deposition and surface water
chemistry in Scotland during the past three decades
R. Harriman, A.W. Watt, A.E.G. Christie, P. Collen, D.W. Moore, A.G. McCartney,
E.M. Taylor and J. Watson.
FRS - Freshwater Laboratory, Pitlochry, Perthshire, ScotlandPH16 5LB
Email: [email protected]
Abstract
Trends in major ionic components of bulk precipitation were analysed for two sites, Faskally and Loch Ard forest in Scotland, for the period 1972-2000. The pattern of change was not linear. Large reductions in sulphur deposition occurred in the early 1980s and, to a lesser extent, during 1995-2000, with a period of relative stability between 1988-95. pH increased significantly at both sites but nitrate and ammonia only increased significantly at Loch Ard forest. Long- term chemical data from a total of 37 streams and lochs in four selected regions of Scotland were analysed over three time periods (all available data (mostly 1978-2000), 1988-98 and 1995-2000) to match the deposition patterns. For the whole study period a significant decline in non-marine sulphate was found at all sites while the most consistent increases in pH and alkalinity were recorded at all the high elevation loch sites in the Galloway area. Significant reductions in toxic forms of aluminium were also recorded, mostly at sites where pH had increased. Nitrate trends were equivocal except for catchments with clear-felling operations. For these sites, negative trends were found where felling occurred in the 1980s, while positive trends were found at sites with felling in the 1990s. With the exception of one site, dissolved organic carbon concentrations increased significantly with moorland sites showing smaller increases than forested sites. Associated with this change was a significant increase in complexed forms of aluminium. Trends for the 1988-98 period were much smaller than those for the whole study period and in many cases were insignificant. This contrasts with the 1995-2000 period when large and significant reductions in sulphate and nitrate were recorded along with increases in marine salts, probably as a result of climatically related events. Qualitative, experimental and monitoring data from lochs in the Galloway area revealed evidence of recovery of fish populations. Interpretation of chemical and biological trends was clearly influenced by the choice of the time series, especially in relation to deposition and climatic changes. Nevertheless, all the fresh waters included in this study are currently in the best ecological condition since the 1970s in the context of recovery from acidification.
Keywords: deposition, trends, acidification, forestry, recovery, fish, climate
Introduction
In recent years, many countries in the northern hemisphere have introduced legislation to reduce emissions of sulphur (S) and nitrogen (N) compounds. In Europe, the UN-ECE Convention on Long-Range Transboundary Air Pollution (CLRTAP) instigated a series of protocols culminating in Gothenburg in 1999 with the adoption of the protocol to abate acidification, eutrophication and ground-level ozone. As a result of this national and international action, the focus of acidification research is now directed towards an evaluation of emission/deposition relationships and the extent and rate of ecological recovery in terrestrial and aquatic ecosystems.
For fresh waters, there is a widespread recognition of the confounding factors which could influence their response
to reductions in S and N deposition (Jenkins et al., 1998; Jenkins, 1999), especially those linked to climate change and N dynamics. Recent interpretations of chemical trends in lakes and streams, however, have produced conflicting conclusions on the extent of recovery. In the UK, published data from local and regional sites showed positive evidence of recovery in terms of reduced non-marine SO4 (SO4*) and aluminium (Al) concentrations and increased pH and alkalinity (ALK). In Scotland, Harriman et al. (1995) showed a significant increase in pH and alkalinity associated with a decline in SO4* of five continuously monitored lochs in Galloway, south-west Scotland and four upland streams in the Loch Ard study area to the north of Glasgow for the period 1978–1994. Similar, although less significant, improvements were reported by Soulsby et al. (1995) for
stream sites in north-east Scotland. In England, Tipping et al. (1998) compared data for five Lake District lakes between 1971–1973 with 1998 data and showed an increase in pH and alkalinity although these increases were statistically significant for only two of them. They later quantified pH changes in ten streams draining the upper Duddon catchment (southwest Lake District ) over similar time periods and also showed higher nitrate (NO3) and lower SO4 concentrations in five streams but over a different time period (Tipping et al., 2000). Meanwhile, Evans and Jenkins (2000) reported a significant increase in the pH of seven continuously monitored lakes in the south Pennine region of northern England between 1980 and 1998. In Wales, Reynolds et al. (1997) reported a significant decline in SO4* and an increase in pH for the Afon Gwy, an upland moorland stream, between 1980 and 1996. Robson and Neal (1996), however, found no evidence of declining SO4* or increasing pH between 1983 and 1993 in the Afon Hafren, a forested catchment in mid-Wales.
In contrast, the analysis of national and international datasets provides limited evidence of recovery. The 10-year summary report of the UK Acid Waters Monitoring Network (April 1988–March 1998) (Monteith and Evans, 2000) concluded that only three of the 22 monitored sites showed a significant decline in SO4* but at these three sites they found no evidence of increasing pH or alkalinity. This contrasted strongly with the significant decline in these ions in streams in northern Bohemia, one of the most polluted regions of central Europe, especially between 1977–1983, then at a slower rate between 1983-1998 (Peters et al., 1999). In eastern USA, Lynch et al. (2000) reported a significant change in precipitation chemistry between 1983–1994 but between 1995–1997 the decline in SO4 and hydrogen (H) concentration was much greater than predicted from the earlier data. Lakes in this area also showed a decline in SO4 but acid neutralising capacity (ANC) response varied between regions (Stoddard et al., 1998). In a detailed comparison of European and North American data, Stoddard et al. (1999) concluded that only in the UK was there no evidence of declining SO4* concentrations. They also concluded that the trends were stronger in the 1990s than the 1980s for most of Europe and North America.
There are many reasons for this lack of cohesion between published data for UK fresh waters. Reductions in S deposition may follow inconsistent patterns in different parts of the country; small, but real, long-term changes may be masked by large, short-term variability in chemical composition; corrections for marine salts may introduce systematic errors and climatic factors may introduce random variability. Despite the difficulties in quantifying these confounding factors, there appears to be one obvious
difference between the published sets of trend analyses, that is, the time period of the data analysis. In this paper, all long-term chemical data from both stream and loch sites distributed throughout Scotland are brought together to provide an up-to-date assessment of acidification trends in Scottish fresh waters and, for selected sites, the effect of changing the length and periodicity of the time series on the interpretation of these trends is assessed.
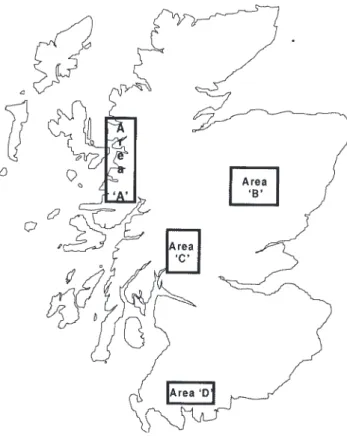
Study sites
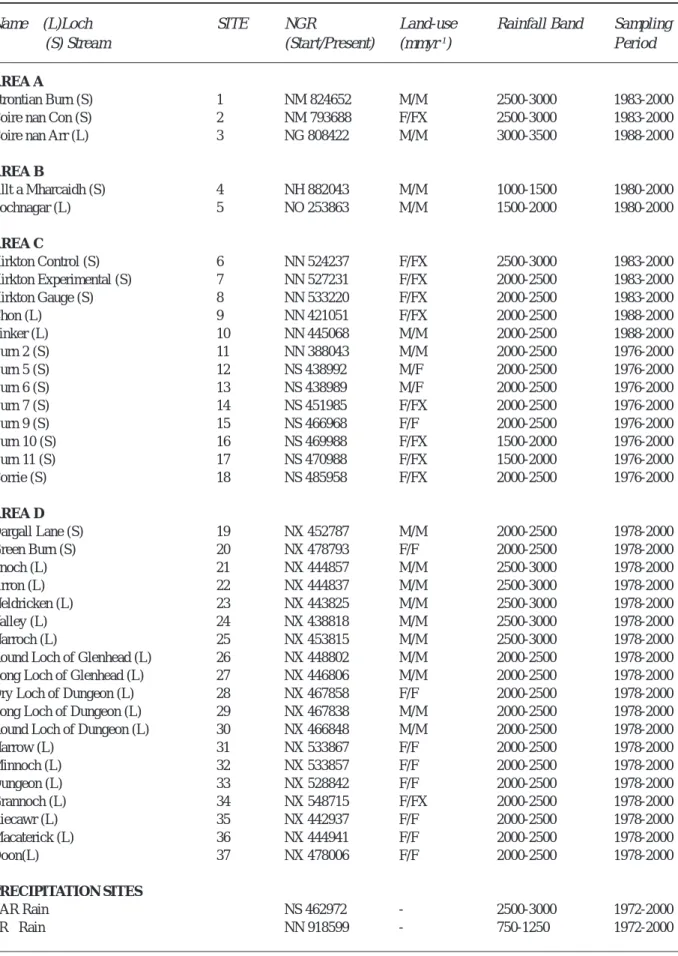
Apart from one site, only sampling sites with chemical data for 15 years or more and whose catchments were unaffected by agricultural activity were included in this analysis. Sites were categorised into four geographical areas: Area A (North West); Area B (East Central); Area C (South Central) and Area D (South West) which also gave a general coverage of the full range of non-marine S deposition in Scotland (Fig.1). A full list of the loch and stream sites in each area is presented in Table 1. Sites which remained as moorland or were planted during the study period were classified as M/ M or M/F respectively, while sites which were forested, or forested then clear-felled, were classified as F/F or F/FX, respectively (see Table 1). Some of the sites were
Fig. 1. Location of Scottish study areas containing long-term
Table 1. Physical properties of Scottish study sites (M = Moorland; F = Forest; FX = Forest plus felling).
Name (L)Loch SITE NGR Land-use Rainfall Band Sampling
(S) Stream (Start/Present) (mmyr-1) Period
AREA A
Strontian Burn (S) 1 NM 824652 M/M 2500-3000 1983-2000
Coire nan Con (S) 2 NM 793688 F/FX 2500-3000 1983-2000
Coire nan Arr (L) 3 NG 808422 M/M 3000-3500 1988-2000
AREA B Allt a Mharcaidh (S) 4 NH 882043 M/M 1000-1500 1980-2000 Lochnagar (L) 5 NO 253863 M/M 1500-2000 1980-2000 AREA C Kirkton Control (S) 6 NN 524237 F/FX 2500-3000 1983-2000 Kirkton Experimental (S) 7 NN 527231 F/FX 2000-2500 1983-2000 Kirkton Gauge (S) 8 NN 533220 F/FX 2000-2500 1983-2000 Chon (L) 9 NN 421051 F/FX 2000-2500 1988-2000 Tinker (L) 10 NN 445068 M/M 2000-2500 1988-2000 Burn 2 (S) 11 NN 388043 M/M 2000-2500 1976-2000 Burn 5 (S) 12 NS 438992 M/F 2000-2500 1976-2000 Burn 6 (S) 13 NS 438989 M/F 2000-2500 1976-2000 Burn 7 (S) 14 NS 451985 F/FX 2000-2500 1976-2000 Burn 9 (S) 15 NS 466968 F/F 2000-2500 1976-2000 Burn 10 (S) 16 NS 469988 F/FX 1500-2000 1976-2000 Burn 11 (S) 17 NS 470988 F/FX 1500-2000 1976-2000 Corrie (S) 18 NS 485958 F/FX 2000-2500 1976-2000 AREA D Dargall Lane (S) 19 NX 452787 M/M 2000-2500 1978-2000 Green Burn (S) 20 NX 478793 F/F 2000-2500 1978-2000 Enoch (L) 21 NX 444857 M/M 2500-3000 1978-2000 Arron (L) 22 NX 444837 M/M 2500-3000 1978-2000 Neldricken (L) 23 NX 443825 M/M 2500-3000 1978-2000 Valley (L) 24 NX 438818 M/M 2500-3000 1978-2000 Narroch (L) 25 NX 453815 M/M 2500-3000 1978-2000
Round Loch of Glenhead (L) 26 NX 448802 M/M 2000-2500 1978-2000
Long Loch of Glenhead (L) 27 NX 446806 M/M 2000-2500 1978-2000
Dry Loch of Dungeon (L) 28 NX 467858 F/F 2000-2500 1978-2000
Long Loch of Dungeon (L) 29 NX 467838 M/M 2000-2500 1978-2000
Round Loch of Dungeon (L) 30 NX 466848 M/M 2000-2500 1978-2000
Harrow (L) 31 NX 533867 F/F 2000-2500 1978-2000 Minnoch (L) 32 NX 533857 F/F 2000-2500 1978-2000 Dungeon (L) 33 NX 528842 F/F 2000-2500 1978-2000 Grannoch (L) 34 NX 548715 F/FX 2000-2500 1978-2000 Riecawr (L) 35 NX 442937 F/F 2000-2500 1978-2000 Macaterick (L) 36 NX 444941 F/F 2000-2500 1978-2000 Doon(L) 37 NX 478006 F/F 2000-2500 1978-2000 PRECIPITATION SITES LAR Rain NS 462972 - 2500-3000 1972-2000 FR Rain NN 918599 - 750-1250 1972-2000
incorporated into the UK Acid Waters Monitoring Network (AWMN) (Patrick et al., 1991) in 1988. Most of the sites are located in the two most acidified areas, C and D, where the most serious biological problems have been reported. Long-term (28 year) trends in deposition chemistry were obtained from two sites, Loch Ard forest (LAR) in Area C and Faskally (FR), between Areas B and C. More detailed descriptions of the sites, including previous acidification studies, have been reported for Area A by Patrick et al. (1995), for Area B by Harriman et al. (1990) and Patrick et al. (1995), for Area C by Harriman and Miller (1996), Harriman and Morrison (1982) and Harriman et al. (1995), and for Area D by Harriman et al. (1987, 1995). Essentially, the majority of the streams and lochs drain catchments dominated by slow weathering granitic, schist or gneiss-type rocks, the main exception being the South Central streams in the Kirkton catchment (Area C) which is underlain with narrow limestone bands, therefore, providing a contrasting assessment of chemical trends in more alkaline waters. Catchment vegetation is typically moorland or moorland with a variable proportion of different age conifer plantation.
Materials and methods
Precipitation samples were collected on either a weekly or two weekly basis at LAR and Faskally (FR). Daily samples were also collected at FR but they were only analysed for pH and conductivity.
The sampling programme for lochs and streams in the four selected areas is summarised below. The S and N deposition information listed below is taken from the 5 km2,
1995-1997 UK deposition database (Smith et al., 2000) Area A (North West)
The two stream sites (1,2) were sampled every two weeks between 1984–2000 and the one loch site (3) every three months between 1988–2000. The 1995–1997 non-marine S and N deposition in this area ranged from 6-12 kg ha-1yr-1 .
Area B (East Central)
The stream site (4) was sampled weekly between 1985– 2000 while the loch site (5) was sampled on a random basis between 1980-1988 and thereafter every three months until 1996 when sampling frequency increased to a two weekly basis. The 1995–1997 non-marine S and N deposition in this area ranged from band 6–12 kg ha-1 yr-1 at site 4 and
12–16 kg ha-1 yr-1 at site 5.
Area C (South Central)
Three streams (6,7,8) were selected in the northern part of this area (Balquhidder) to provide an evaluation of responses in more alkaline catchments. Samples were collected on a weekly or two-weekly basis between 1983–2000. Eight streams (11–18) and two lochs (9,10) were selected from the southern part of this area (Loch Ard) from which stream samples were collected on a weekly or two weekly basis between 1977–2000. Stream 11 was a control site with no forest management in the catchment; streams 12 and 13 initially drained young plantations which are now 25-year old forests; streams 14 and 17 drain catchments which have recently been partially clear-felled; stream 16 was mostly clear-felled in 1988/1989 and replanted while the catchment of stream 15 has both young and mature forest plus headwater source liming of 5% of the upper catchment in 1990. The loch sites were sampled every three months between 1988–2000, one loch catchment (9) being extensively forested and the other (10) essentially moorland. The 1995–1997 non-marine S and N deposition in this area ranged from 20-25 kg ha-1 yr-1.
Area D (South West)
Seventeen loch (21–37) and two stream sites (19,20) were selected in this area from which random dip samples were taken between 1978–1988. Eight of these lochs (21–27,34) and the two streams were consequently sampled on a monthly basis while the remaining lochs were sampled every three months. The 1995–1997 non-marine S and N deposition in this area ranged from 25-35 kg ha-1 yr-1.
Analytical methods for the earlier studies were described by Harriman et al (1987) while more detailed descriptions of pH and aluminium (Al) techniques are described by Harriman et al. (1990). For the past 15 years, the major cations and anions were determined by ion chromatography. The consistency and standard of the chemical analysis has been maintained by participation in the twice-yearly national UKAWMN quality control programme, the annual International Co-operative Programme (ICP) inter-comparison exercise and the AQUACON project, which supports an analytical quality control programme for both precipitation and lake samples and involves nearly 200 international laboratories (e.g . Mosello et al., 1999; Hovind, 1999).
Details of methods used for the statistical analysis of chemical trends have been described by Harriman et al. (1995) but are essentially based on two methods: the Seasonal Kendall Test (SKT), which incorporates seasonal variation and a permutation based linear regression (LR)
method. Ionic contributions from marine sources were calculated using their ratios to chloride (Cl) in sea water, assuming that all Cl was marine derived.
Results and discussion
DEPOSITION TRENDSThe temporal pattern of concentration change in acidity and SO4* at Loch Ard forest (LAR) and FR was very similar with the highest concentrations in the 1970s, coinciding with peak UK emissions of sulphur dioxide (SO2). Thereafter, a sharp decline in the early 1980s was followed by a period of relative stability (1985-1995), then a further downward trend during the last five years of the century (Fig. 2). Although no deposition collectors were located in Area D, the UK Acid Deposition Monitoring Network maintain a site at Eskdalemuir, adjacent to this area, which has measured gaseous and wet deposition since 1986. Trends in SO4* and SO2 concentrations at Eskdalemuir between 1986–1999 (Hayman et al., 2001) followed a similar pattern to the FR and LAR data, although the mean annual decline SO4* of 0.8 µeq l-1 was less than half the change at FR (2.4
µeq l-1) and LAR (2.0 µeq l-1), presumably due to the shorter
period covered by the assessment. The Eskdalemuir data only cover the period from 1986, thereby excluding the previous decade when significant reductions were recorded in the FR and LAR data.
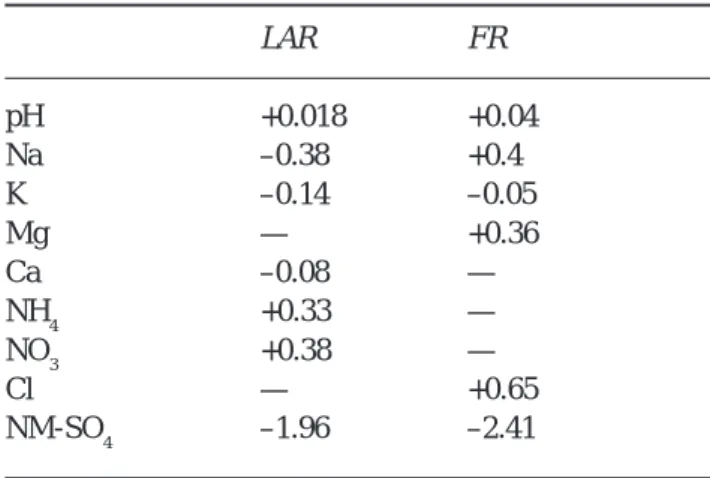
A summary of trends in all major ions for the LAR and FR sites over the 28-year period is given in Table 2. At LAR, pH , NO3 and ammonium (NH4) showed a significant increase while the other ions showed a significant decline
except magnesium (Mg) and Cl which showed no significant change. At FR, no significant changes were recorded in NO3, NH4 and calcium (Ca) while all the other ions showed a significant change, with potassium (K) and SO4 declining and the remaining ions increasing. The median annual decline in H concentration for daily samples at FR was 1.08µeq l-1 (~ 30 µeq l-1 over the 28 year period) compared
with –0.99 µeq l-1 for weekly/two-weekly bulk samples. This
amounts to about 50% of the decline in SO4*.
Another feature of the deposition data is the trend in the sum of non-marine base cations. Despite a non-significant decline over the whole period, a closer look at the data reveals a highly significant decline from 1972–1990 but thereafter a significant increase during the next decade.
Fig. 2. Comparison of weighted annual mean SO4* concentration in LAR rain with SO4* at site
21 (Loch Enoch) in Area D.
Table 2. Annual median trends in chemical variables for LAR and FR bulk deposition. All units as µeq l-1 y-1 except
pH; ‘—’ indicates no significant trend.
LAR FR pH +0.018 +0.04 Na –0.38 +0.4 K –0.14 –0.05 Mg — +0.36 Ca –0.08 — NH4 +0.33 — NO3 +0.38 — Cl — +0.65 NM-SO4 –1.96 –2.41 0 10 20 30 40 50 60 70 80 90 100
Jan-72 Jan-76 Jan-80 Jan-84 Jan-88 Jan-92 Jan-96 Jan-00
Date NM-SO 4 (ueql -1) Loch Enoch LAR Rain
OVERALL TRENDS IN STREAMS AND LOCHS
At all sites and for virtually all determinands any significant trend obtained using the SKT test was matched by a significant LR trend. A preliminary assessment of temporal changes in major ions in the study streams and lochs compared to those in precipitation was made. Only the most sensitive, high elevation lochs in Area D showed a similar pattern of recovery to S deposition, as reflected in SO4* concentrations for site 21 and LAR (Fig. 2). These lochs also exhibited the smallest between-sample variability. Many of the streams in Areas C and D showed similar quantitative chemical trends to these lochs; however, a generally noisy, linear decline was observed rather than a mirroring of the deposition trend shown in Fig. 2. A summary of chemical trends for all 37 sites (16 streams and 21 lochs) is given in Figs. 3 and 4.
TRENDS IN SO4*
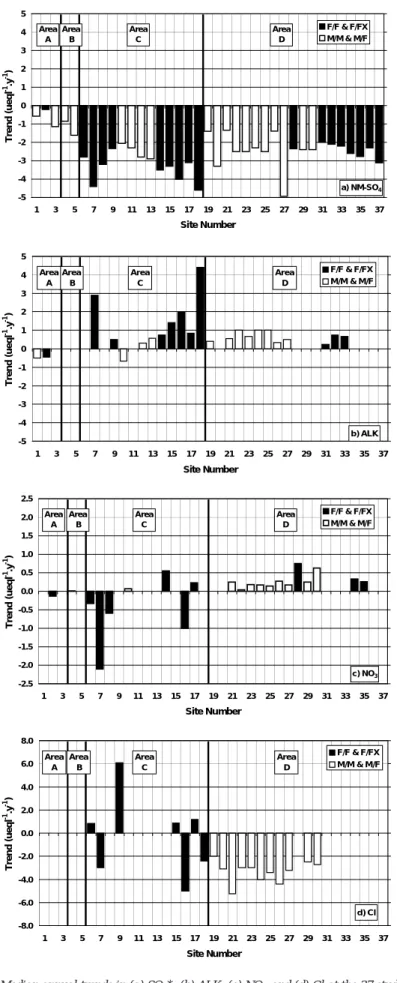
The most striking feature of the SO4 data is that all sites in the four areas show a significant decline in SO4*. The annual mean decline in SO4* was lower in Areas A and B (–0.7 and –1.2 ueq l-1y-1, respectively) than Areas C and D (–3.2
and –2.4 µeq l-1 y-1, respectively). The lower values for Areas
A and B probably reflect the lower deposition, shorter data record (~15 year) and regional differences in deposition changes across Scotland (Fowler and Smith, 2000). The differences between Areas C and D appear to be more subtle. Most of the sites in Area C are stream catchments, the majority of which have been affected by commercial forestry operations. For example, the sites with the greatest change (7,16,18) have been subject to major timber extractions during the study period. By contrast, many of the sites in Area D are loch catchments at relatively high elevation with very patchy, shallow soil cover and devoid of trees. Most of the lower elevation loch catchments are forested, generally with greater soil depth.
Annual median changes in SO4* at high elevation moorland sites in Area D averaged –1.7 µeq l-1 compared
to –2.7 µeq l-1 for lowland forested catchments. This situation
is reflected in the current SO4 concentrations in lochs and streams in Areas C and D where SO4* concentrations in forested catchments are generally around twice the values of those in moorland, high-elevation catchments.
Prechtel et al. (2001) suggest that differences in response to declining S deposition are linked to the size of soil S pools, while Kopácek et al. (2001) presented supporting evidence from detailed S budgets for alpine and forest catchments which indicated that, under current deposition scenarios, the forest catchments with substantial soil cover would take many years to leach the accumulated soil S and
ultimately reach equilibrium conditions.
TRENDS IN PH AND ALKALINITY
There was little evidence of systematic change at sites in Areas A and B. Only one site (1) showed a significant trend in both pH and ALK and that was a negative trend. This situation is not unexpected as changes in SO4* are relatively small in these two areas and because pH is in the 5-6.5 range, any small pH increase would be equivalent to a small ALK increase. In Area C, the four alkaline streams (6,7,8 and 18) showed little evidence of changes in either pH and ALK but the more acid streams (pH 4–5.5) showed a significant increasing trend in both pH or ALK, probably because a small pH change in the acid range is equivalent to a significant change in H. By far the greatest pH change was recorded at site 15; however this catchment had been subject to liming experiments in the early 1990s.
The most consistent evidence of change was from the high elevation lochs in Area D, all of which showed a significant increase in pH and ALK. These sites were acid (pH < 5) and revealed smaller between-sample variability than the streams in Area C. The annual increase in pH averaged 0.015 units and ALK increased by 0.7 µeq l-1 y-1. By comparison,
only three of the nine lochs in forested catchments in this Area showed a significant increase in pH and ALK.
TRENDS IN NITRATE
Although the general conclusion from the deposition data is one of little or no change in the trends for NO3 and NH4, the trends in fresh waters are more variable. In Areas A and B, there was little evidence of any systematic trend with only one site (2) showing a small negative trend and another (4) a small positive trend. In Area C, only streams with clearfelled forest catchments showed significant changes in NO3 concentrations. Those catchments which were subject to felling operations in the early part of the study period showed negative trends (6,7,8,16) while those with recent felling (14,17) show positive trends. A contrasting situation was evident in Area D, where all the lochs in high elevation, moorland catchments experienced increasing NO3 concentrations, averaging 0.17 µeq l-1 y-1. Clearly, this trend
cannot be explained in terms of deposition changes or forest management and the reasons are probably linked to climatic effects as described later.
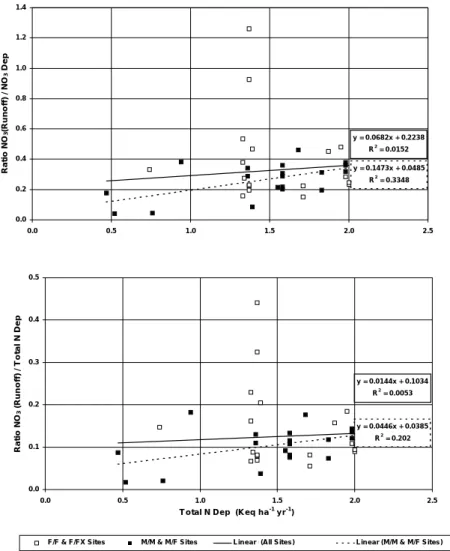
Much of the deposited N is currently immobilised in catchment vegetation and soils. Input/output budgets were calculated for all sites using 1997 data and the relationships between NO3 in run-off and both NO3 deposition and total N (NO3+NH4) deposition are presented in Fig. 5. There is
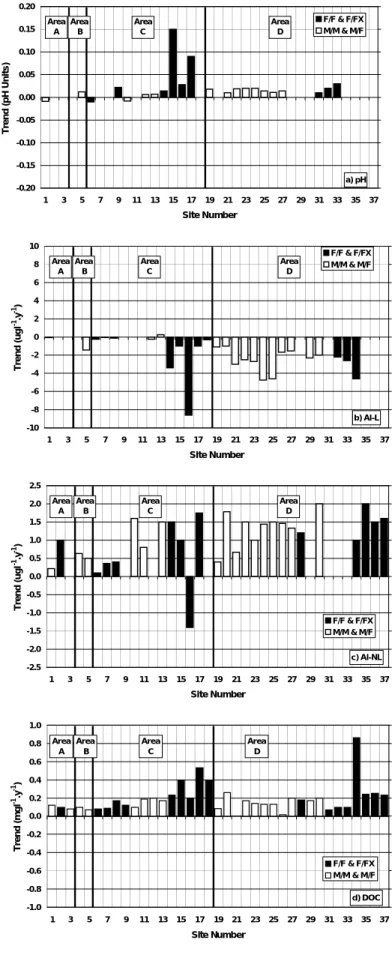
Fig. 3. Median annual trends in (a) SO4*, (b) ALK, (c) NO3 and (d) Cl at the 37 study sites.
= M/M and M/F sites; = F/F and F/ FX sites, see Table 1 for site details).
a) NM-SO4 -5 -4 -3 -2 -1 0 1 2 3 4 5 1 3 5 7 9 11 13 15 17 19 21 23 25 27 29 31 33 35 37 Site Number Trend (ueql -1.y -1) F/F & F/FX M/M & M/F Area B Area C Area D Area A c) NO3 -2.5 -2.0 -1.5 -1.0 -0.5 0.0 0.5 1.0 1.5 2.0 2.5 1 3 5 7 9 11 13 15 17 19 21 23 25 27 29 31 33 35 37 Site Number Trend (ueql -1.y -1) F/F & F/FX M/M & M/F Area B Area C Area D Area A b) ALK -5 -4 -3 -2 -1 0 1 2 3 4 5 1 3 5 7 9 11 13 15 17 19 21 23 25 27 29 31 33 35 37 Site Number Trend (ueql -1.y -1) F/F & F/FX M/M & M/F Area B Area C Area D Area A d) Cl -8.0 -6.0 -4.0 -2.0 0.0 2.0 4.0 6.0 8.0 1 3 5 7 9 11 13 15 17 19 21 23 25 27 29 31 33 35 37 Site Number Trend (ueql -1.y -1) F/F & F/FX M/M & M/F Area B Area C Area D Area A
Fig. 4. Median annual trends in (a) pH, (b) Al-L, (c) Al-NL and (d) DOC at the 37 study sites.
G =M/M and M/F sites, O = F/F and F/ FX sites
a) pH -0.20 -0.15 -0.10 -0.05 0.00 0.05 0.10 0.15 0.20 1 3 5 7 9 11 13 15 17 19 21 23 25 27 29 31 33 35 37 Site Number Trend (pH Units) F/F & F/FX M/M & M/F Area B Area C Area D Area A b) Al-L -10 -8 -6 -4 -2 0 2 4 6 8 10 1 3 5 7 9 11 13 15 17 19 21 23 25 27 29 31 33 35 37 Site Number Trend (ugl -1.y -1) F/F & F/FX M/M & M/F Area B Area C Area D Area A c) Al-NL -2.5 -2.0 -1.5 -1.0 -0.5 0.0 0.5 1.0 1.5 2.0 2.5 1 3 5 7 9 11 13 15 17 19 21 23 25 27 29 31 33 35 37 Site Number Trend (ugl -1.y -1) F/F & F/FX M/M & M/F Area B Area C Area D Area A d) DOC -1.0 -0.8 -0.6 -0.4 -0.2 0.0 0.2 0.4 0.6 0.8 1.0 1 3 5 7 9 11 13 15 17 19 21 23 25 27 29 31 33 35 37 Site Number Trend (mgl -1.y -1) F/F & F/FX M/M & M/F Area B Area C Area D Area A
no significant relationship between these variables when all the data are included; however, when all the forested sites (F/F) are excluded, the significance level increases considerably. Ratios of NO3 losses to total N deposition were below 0.3 when the forested sites were excluded and even when only NO3 deposition was considered, the ratios only reached a maximum of 0.6. Ammonium concentrations in run-off are close to zero; therefore, virtually all of the NH4 component of deposition can be assumed to be retained in the catchments, mostly in plant uptake and immobilisation in soils as organic N. Unfortunately long-term organic N data is unavailable for these sites. Therefore, the effect of increasing DOC on organic N export could not be evaluated.
TRENDS IN LABILE AND NON-LABILE ALUMINIUM AND DISSOLVED ORGANIC CARBON
The majority of sites in all areas showed a significant decline in toxic labile aluminium (Al-L) concentrations. In Areas
A and B, two sites displayed a small but significant decline which site five coincides with an increase in pH. In Area C, the greatest reductions in Al-L were, as would be expected, found in the most acid streams, while the more alkaline streams (>pH 5.5) revealed little change, even though pH increased significantly. In Area D, 14 of the 19 sites exhibited large and significant reductions in Al-L concentrations averaging 2.6 ìgl-1 y-1. In most cases, these
reductions coincided with increased pH.
With the exception of site 21 (the site with the lowest DOC), there was a significant increase in DOC at all sites, concomitant with a significant increase in toxic, non-labile aluminium (Al-NL) levels. Interestingly, many of the sites in Areas C and D showed no significant change in total Al because Al-L decreased significantly while Al-NL increased to a similar extent. Sites with the most highly coloured waters (e.g. sites 14–17 in Area C) generally exhibited the greatest annual changes in DOC. Likewise, the less coloured higher elevation lochs in Area D revealed
Fig. 5. (A) Relationship between the ratio of NO3 run-off/NO3 deposition and total N deposition.
(B) Relationship between the ratio of NO3 run-off/total N deposition and total N deposition.
y = 0 .0 6 8 2 x + 0 .2 2 3 8 R2 = 0 .0 1 5 2 y = 0 .1 4 7 3 x + 0 .0 4 8 5 R2 = 0 .3 3 4 8 0 .0 0 .2 0 .4 0 .6 0 .8 1 .0 1 .2 1 .4 0 .0 0 .5 1 .0 1 .5 2 .0 2 .5 Ra ti o NO 3 (R un of f) / N O 3 De p y = 0 .0 1 4 4 x + 0 .1 0 3 4 R2 = 0 .0 0 5 3 y = 0 .0 4 4 6 x + 0 .0 3 8 5 R2 = 0 .2 0 2 0 .0 0 .1 0 .2 0 .3 0 .4 0 .5 0 .0 0 .5 1 .0 1 .5 2 .0 2 .5 T o ta l N D e p (K e q h a-1 y r-1) Ra ti o NO 3 (R u n o ff) / T o ta l N D e p
smaller mean annual changes (0.16 mg l-1 y-1) in DOC than
the forested, lowland sites (0.20 mg l-1 y-1).
TRENDS IN CHLORIDE AND NON-MARINE BASE CATIONS
Any trends in Cl in Areas A and B were insignificant, probably because of large year-to-year variation and the cyclic pattern of the data, caused when major sea-salt episodes occur at the start, middle and end of the data record. In Area C, trends were inconsistent; where trees had been felled there were (as would be expected) significant negative trends (sites 7,16,18) but the majority of the sites showed no change. In contrast a clear pattern emerged in Area D where all the high elevation, moorland sites showed a declining trend, averaging 3.2 µeq l-1 y-1.
At first glance, the trends in non-marine base cations (NM-BC) appear to be fairly consistent with the majority of sites in all areas showing a significant positive trend. A more detailed look at the data, however, shows many negative values for some of the base cations (Na, Mg) when sea-salt corrections are made. This is especially evident during the late 1980s and early 1990s when sea-salt deposition was relatively high. In addition, the major climatic event (discussed later) between 1995–1997 also resulted in elevated base cation concentrations. In countries such as Scotland, where sea-salt deposition has a major influence on ionic composition, the estimation of NM-BC will invariably be problematic; therefore any conclusions drawn from these trends should be made with caution.
1988-1998 TRENDS
This time series was selected to match with the UK Acid Waters Monitoring Network 10 year analysis reported by Monteith and Evans (2000) and coincided with a period of relative stability in non-marine S deposition. Four sites from Area D were selected for this evaluation (19, 26 and 34), which matched with AWMN sites and site 21 which closely followed the S deposition trend. The results from this analysis closely mirrored those from the AWMN, revealing a much lower significance for many of the parameters than for the full time series. Two of the sites (21,26) showed no significant trend in SO4* even though the trend was highly significant for the full time series. Similarly, with pH and ALK, changes were very small, resulting in significant pH changes without significant ALK changes and vice versa. At site 34, no significant changes occurred in L and Al-NL concentrations, contrary to the significant changes which were recorded for the full time series. At site 19 both pH and Al-L showed significant changes while Al-NL concentrations remained relatively stable. Concentrations
of NO3 increased at all three loch sites but not at the stream site (19).
Overall, the indications were that while small changes were taking place in a number of individual parameters, the signal to noise ratio was too great to classify them as significant.
1995-2000 TRENDS
The pattern of S deposition indicated a significant decline during the last five years of the century and trend analysis for the above four sites (19, 21, 26, 34) indicated that this was the period of greatest change with some reversal of previous trends. Large and significant changes in SO4* were detected at all sites, but only sites 21 and 26 revealed the expected significant increases in pH and ALK with associated decline in Al-L. These same sites showed no change in DOC and Al-NL. At site 34, there was a large and significant decline in Al-L but only a small and insignificant change in pH.
The reversal of previous trends was most evident in NO3 and sea-salt components. There was a relatively large and significant decline in NO3 at all four sites, contrary to deposition trends, while sea-salt derived ions increased at all sites although for site 21 this change was not significant. The data from this period provide the most striking evidence that factors other than deposition changes influence the trends in surface water chemistry.
CLIMATIC EFFECTS ON TRENDS
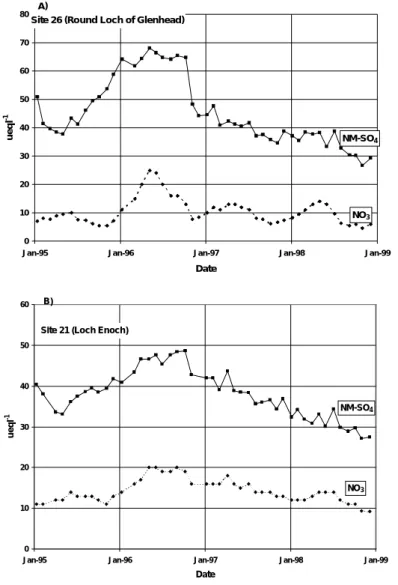
When the chemical trends for all sites and parameters were viewed as a time series, one major event was apparent which affected most of the sites in Scotland and had a profound effect on the interpretation of the trend data. After the very hot and dry summer of 1995, when many upland streams ceased to flow, and following the subsequent wetting of the catchments in the autumn, concentrations of SO4* and NO3 increased by up to twofold and, in some cases, remained high for over 12 months. These increases were probably due to oxidation of organic N and S in the dried-out soils. The effect of this event, which coincided with the latter part of the 1988-1998 trend period and the beginning of the 1995–2000 period, was to accentuate any positive trends in the earlier period and negative trends in the later period, apart from marine derived ions. Two examples of ionic response to this climatic event are shown for sites 21 and 26 in Fig. 6. Both sites show a typical increase then decline in SO4* and NO3 but over different time scales. At site 21, with a long turnover time and very low biological productivity, pre-1995 concentrations were reached after two years while site 26 took only one year to reach parity. Other
climatic influences, especially those linked to the North Atlantic Oscillation, have also been implicated as factors which could effect trends in certain ions such as NO3 and marine salts (Monteith et al., 2000)
BIOLOGICAL RECOVERY
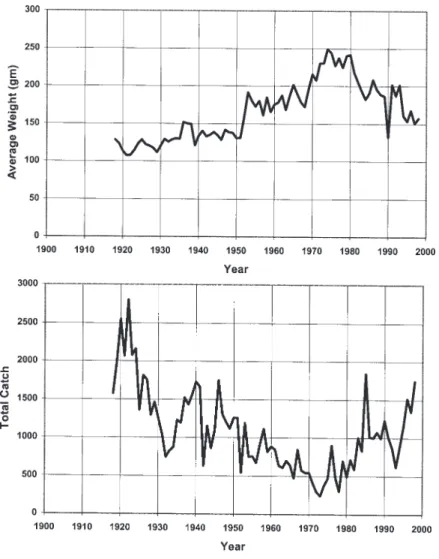
Evidence for biological recovery in Scottish lochs and streams is somewhat tenuous because of the scarcity of long-term data from lochs and large rivers for key indicators such as fish and invertebrates. Nevertheless, much of the qualitative information available (angling records, ad hoc netting of lochs, survival of trout fry and experimental reintroduction of fish) indicate varying degrees of recovery. A unique, 100-year angling catch record for Loch Riecawr in Galloway, collected by Balloch Angling Club, reveals a gradual decline in annual numbers caught by anglers from
the turn of the last century to the 1970s (the peak of acidic deposition in Scotland), followed by an increase up to the end of the century. Catches are now similar to those in the 1930s. Trends in annual mean weight of brown trout show a similar but opposite pattern (Fig. 7) reaching a maximum mean weight in the 1970s. This is one of the few lochs with unbroken catch records based on a constant fishing effort over 100 years. Systematic netting of the other lochs in Area D reveal increasing numbers of trout in recent years while the successful reintroduction of trout into fishless Loch Enoch (Site 21) in 1995 (Collen et al., 2000), followed by the capture of juvenile trout in 2000, indicate that recovery has proceeded to the point where a sustainable trout population has been re-established.
In Area C, large year-to-year variations in fish and invertebrate densities in streams resulted in few trends that could be considered significant, even though juvenile
Fig. 6. Changes in SO4* and NO3 at (A) Round Loch of Glenhead (site 26), and
(B) Loch Enoch (site 21) following the unusually hot, dry summer in 1995.
Site 26 (Round Loch of Glenhead)
0 10 20 30 40 50 60 70 80
Jan-95 Jan-96 Jan-97 Jan-98 Jan-99
Date ueq l -1 A) NM-SO4 NO3
Site 21 (Loch Enoch)
0 10 20 30 40 50 60
Jan-95 Jan-96 Jan-97 Jan-98 Jan-99
Date ue q l -1 NO3 NM-SO4 B)
numbers of trout appeared to increase from time to time. Many of the streams which show patchy recovery are still subject to acid episodes, some of which occur at critical times for juvenile survival. This may explain why consistent and steady recovery is not a persistent feature of the data.
Conclusions
Over the past 30 years, the deposition of SO4* and acidity to Scottish catchments has declined significantly but not linearly. Major step changes occurred in the early 1980s and late 1990s.
Of the 37 sites selected, covering a wide geographical area and large S and N deposition gradient, all showed a significant decline in SO4* concentrations. In Areas C and D, 56% of lochs and streams showed a significant increase in pH while 63% exhibited significant increases in ALK.
High elevation lochs in Area D revealed the smallest sample to sample variation and consequently matched the deposition trend better than streams allowing smaller trends to be detected at higher significance levels.
The strength of recovery varied for the different time-series. Stronger trends were found at most sites when data for the 1978–1988 period were included to cover the period of greatest decline in S deposition. For the 1988–1998 period trends were patchy and frequently insignificant, while large and in some cases opposite trends were found for the 1995– 2000 period. Climatic factors appeared to be a major influence on trends in these two periods.
Forested catchments subject to clear-felling were net exporters of NO3 but the majority of catchments retained at least 70% of deposited total N and 40% of the NO3 component of N deposition.
Biological recovery was evident from qualitative brown
Fig. 7. Long-term trends in annual average weight and annual numbers of brown trout
caught at Loch Riecawr (site 36) (Data provided with permission of Balloch Angling Club, Ayrshire).
trout data in upland lochs in Area D but data from streams was less conclusive, mainly because of their random episodic nature and the difficulties of detecting trends in systems which naturally give noisy chemical and biological signals. Many of the moorland, upland lochs in Area D have recovered in response to S deposition reductions with little or no lag time and have SO4* concentrations only 15–25µeq l-1 above background levels in unpolluted areas.
Forested catchments in Areas C and D appear to be more resistant to recovery in terms of pH and ALK and the inclusion of these sites in the analysis tend to confuse the interpretation of the trends compared to the relatively strong signal from non-forested catchments.
Despite the different recovery signals for different periods during the past 30 years, the indications are that Scottish fresh waters are currently in their best ecological state since the 1970s, in terms of recovery from acidification.
Acknowledgements
The authors wish to thank the many scientists from the Freshwater Fisheries Laboratory who contributed to this work at various stages during the 30-year study period and to the land owners who allowed access to the sites. We are especially grateful to the Forestry Authority for providing long-term access to many of the lochs and streams and also to DETR who, during the past decade, provided support via the Acid Waters Monitoring Network and the Critical Loads Freshwater Group. This paper is an output from the Commission of the European Communities RECOVER: 2010 project (Project EVK1-CT-1999-00018).
References
Collen, P., Harriman, R., Morrison, B.R.S., Keay, E. and Watt, A.W., 2000. Restoration of a brown trout (Salmo Trutta.L) population to Loch Enoch, an acidified loch in Galloway, south-west Scotland. Freshwater Forum, 14, 3–14.
Evans, C.D. and Jenkins, A., 2000. Surface water acidification in the South Pennines II. Temporal trends. Environ. Pollut., 109, 21–34.
Fowler, D. and Smith, R.I., 2000. Spatial and temporal variability in the deposition of acidifying species in the UK between 1986 and 1997. In: UK Acid Waters Monitoring Network 10 year
report, D.T. Monteith and C.D. Evans (Eds.). ENSIS Publishing,
London, 13–27.
Harriman, R. and Miller, J.D., 1996. The effects of forestry
practices on water quality and biota in the Balquhidder catchments 1983–1993. Found. Water Res., Marlow. 73 pp.
Harriman, R. and Morrison, B.R.S., 1982. The ecology of streams draining forested and non-forested catchments in an area of central Scotland subject to acid precipitation. Hydrobiologia.,
88, 251–253.
Harriman, R., Morrison, B.R.S., Caines, L.A., Collen, P. and Watt, A.W., 1987. Long-term changes in fish populations of acid streams in Galloway, South-West Scotland. Water Air. Soil
Pollut., 32, 89–112.
Harriman, R., Gillespie, E., King, D., Watt, A.W., Christie, A.E.G., Cowan, A.A. and Edwards, T., 1990. Short-term ionic responses as indicators of hydrochemical processes in the Allt a’Mharcaidh catchment, western Cairngorms, Scotland. J. Hydrol., 116, 267– 285.
Harriman, R., Morrison, B.R.S., Birks, H.J.B., Christie, A.E.G., Collen, P. and Watt, A.W., 1995. Long-term chemical and biological trends in Scottish streams and lochs. Water Air. Soil.
Pollut., 85, 701–706.
Hayman, G., Vincent, K., Hasler, S., Baker, S., Donovan, B., Smith, M., Sutton, M., Yang, Y.S., Dragosits, U., Love, L., Fowler, D., Sansom, L. and Page, H., 2001. Operation and
Management of the UK Acid Deposition Monitoring Networks.
AEAT/ENV/R/0523, AEA Technology, 42 pp.
Hovind, H., 1999. Intercomparison 9913. ICP Waters Report 51/ 1999. 0-81006, NIVA, Oslo, Norway, 65 pp.
Jenkins, A., 1999. End of the acid reign? Nature., 401, 537–538. Jenkins, A., Helliwell, R.C., Swingewood, P. J., Sefton, C., Renshaw, M. and Ferrier, R.C., 1998. Will reduced sulphur emissions under the second sulphur protocol lead to recovery of acid sensitive sites in the UK?, Environ. Pollut., 99, 309– 318.
Kopácek, J., Veselý, J. and Stuchlik, E., 2001. Sulphur and nitrogen fluxes in the Bohemian Forest and Tatra Mountains during the Industrial Revolution (1850-2000). Hydrol. Earth. Syst. Sci., 5, 391–405.
Lynch, J.A., Bowersox, V.C. and Grimm, J.W., 2000. Acid rain reduced in eastern United States. Environ. Sci. Technol., 34, 940–949.
Monteith, D.T, and Evans C.D., 2000. UK Acid Waters Monitoring
Network - 10 year Report (1988-1998). ENSIS Publishing,
London, 363 pp.
Monteith, D.T., Evans, C.D. and Reynolds, B., 2000. Are temporal variations in the nitrate content of UK upland freshwaters linked to the North Atlantic Oscillation? Hydrol. Process., 14, 1745– 1749 .
Mosello, R., Bianchi, M., Brizzio, M.C., Geiss, H., Leyendecker, W., Marchetto, A., Rembges, D., Tartari, G.A. and Muntau, H., 1999. AQUACON-MedBas Subproject 6. Acid rain analysis. Intercomparison 1/98. Joint Res. Centre European Commission, Rep. EUR 19015 EN, 79 pp.
Patrick, S., Waters, D., Juggins, S. and Jenkins, A., 1991. The
United Kingdom Acid Waters Monitoring Network: Site descriptions and Methodology Report. ENSIS Publishing,
London, 63 pp.
Patrick, S.T., Monteith, D.T. and Jenkins, A., 1995. UK Acid
Waters Monitoring Network: The first five years (April 1988 -March 1993). ENSIS Publishing, London, 364 pp
Peters, N.E., Cerny, J., Havel, M. and Krejci, R., 1999. Temporal trends of bulk precipitation and stream water chemistry (1977-1997) in a small forested area, Krusnehory, northern Bohemia, Czech Republic. Hydrol. Process., 13, 2721–2741.
Prechtel, A., Alewell, C., Armbruster, M., Bittersohl, L., Cullen, J., Evans, C., Helliwell, R., Kopáèek, J., Marchetto, A., Matzner, E., Meesenburg,H., Moldan, F., Moritz, K., Vesely, J. and Wright, R.F., 2001. Response of sulphur dynamics in European catchments to decreasing sulphate deposition. Hydrol. Earth
Syst. Sci., 5, 311–325.
Reynolds, B., Renshaw, M., Sparks, T.H., Crane, S., Hughes, S., Brittain, S.A. and Kennedy, V.H., 1997. Trends and seasonality in stream water chemistry in two moorland catchments of the Upper River Wye, Plynlimon. Hydrol. Earth Syst. Sci., 1, 571– 581.
Robson, A.J. and Neal, C., 1996. Water quality trends at an upland site in Wales, UK, 1983 –1993. Hydrol. Process., 10, 183–203.
Smith, R.I., Fowler, D., Sutton, M.A., Flechard, C.R. and Coyle, M., 2000. Regional estimation of pollutant gas dry deposition in the UK: model description, sensitivity analysis and outputs.
Atmos. Environ., 34, 3757–3777.
Soulsby, C., Turnbull, D., Langan, S.J., Owen, R. and Hirst, D., 1995. Long-term trends in stream chemistry and biology in north-east Scotland: Evidence for recovery. Water. Air. Soil.
Pollut., 85, 689–694.
Stoddard, J.L., Driscoll, C.T., Kahl, J.S. and Kellogg, J.H., 1998. A regional analysis of lake acidification trends for the north-eastern US, 1982-1994. Environ. Monit. Assess., 51, 399–413. Stoddard, J.L., Jeffries, D.S., Lükewille, A., Clair, T.A., Dillon, P.J., Driscoll, C.T., Forsius, M., Johannessen, M., Kahl, J.S., Kellogg, J.H., Kemp, A., Mannio, J., Monteith, D.T., Murdoch,
P.S., Patrick, S., Rebsdorf, A., Skjelkvåle, B.L., Stainton, M.P., Traaen, T., van Dam, H., Webster, K.E., Wieting, J. and Wilander, A., 1999. Regional trends in aquatic recovery from acidification in North America and Europe. Nature, 401, 575– 578.
Tipping, E., Carrick, T.R., Hurley, M.A., James, J.B., Lawlor, A.J., Lofts, S., Rigg, E., Sutcliffe, D.W. and Woof, C., 1998. Reversal of acidification in upland waters of the English Lake District.
Environ. Pollut., 103, 143–151.
Tipping, E., Bettney, R., Hurley, M.A., Isgren, F., James, J.B., Lawlor, A.J., Lofts, S., Rigg, E., Simon, B.M., Smith, E.J. and Woof, C., 2000. Reversal of acidification in tributaries of the River Duddon (English Lake District) between 1970 and 1998.