HAL Id: ird-00504896
https://hal.ird.fr/ird-00504896
Submitted on 23 Jul 2010
HAL is a multi-disciplinary open access archive for the deposit and dissemination of sci-entific research documents, whether they are pub-lished or not. The documents may come from teaching and research institutions in France or abroad, or from public or private research centers.
L’archive ouverte pluridisciplinaire HAL, est destinée au dépôt et à la diffusion de documents scientifiques de niveau recherche, publiés ou non, émanant des établissements d’enseignement et de recherche français ou étrangers, des laboratoires publics ou privés.
High gene flow in oceanic bottlenose dolphins (Tursiops
truncatus) of the North Atlantic
Sophie Quérouil, M. A. Silva, Luis Freitas, R. Prieto, S. Magalhaes, Ana
Dinis, Filipe Alves, J. Matos, Diogo Mendonça, Philip Hammond, et al.
To cite this version:
Sophie Quérouil, M. A. Silva, Luis Freitas, R. Prieto, S. Magalhaes, et al.. High gene flow in oceanic bottlenose dolphins (Tursiops truncatus) of the North Atlantic. Conservation Genetics, Springer Verlag, 2007, 8, pp.1405-1419. �10.1007/s10592-007-9291-5�. �ird-00504896�
High gene flow in oceanic bottlenose dolphins (Tursiops truncatus) of the
North Atlantic
Running title: High gene flow in oceanic bottlenose dolphins
SOPHIE QUÉROUIL1,2,MÓNICA A. SILVA1,3,LUÍS FREITAS4,RUI PRIETO1,SARA MAGALHÃES1,
ANA DINIS4,FILIPE ALVES4, JOSÉ A. MATOS2, DIOGO MENDONÇA2,PHILIP S. HAMMOND3 &
RICARDO S.SANTOS1
1 Instituto do Mar (IMAR), Departamento de Oceanografia e Pescas da Universidade dos Açores, Cais Santa
Cruz, 9901-862 Horta, Portugal.
2 INETI / Departamento de Biotecnologia, Edifício E - 1º andar, Estrada do Paço do Lumiar 22, 1649-038
Lisboa, Portugal.
3 Sea Mammal Research Unit, Gatty Marine Laboratory, University of St. Andrews, St. Andrews KY16 8LB,
Scotland, UK.
4 Museu da Baleia - Município de Machico, Largo Manuel Alves, 9200-032 Caniçal, Madeira, Portugal.
* corresponding author: Sophie Quérouil, IMAR-DOP, Cais Santa Cruz, 9901-862 Horta, Portugal. Tel / Fax: (+351) 292 200 400 / 411; e-mail: squerouil@notes.horta.uac.pt
Key-words: cetaceans, Azores, Madeira, population genetics, ecotypes
Abstract
Despite the openness of the oceanic environment, limited dispersal and tight social structure often induce genetic structuring in marine organisms, even in large animals such as cetaceans. In the bottlenose dolphin, mitochondrial and nuclear DNA analyses have revealed the existence of genetic differentiation between pelagic (or offshore) and coastal (or nearshore) ecotypes in the western North Atlantic, as well as between coastal populations. Because previous studies concentrated on continental margins, we analysed the population structure of bottlenose dolphins in two of the most isolated archipelagos of the North Atlantic: the Azores and Madeira. We analysed 112 samples collected on live animals in the two archipelagos, and nine samples collected on stranded animals in Madeira and mainland Portugal. Genetic analyses consisted in molecular sexing, sequencing of part of the mitochondrial hyper-variable region, and screening of ten microsatellite loci. We predicted that: 1/ there is at least one pelagic and one or more coastal populations in each archipelago; 2/ populations are differentiated between and possibly within archipelagos. Contrary to these predictions, results indicated a lack of population structure in the study area. In addition, comparison with published sequences revealed that the samples from the Azores and Madeira were not significantly differentiated from samples of the pelagic population of the western North Atlantic. Thus, bottlenose dolphins occurring in the pelagic waters of the North Atlantic belong to a large oceanic population, which should be regarded as a single conservation unit. Unlike what is known for coastal populations, oceanic bottlenose dolphins are able to maintain high levels of gene flow.
Introduction
Stock assessment has become an important issue for the conservation and sustainable management of marine ecosystems. The improvement of molecular genetic techniques over the last twenty years enables to identify conservation units on the basis of genetic population structure and dynamics (e.g. Frankham et al. 2002). In the marine environment, barriers to dispersal are few, and one may expect species with high dispersal capacities to demonstrate little population structure. However, recent studies have revealed fine-scale population genetic structure in highly vagile marine organisms such as squids (Shaw et al. 1999) and cods (Knutsen et al. 2003). In marine mammals, most species show extensive structure among populations (Hoelzel et al. 2002). Population differentiation can occur on a small geographic scale, as a result of isolation by distance (e.g. in western Australian bottlenose dolphins, Krützen et al. 2004) or due to ecological specialisation in relation with habitat features (e.g. in the Pacific white-sided dolphin, Hayano et al. 2004, and the killer-whale, Hoelzel et al. 1998a).
In the bottlenose dolphin, Tursiops truncatus (Montagu 1821), a distinction can be made between pelagic (or offshore) and coastal (or nearshore) ecotypes (see Hoelzel et al. 1998b for a review). Mitochondrial and nuclear DNA analyses have revealed the existence of genetic differentiation between the two ecotypes in the North-West Atlantic (Hoelzel et al. 1998b). Recently, a comprehensive study showed significant differentiation between several coastal populations and two highly polymorphic pelagic populations, one in the north-eastern Pacific and one in the north-western Atlantic (Natoli et al. 2004). Some coastal populations appeared to be morphologically and genetically sufficiently distinct to be classified as a separate species, such as T. aduncus in Chinese waters (Wang et al. 1999; Wang et al. 2000) and a potential third species along the South African coast (Natoli et al. 2004). Pelagic forms have been reported to range primarily between the 200- and 2000 m-isobaths (cf. Wells et al. 1999). Genetic differentiation between ecotypes has been used to characterise ecotype distribution according to water depth and/or distance to the coast. In the North-West Atlantic, the pelagic ecotype occurs mainly in waters beyond 34 km from shore and 34 m depth while the coastal one occurs at least up to 7.5 km from shore (Torres et al. 2003). In the Gulf of California, a distribution break is found around the 60m-isobath (Segura et al. 2006). At a regional scale, genetic analyses evidenced differentiation between the eastern and western basins of the Mediterranean Sea (Natoli et al. 2005), as well as between coastal populations of the Gulf of Mexico (Sellas et al. 2005) and the Northern Bahamas (Parsons et al. 2006). Despite the broad geographic coverage of all these studies, bottlenose dolphins have only been studied in peri-continental areas, and virtually nothing is known about distant offshore regions. The aim of the present study was to fill in this gap, by studying the population structure of bottlenose dolphins around two of the most isolated archipelagos in the North Atlantic, the Portuguese archipelagos of the Azores and Madeira.
The archipelago of the Azores is situated about 1500 km away from the nearest coast. It comprises nine islands divided into three groups that are separated by a few hundreds of kilometres. The archipelago of Madeira is located about 500 km west of the North African coast. It comprises two main islands separated by a few dozens of kilometres and two sub-archipelagos, with a total of seven islands. Previously reported bathymetric limits between coastal and pelagic populations of bottlenose dolphins cannot apply to the Portuguese archipelagos, because deep waters (> 200 m) occur at very short distances from the coast (Santos et al. 1995). Nonetheless, in the Azores, cetacean species seem to present different habitat preferences, with a distinction between a coastal and a pelagic zone (Silva et al. 2003). Bottlenose dolphins tend to be more abundant in coastal waters, less than 9 km from the coast and shallower than 1000 m (Silva et al. 2003). Another way to distinguish between ecotypes is to look at patterns of residency, as coastal dolphins tend to be resident while pelagic ones
may be transient (Wells et al. 1999). Bottlenose dolphins are present year-round in the two Portuguese archipelagos. Separate photo-identification surveys carried out in each archipelago have shown that some individuals are sighted repeatedly in the same area at different seasons (Silva 2006; L.F., unpublished results). These animals are probably resident. On the opposite, some individuals are rarely observed in the main study area and can travel large distances. They may be visitors. Thus, it can be hypothesised that the individuals ranging in each archipelago are from at least two populations, at least one population of coastal / residents and at least one population of pelagic / transients. Alternatively, or in combination with that hypothesis, population structure could follow the geographical and physical structure of the archipelagos. Different populations could occupy the two archipelagos and there may be some population differentiation between groups of islands. In that case, a correlation between geographical and genetic distances can be expected.
We used a combination of mitochondrial DNA (mtDNA) sequences and microsatellite markers to test our predictions about the population structure of bottlenose dolphins around the Portuguese archipelagos of the Azores and Madeira. Sampling was performed at a wide range of distances from the coast (from 0.2 to 100 km) in order to cover both coastal and pelagic habitats. A few samples from the continental coast of Portugal were also analysed. Comparisons were made with published mtDNA sequences from other populations of the Atlantic Basin, in order to evaluate the degree of differentiation of the two archipelagos in relation with peri-Atlantic areas.
Material and methods
Study sites
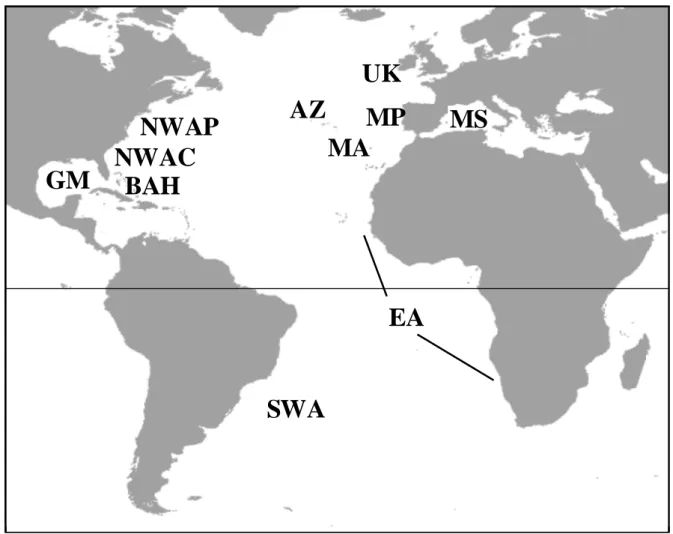
The archipelago of the Azores (AZ - Portugal, Fig. 1A and 1B) is located in the North Atlantic Ocean, about 1500 km away from the continent. It lies between the 37th and 41st northern parallel and the 25th and 31st western meridian, extending more than 480 km along a Northwest-Southeast axis and crossing the Mid-Atlantic Ridge. It is composed of nine volcanic islands divided into three groups (the eastern, central and western groups) separated by deep waters (ca. 2000 m) with scattered seamounts (Santos et al. 1995). Shallow waters (< 200m) occur only at very short distances from the coast, and in the channel between Pico and Faial islands. Most field work was conducted in the central group of islands (around the islands of Pico and Faial, from the harbour of Horta - 38.53°N and 28.63°W), on a daily basis. Cruises of longer duration were organized in order to cover the whole archipelago.
The archipelago of Madeira (MA - Portugal, Fig. 1A) is located in the North Atlantic Ocean, 580 km West of Morocco, Africa. It is composed of two main volcanic islands, Madeira and Porto Santo, which are separated by a stretch of 35 km getting as deep as 3000 m. It also comprises two sub-archipelagos, Desertas Islands and Selvagens Islands, located 11 km Southeast and 300 km South of Madeira, respectively. Fieldwork was conducted on the southern coast of Madeira and West of the Desertas Islands, from the harbour of Caniçal (32.7°N and 16.7°W).
Samples from mainland Portugal (hereafter "Mainland") were obtained from animals that stranded along the oceanic shoreline (38.15°N-8.73°W to 40.48°N-8.78°W).
Sample collection and DNA extraction
Skin samples were collected using a biopsy darting system (a 125-lb Barnett crossbow, with arrows and darts specially designed for small cetaceans by F. Larsen, Ceta-Dart). In the Azores, 86 biopsy samples were obtained between 2002 and 2005: 46 samples in the central
group, 24 in the eastern group, 9 in the western group and 5 around seamounts located 100 km south of the central group. All samples but two were from adult and subadult individuals, and all samples were retained for analyses. Samples were stored either in a 20% dimethyl-sulfoxide (DMSO) solution saturated with salt, or in 90% ethanol, which proved to be a better preservative than DMSO. Photographs of sampled individuals were collected for photo-identification purpose. Eight individuals were identified as being resident in the central group of islands (Silva 2006). In Madeira, 26 biopsy samples were collected in 2004 and 2005, at a maximum of 10 km from the coast of the main highland. Sampling scheme precluded any attempt to make comparisons between groups of islands. All samples were from adult individuals and stored in alcohol. Two additional samples were obtained from individuals that stranded on the coast of Madeira in 1998.
In addition, seven samples were collected on animals that stranded along the coast of mainland Portugal between 1997 and 2005. These samples were used for comparison with a continental population, despite small sample size.
Biopsy samples were classified into two categories according to habitat characteristics at sampling location, following the dichotomy suggested by previous work on cetacean distribution in the Azores (Silva et al. 2003): 1/ distance to the coast smaller than 9 km and depth lower than 1000 m (mean depth 396 m +/-266, 95% CI: 331-461 m; N=64 for the Azores and 21 for Madeira), 2/ distance to the coast larger than 9 km and depth ranging from 385 to 1655 m (mean depth 884 m +/-414, 95% CI: 698-1070 m; N=19 for the Azores and 3 for Madeira). Depth and distance to the coast at sampling location were estimated by means of a Geographic Information System.
Samples were processed at the INETI, Lisbon, Portugal. DNA extractions were performed following the protocol of Gemmel & Akiyama (1996). About 1-2 mm3 of skin were minced and rinsed in dd-water prior to extraction. Digestion was extended overnight at 56°C, using recombinant proteinase K. The LiCl2 precipitation and chloroform extraction were performed
as described by the authors, except that the chloroform extraction was repeated twice.
Mitochondrial DNA sequences
Acquisition of sequences
Part of the tRNA-Thr, the tRNA-Pro and the most variable part of the mitochondrial D-loop were amplified using the primers Dloop-16L 5'-CCCGGTCTTGTAAACC-3' (Hoelzel et al. 1991) and H00034 5'-TACCAAATGTATGAAACCTCAG-3' (Rosel et al. 1994). For 26 samples, a longer fragment of 833 base pairs (bp) was obtained with the primers Dloop-16L and Dloop-19H 5'-ATTTTCAGTGTCTTGCTTT-3' (Hoelzel et al. 1991). Longer sequences were used to assess the impact of using shorter sequences on haplotype diversity. They were truncated to 604 bp before subsequent analyses.
PCR reactions were carried out in a 25 µl volume using 0.75 units of Taq DNA polymerase (MBI Fermentas) and 2mM MgCl2. The number of cycles was set to 35 and the annealing
temperature to 52°C. PCR products were purified with the GFX PCR DNA purification kit (Amersham Biosciences), following the manufacturer's protocol. Sequencing was done on ABI-prism capillary sequencers (Applied Biosystems), at one of the following institutions: 1/ CRIBI, University of Padova, Italy, 2/ INETI, Portugal, and 3/ Macrogen, Korea. Two samples were sequenced at all three locations to ensure cross-institution reliability. All samples were sequenced with the 16L primer, using an annealing temperature of 55°C. Thirty-three samples were also sequenced with the reverse primer and no ambiguities were found. All sequences were double-checked for errors. Sequences were deposited in GenBank, with reference numbers DQ073641 to DQ073729 and DQ525357 to DQ525388.
Alignment was performed visually. Three gaps were identified. The first 23 nucleotide positions were deleted due to potential misreading at the beginning of the sequence. The final alignment was 604 bp long.
In addition, 194 published D-loop sequences of Tursiops truncatus were used to obtain a general picture of population structure in the Atlantic Basin (Fig. 1A). Seven populations were considered: United Kingdom (UK; N = 38: 29 sequences from Parsons et al. 2002, and 9 from Natoli et al. 2004), Mediterranean Sea (MS; N = 18; Natoli et al. 2004), North-West Atlantic Pelagic (NWAP; N = 25; Natoli et al. 2004), East Atlantic (EA; N = 17; Natoli et al. 2004), North-West Atlantic Coastal (NWAC; N = 29; Natoli et al. 2004), Bahamas (BAH; N = 55; Parsons et al. 2006), and Gulf of Mexico (GM; N = 12; Natoli et al. 2004). These populations were classified as coastal or pelagic according to the nomenclature adopted in one of the most recent studies (Natoli et al. 2004). As most fragments were only 296 bp long, all sequences were truncated to that length for the analyses within the Atlantic Basin. Two additional gaps were added for alignment with these sequences.
Haplotype networks
We investigated the phyletic relationships between the haplotypes from the Portuguese archipelagos and Mainland using network-building methods. These methods are more efficient than classical phylogenetic algorithms when genetic distances between individuals are small and the number of equally parsimonious connections is high, as expected for intra-specific comparisons (Templeton et al. 1992; Crandall 1996). We selected the Median Joining approach (MJ), implemented by the software Network4 (Bandelt et al. 1999), for being one of the most efficient network-building methods available to date (Cassens et al. 2003). The homoplasy parameter (ε) was set to zero. Two weighting schemes were applied in order to account for differences in substitution rates: 1/ equal weight for all classes of changes, and 2/ weight of 10 for transitions and 30 for transversions and gaps, as suggested by the authors for a tenfold difference in mutation rates between substitution classes.
Population structure
Genetic distances between and within archipelagos were calculated using the Tamura-Nei formula (Tamura & Nei 1993). Corrected distances accounting for intra-population variability (PiXY-(PiX+PiY)/2) were also calculated. Genetic differentiation among potential populations was assessed taking into account nucleotide differences between haplotypes (ΦST,
Weir & Cockerham 1984), after correction by the Tamura-Nei formula. Significance was assessed by a permutation procedure (10,000 permutations). These calculations were performed with Arlequin 3.1 (Excoffier et al. 2005).
Genetic differentiation between the studied populations and other populations of the Atlantic Basin was assessed by calculating ΦST and its significance, as above. For each population,
gene diversity (H) and nucleotide diversity (π) were calculated using Arlequin 3.1. Shared haplotypes between populations were identified using the same software. An asymmetric estimate of the migration rate (Nem) between relevant populations was calculated using
Migrate 2.0 (Beerli 2004). Initial runs were set estimating θ and M with FST. Reruns were
performed using the parameters estimated during the first run, with 10 short chains of 50,000 steps and 3 long chains of 500,000 steps. For each estimate of M, significant departure from zero and from a symmetric migration scheme was tested by a lilekihood ratio test.
We tested for the effect of geographic distances on population structure by means of a Mantel test, using the program Genetix 4.03 (Belkhir et al. 2001). Given that the distribution of
sampling locations was three-dimensional, ΦST /(1- ΦST) was expected to vary linearly with
the logarithm of geographic distances. Individuals were grouped according to sampling locations following two different schemes. First, we considered Madeira, the Mainland, and four populations within the Azores: the three groups of islands and the seamounts. Second, we divided the central group of islands into three groups: Graciosa (N = 4 samples), Terceira (N = 5), and the remnant islands (N = 37). The latter scheme allowed increasing the number of populations and accounting for the large distances between sampling locations within the central group, but resulted in lower sample sizes. The significance of the tests was assessed by 10,000 Monte Carlo-Markov Chain (MCMC) simulations.
In order to determine whether there was some degree of genetic differentiation between individuals sampled in "coastal" or "pelagic" habitats, we performed a Molecular Analysis of Variance (AMOVA) using Arlequin 3.1. Because differentiation between groups of islands was also expected, two alternative grouping schemes were compared: 1/ clustering of samples first according to habitats (within or beyond 9 km from the coast) and second according to groups of islands (Madeira, the three groups of Azorean islands, and the seamounts); 2/ clustering of samples first according to groups of island and second according to habitats. Finally, we measured gene diversity (H) and nucleotide diversity (π) in known resident individuals, using Arlequin 3.1.
Microsatellites and molecular sexing
Data acquisition
Ten polymorphic dinucleotide microsatellite loci were analysed: d22 (Shinohara et al. 1997), EV5, EV14, EV37 (Valsecchi & Amos 1996), FCB1, FCB17 (Buchanan et al. 1996), Mk6, Mk8 (Krutzën et al. 2001), Sw10 and Sw19 (Richard et al. 1996). PCR reactions were performed in multiplex whenever possible, applying a touched-down decrease in annealing temperatures: Sw19 and Sw19 (50 → 47.5°C); FCB1, FCB17 and EV37 (56 → 53°C); Mk6, Mk8, d22 (56 → 53°C). Fragments were scanned on an ABI 310 capillary sequencer using the size marker ROX350 (Applied Biosystems). Molecular sexing was performed by co-amplification of a short fragment of the male-specific SRY gene (CSY, 157 bp, Abe et al. 2001) and a monomorphic microsatellite fragment used as a PCR control for positive identification of females (Sw15, 234 bp, Richard et al. 1996).
Polymorphism control
Prior to analyses, genotypes were checked for potential errors and replicated individuals using Microsatellite Tools (MsTools, Park 2001). Genotyping was repeated whenever necessary. There were three cases of individuals that had been sampled twice in the Azores and one case in Madeira. The duplicated samples were removed from all data sets, so that the final number of individuals analysed was 83 for the Azores, and 27 for Madeira.
Polymorphism was estimated as the number of alleles per locus, observed heterozygosity (HO), unbiased expected heterozygosity (HE), and polymorphism information content (PIC;
Botstein et al. 1980), using Cervus (Marshall et al. 1998). The PIC, which is based on expected heterozygosity and the number of alleles per site, is representative of the diversity found at each locus. Departure from Hardy-Weinberg (HW) frequencies within populations was tested with FSTAT 2.9.3 (Goudet 2001) using a randomization procedure. A sequential Bonferroni correction was applied to compensate for multiple tests (Rice 1989). For the main two populations, global FIS was calculated and its significance estimated by a permutation
Population structure
Preliminary analysis of allele-size distribution indicated that half of the loci seemed to conform to the uni- or bi-modal distribution of allele sizes expected under the Stepwise Mutation Model (SMM, Ohta & Kimura 1973). Other loci presented multimodal distributions and/or large gaps in allele sizes, more in agreement with the Infinite Allele Model (IAM, Kimura & Crow 1964) or the Two Phase Model. Thus, genetic differentiation among potential populations was assessed based on both the IAM model (FST, Weir & Cockerham
1984) using Arlequin 3.1, and the SMM model (RST = RhoST of Slatkin 1995) using RstCalc
(Goodman 1997). In the latter case, data were standardized in order to compensate variance differences between loci. Significance was assessed by a permutation procedure (10,000 permutations). The influence of allele size on population differentiation was tested with the permutation test implemented in SPAGeDi 1.1b (Hardy & Vekemans 2002). Note that, although RST was designed especially for microsatellites and accounts for differences in allele
sizes, FST was shown to be more reliable than RST when sample size is limited (Gaggiotti et al.
1999) and when gene flow is high (Balloux & Goudet 2002). Therefore, FST should be
preferred to RST when allele size does not contribute to population differentiation. An
asymmetric estimate of the migration rate (Nem) between the Azores and Madeira was
calculated using Migrate 2.0 (Beerli 2004), as described above, and using the Brownian motion model.
Population structure was also evaluated by Bayesian analyses, using the software Structure 2.1 (Pritchard et al. 2000). We examined the possibility of an undetected population structure by carrying out MCMC simulations with no prior information on the origin of samples. The maximum number of populations (K) was assumed to vary between 1 and 6. For each potential value of K, five replications were performed. The program was also run for the whole data set using prior knowledge on geographic population structure, in order to identify potential migrants. Three populations were considered based on sample origin: Azores, Madeira and Mainland. In both cases, the number of steps for the burning process and the simulations was set to 50,000.
We tested for the effect of geographic distances on population structure by means of a Mantel test, as explained above, but replacing ΦST by FST. Given the difficulty of defining boundaries
between groups and the high mobility of focus animals, we also performed the Mantel test at the individual level, using Alleles In Space 1.0 (AIS; Miller 2005). The genetic distance implemented in this program is an analogue of Nei's distance (Nei et al. 1983) applied to pair of individuals. Log-transformed geographic distances were used and significance was assessed by 10,000 permutations.
The degree of genetic differentiation between individuals sampled in "coastal" or "pelagic" habitats was estimated by means of an AMOVA, as described above. Because haplotypes clustered in two distinct groups (cf. result section), an AMOVA was also performed to determine how microsatellite diversity was partitioned between haplotype groups.
Mean degree of relatedness between resident individuals was compared to mean relatedness in the Azores based on Moran’s I coefficients calculated with SPAGeDi 1.1b (Hardy & Vekemans 2002). This coefficient was chosen because it is defined in a way that mean relatedness is zero for the whole population. Actual variance and standard deviation were estimated by the method of Ritland (2000).
Sex-biased dispersal was tested using the program FSTAT 2.9.3 (Goudet 2001) based on sex-specific expectations with respect to FIS, FST, and a likelihood assignment index. Significance
was tested by 10,000 permutations. The analysis was performed twice, using adults only, and using adults and subadults, as a mean to increase sample size.
Results
Molecular sexing indicated a sampling bias in favour of males in the Azores. Excluding the samples from stranded animals (2 males from Madeira), there were 61 males and 22 females in the Azores (sex-ratio = 2.77:1) and 13 males and 12 females in Madeira (sex-ratio = 1.08:1).
Mitochondrial DNA sequences
Variability
Among the 26 Azorean samples for which long sequences were obtained, long sequences (833 bp) revealed 19 different haplotypes, while short sequences (604 bp) corresponded to 18 haplotypes, resulting in a loss of 5.3 %.
For the entire set of 604 bp sequences, there were 37 different haplotypes out of 83 samples for the Azores, 16 out of 25 samples for Madeira (note that two samples from Madeira could not be sequenced) and 5 out of 7 samples for the Mainland. Gene diversity and nucleotide diversity were high at the three locations and similar to the values obtained for the 296 bp sequences (cf. Table 4).
Population structure within and between archipelagos
Twelve haplotypes were shared between the Azores and Madeira. The mean Tamura-Nei distance between archipelagos was 7.17, but lowered to 0.47 after correction for intra-population polymorphism. Within the Azores, the mean Tamura-Nei distance was 7.45, while it was 5.95 in Madeira.
In the Azores, fixation indexes indicated a lack of population differentiation between all sampling sites, except between the central and western groups of islands (Table 1A). Comparisons between the Azores, Madeira and the Mainland revealed significant differentiation between the two archipelagos (ΦST = 0.059, p = 0.017), but no significant
differentiation with regards to comparisons involving the Mainland (Table 1B). Estimates of migration rates indicated that gene flow was very high from Madeira to the Azores (Table 2), and significantly higher than in the opposite direction (p < 0.001). Mantel tests were not significant when performed on the originally defined populations (Z = 4.200, p = 0.254) or on refined populations (central group of islands subdivided between Terceira, Graciosa, and the remnant islands: Z = 1.103, p = 0.200).
The AMOVA indicated that most (> 95 %) of the genetic variance was found within groups of samples collected in the same habitat and the same group of islands (Table 3). Clustering the samples first according to groups of islands and then according to habitats (Table 3A), or the reverse (Table 3B), had little impact on the output of the analysis. The proportion of variance attributed to differentiation between habitats was negative, while the proportion found between groups of islands was positive. None of the fixation indices was significant. In the eight known resident individuals of the Azores, a high level of molecular diversity was found (H = 1 and π = 0.016). These values were similar to those found for the whole Azorean sample (see above).
The Median Joining network showed that haplotype clustering was independent of sampling location (Fig. 2). The application of differential weights did not alter significantly the phyletic relationships between haplotypes. The weighted network was identical to the unweighted one, except for the breakage of three loops. The network revealed two main groups of haplotypes separated by a large genetic distance. Mean Tamura-Nei distance between the two clusters was 12.88, and only 7.84 after correction for within cluster polymorphism.
Population structure within the Atlantic Basin
Shortening the sequences from 604 to 296 bp resulted in the loss of eight haplotypes for the Azores (21.6%) and two for Madeira (12.5%). Shorter sequences could result in overestimation of similarity, but we verified that using shorter sequences had little impact on the evaluation of population differentiation between the Azores and Madeira (ΦST = 0.057, p
= 0.036).
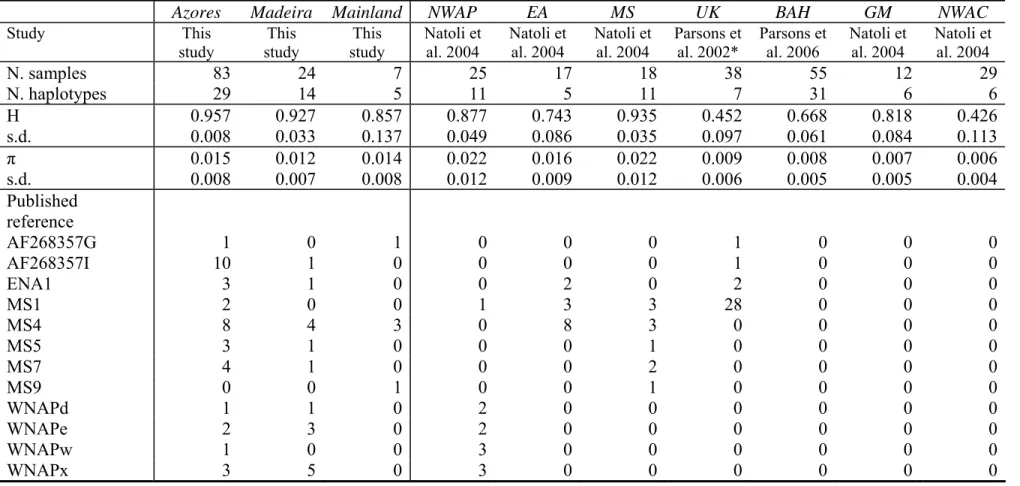
The high gene and nucleotide diversities found in the Azores and Madeira were comparable to the values obtained for the North-West Atlantic Pelagic and Mediterranean Sea populations (Table 4). The studied populations shared haplotypes with the Mediterranean Sea and most populations of the Atlantic Ocean (Table 4). No haplotypes were shared with the coastal populations of the North-West Atlantic, Bahamas and Gulf of Mexico.
The populations of the Portuguese archipelagos were significantly differentiated from all the populations of the Atlantic Basin, except the North-West Atlantic Pelagic population. The population of Madeira was also not differentiated from that of the Eastern Atlantic (Table 5). For both archipelagos, the highest levels of differentiation were found with the coastal populations of the North-West Atlantic, Bahamas and Gulf of Mexico. Estimates of migration rates indicated significant gene flow between the Azores, Madeira and the NWAP population (Table 2). Gene flow was relatively high from the NWAP to the Azores, but not significantly higher than in the opposite direction (p = 0.110).
Microsatellites
Variability
The ten selected loci presented a high level of allelic diversity (13.5 alleles on average) despite the low variability of two loci (EV5 and Sw10, with three alleles each; Table 6). Expected heterozygosity and polymorphism information contents were high. These values, which were calculated for the whole dataset, were quite similar to those obtained for each of the main two populations. All loci appeared to be in HWE after application of a Bonferroni correction (Table 6). The inbreeding coefficient calculated over all loci was non-significant for the Azores (FIS = 0.012, p = 0.179) and Madeira (FIS = 0.014, p = 0.326).
Population structure within and between archipelagos
Apart from a significant Rst-value between the central and western groups of islands in the Azores (RST = 0.032, p = 0.046), there was no evidence of population differentiation within
the Azores or between the three study sites (Tables 7A and 7B). Allele size appeared not to play a significant role in determining population differentiation (p-values were non significant), suggesting that FST should be preferred to RST. Estimates of migration rates
between the Azores and Madeira indicated significantly higher gene flow from (Nm = 26.3; 95% CI = 23.1-29.9) than to the Azores (Nm = 1.1; 95% CI = 0.9-1.3; p < 0.001). Population-based Mantel tests were not significant when performed on the originally defined populations
(Z = 0.067, p = 0.914) or on refined populations (Z = 0.307, p = 0.460). Individual-based Mantel test was also not significant (r = 0.002, p = 0.452).
The AMOVA indicated that 99.8 % of the genetic variance was found within groups of samples collected in the same habitat and the same group of islands (Table 3). Less than 0.4 % of variance was explained by comparing samples between groups of islands or habitats. None of the fixation indices was significant.
The mean relatedness between resident individuals (Moran’s I = 0.000 +/- 0.055) was similar to the mean relatedness of the whole Azorean sample (0.000 +/- 0.008).
Bayesian analyses performed on unassigned individuals failed to uncover any population structure. The highest likelihood value was obtained for K = 1 and assignment indexes were close to 1/K. When running the analysis with predefined populations, all the samples had a higher probability to come from the population they had been collected in. This was likely due to lack of differentiation between populations (Kullback-Leibler distances varied between 0.00 and 0.03).
Tests for sex-biased dispersal did not yield significant differences between sexes for any of the indicators. Furthermore, while two indicators tended to match the expectations for higher dispersal in males than females (FST = 0.007 for females and -0.004 for males, p = 0.224;
Variance of Assignment Index = 8.79 for females and 10.48 for males, p = 0.615), the other two showed the opposite trend (FIS = 0.055 for females and 0.009 for males, p = 0.912; Mean
Assignment Index = -0.638 for females and 0.263 for males, p = 0.891; N = 26 females and 63 males). When the tests were repeated using both adults and subadults, similar results were obtained.
Population differentiation between haplotype groups
The AMOVA revealed that 100 % of the microsatellite variance was found within haplotype groups. FST was negative and not significant (FST = -0.0004, p = 0.554), indicating that
microsatellite diversity tended to be higher within than among haplotype groups.
Discussion
Variability
In the Azores, sampling was strongly biased in favour of males (male / female sex-ratio = 2.8). This bias was probably a sampling artefact, as it seemed that adult females tended to avoid the boat, especially when accompanied by young calves. However, no such bias was observed in the samples from Madeira, suggesting a potential difference in dolphins' behaviour or an actual difference in sex-ratio between archipelagos. Results might have been influenced by the fact that field work was conducted year-round in Madeira, but only in summer in the Azores, when many young calves were present.
MtDNA sequences showed a high gene and nucleotide diversity in our samples. The values were similar to those obtained for the North-West Atlantic Pelagic population and for the Mediterranean Sea (Table 4; see also Natoli et al. 2004). Sequencing of 604 bp of the most variable part of the D-loop rather than a longer fragment (833 bp) had little effect on diversity assessment (loss of diversity = 5.3%). Using the shorter fragment available for most samples from the Atlantic Basin resulted in a loss of diversity of 21.6 % for the Azores and 12.5 % for Madeira.
The ten selected microsatellite loci were globally very polymorphic and showed high polymorphism information contents. The mean number of alleles and level of heterozygosity
were comparable to those reported for the North-West Atlantic Pelagic population and for the Mediterranean Sea (Natoli et al. 2004). Such high values are typical of large panmictic populations (Frankham et al. 2002).
Absence of population structure within and between archipelagos
Within the Azores, the western group of islands appeared to be slightly differentiated from the central group with respect to female-transmitted mtDNA and possibly microsatellites (RST but
not FST). However, the western group was not differentiated from the eastern one, despite a
greater geographic distance. The significant differentiation of the western group might be due to a sampling bias, as only nine samples were obtained from that area. This question requires further examination.
MtDNA indicated significant differentiation between the Azores and Madeira, but not between the two archipelagos and the Mainland (Table 1B). This latter result could be due to small sample size for the Mainland. Microsatellites showed no population differentiation between the three study sites (Table 7B). Estimates of asymmetric migration rates revealed high gene flow between the two archipelagos (Table 2). While mtDNA indicated high gene flow from Madeira to the Azores, microsatellites suggested the opposite. For both markers, Mantel tests did not show any significant effect of isolation by distance. The AMOVA analyses performed on samples grouped according to groups of islands and habitats revealed little differentiation between groups of islands and no differentiation between habitats (Table 3). Furthermore, Bayesian analyses of microsatellite data performed on unassigned individuals failed to uncover any population structure, suggesting that there was no cryptic population structure depending on undetected factors.
MtDNA haplotypes clustered in two well differentiated groups that were independent of the geographical origin of samples (Fig. 2). We intended to know whether these phylogenetic groupings were underlying differentiation between coastal and pelagic populations. We verified that haplotype type was independent of individual grouping patterns, sampling location and geographic features. In half of the cases where more than one individual was sampled within a group (and thus at a given sighting location), there were individuals bearing haplotypes of each of the two types. Samples obtained at the seamounts, situated 100 km from the shore, also fell into the two haplotype groups. In addition, the AMOVA performed on microsatellite data revealed that all of the genetic variance was found within haplotype groups. The negative and non significant FST-value between haplotype groups indicated the
existence of high gene flow between them. Thus, we can reject the hypothesis that haplotype groups are reflecting differentiation between coastal and pelagic populations. These groups would rather be a heritage of past environmental changes and population isolation during glacial stages, as observed in other cetacean species (Hoelzel et al. 2002).
In the Azores, eight individuals could be identified as resident in the central group of islands based on photo-identification data (Silva 2006). These individuals showed a high level of mtDNA diversity, similar to that found for the whole Azorean sample. Microsatellites indicated that their mean relatedness was similar to that of the whole Azorean sample. Although gene flow between resident and non resident individuals could not be quantified (because lack of recognition as a resident does not imply that an individual is not resident), results suggest that there is substantial gene flow between resident and potentially transient bottlenose dolphins in the Azores. Interbreeding must be facilitated by the extensive ranging behaviour of some individuals and by a lack of habitat partitioning (Silva 2006), which facilitate encounters between groups.
The fact that genetic differentiation was lower for microsatellites (biparental inheritance) than for mtDNA (female transmission) suggested that dispersal could be higher in males than in females. In several cetacean species, microsatellites also display less population structure than mtDNA (Hoelzel et al. 2002). This pattern is usually interpreted as male-mediated gene flow, as in western Australian bottlenose dolphins (Tursiops sp., Krützen et al. 2004). In the present study, the tests for sex-biased dispersal did not support the hypothesis of higher gene flow in males than females. While the outcome of our tests might have been flown by small sample sizes, the same tests applied to T. truncatus populations of the eastern North Atlantic and the Mediterranean and Black Seas also showed no evidence for sex-biased dispersal (Natoli et al. 2005). By contrast, a similar procedure revealed sex-biased dispersal in Australian resident bottlenose dolphins of the species T. aduncus (Möller & Beheregaray 2004), suggesting that there might be some intra-generic differences in sex-biased dispersal.
Population differentiation based on mtDNA within the Atlantic Basin
MtDNA sequences indicated that the populations of the Azores and Madeira were significantly differentiated from all the Atlantic Basin populations except the North-West Atlantic Pelagic population (Table 5). The ΦST values obtained between these populations
were very low (ΦST = 0.035 and 0.054, which is close to the "low gene flow" limit of 0.05,
Wright 1978). The populations of the Azores and Madeira would thus be of the pelagic type, despite the fact that bottlenose dolphins are primarily encountered within 9 km from the shore in Azorean waters (Silva et al. 2003). This result is consistent with the specificity of the marine habitat around the islands of the Azores and Madeira. These volcanic islands are virtually devoid of typical coastal habitat, due to the absence of a continental shelf and the occurrence of deep waters at short distances from the coast (e.g. Santos et al. 1995).
Estimates of migration rates indicated that the eastern and western Atlantic pelagic populations were actually exchanging migrants, but that gene flow was relatively low as compared to that observed between Madeira and the Azores (Table 2). The existence of high gene flow in the North-East Atlantic was unexpected. A recent study showed a high level of gene flow between the eastern North Atlantic and the western Mediterranean, but in that case, the two populations were contiguous and only separated by the Strait of Gibraltar (Natoli et al. 2005). Worldwide, gene flow tends to be restricted in both sexes (Natoli et al. 2004). In West Australian bottlenose dolphins, Tursiops sp., gene flow appears to be restricted over short distances (Krützen et al. 2004). The discrepancy between previous studies and ours might be explained by the fact that, while the former mostly dealt with coastal populations, the latter investigated a pelagic population. Consistently, in common dolphins (genus Delphinus), Natoli and collaborators (2006) found low genetic differentiation among pelagic populations across a large geographic scale. The authors’ interpretation was that pelagic populations would tend to show high genetic variability and low population differentiation, as a result of high mobility and fluid social structure.
Results suggest that pelagic bottlenose dolphins are able to maintain a high level of gene flow over very large distances. However, it is unclear whether individual dolphins actually cross the thousands kilometres that separate the two Portuguese archipelagos and these archipelagos from the continental shelves. Satellite-tracking of two pelagic bottlenose dolphins in the North-West Atlantic has shown that they were able to travel very large distances in a short period of time (up to 4200 km along a 2500 km axis in 47 days; Wells et al. 1999). Whatsoever, a preliminary comparison of the photo-identification catalogues of the Azores and Madeira did not reveal any individual in common (M.A.S. and L.F., unpublished). Gene flow might be achieved indirectly, through genetic admixture between social groups. This process must be facilitated by the fission-fusion social structure which characterises the
species (cf. Connor et al. 2000). Accordingly, high levels of gene flow were found in terrestrial species with a fission-fusion social system, such as chimpanzees (Gagneux et al. 2001).
Given that present results are only based on mtDNA sequences, we recommend that large scale microsatellite analyses encompassing the North Atlantic are performed. Such analyses will allow to determine whether the observed lack of population differentiation between the North-West Atlantic and the Portuguese archipelagos is actually the consequence of present gene flow and to characterize the geographic extent of this oceanic population.
Conclusions
This study suggests that there is a single population of bottlenose dolphins in the pelagic waters of the North-East Atlantic, and that this population is not significantly differentiated from the pelagic population of the North-West Atlantic. The absence of a genetically differentiated coastal ecotype around the North-East Atlantic Islands was unexpected, given the prevalence of this finding in the Atlantic and Pacific Oceans (Hoelzel et al. 1998b; Segura et al. 2006) and the pattern of residency observed in the Azores (Silva 2006). However, it is consistent with the steep topography of the area, with deep waters occurring at short distances from the coast. The lack of geographic structuring suggests larger home ranges and/or higher dispersal in the study area than in previously studied populations, as suggested by a photo-identification study (Silva 2006). These findings are probably related to behavioural differences between populations exploiting coastal versus pelagic habitats.
The non-differentiation between the North-East and the North-West Atlantic pelagic populations was also unexpected. This latter result implies higher levels of gene flow than previously known in this species, and indicates that the supposedly poorly productive waters of the deep Atlantic do not prevent gene flow. Although requiring confirmation by microsatellite analyses, this finding suggests the existence of a single oceanic population in the mid-latitude pelagic waters of the North Atlantic Ocean. From a conservation standpoint, this population can be regarded as a single management unit, characterised by high genetic diversity and large population size. It is probably not threatened in the short time, but it still raises a conservation issue. As local threats may impact the whole population, there is a need for concerted conservation policies at the scale of the North Atlantic. Preserving this pelagic population is all the more important as it may act as a pool for inshore populations (cf. Natoli et al. 2004) and enable recovery following dramatic events.
Acknowledgements
Authors are very grateful to the Portuguese Foundation for Science and Technology (FCT) for funding the CETAMARH project (POCTI/BSE/38991/01, co-participated by the Community Support Framework - FEDER) as well as S.Q.'s post-doctoral grants (IMAR/FCT- PDOC-006/2001-MoleGen and SFRH/BPD/19680/2004), M.A.S.'s doctoral grant (SFRH/BD/8609 /2002) and S.M.’s research assistant grant (CETAMARHII/POCTI/BSE/38991/2001). They acknowledge the EU funded program Interreg IIIb for funding the MACETUS project (MAC/4.2/M10) and R.P. and S.M.’s grants (IMAR/INTERREGIIIb/MACETUS/MAC1/2). IMAR-DOP/UAç is the R&D Unit #531 funded through the pluri-annual and programmatic funding schemes of FCT-MCTES and DRCT-Azores. The authors wish to thank all the students and staff who contributed to the two projects, with special thanks to the skippers (P. Martins, V. Rosa, R. Bettencourt and N. Serpa), whose dexterity greatly helped sample collection. They also acknowledge M. Sequeira (Instituto da Conservação da Natureza, ICN)
for providing access to samples of animals stranded along the Portuguese coast, and two anonymous reviewers for useful comments on an earlier version of the manuscript.
References
Abe H, Goto M, Pastene LA (2001) Practical use of multiplex fluorescent PCR for cetacean sex identification. Mar Mammal Sci, 17(3), 657-664.
Balloux F, Goudet J (2002) Statistical properties of population differentiation estimators under stepwise mutation in a finite island model. Mol Ecol, 11, 771-783.
Bandelt H-J, Forster P, Röhl A (1999) Median-joining networks for inferring intraspecific phylogenies. Mol Biol Evol, 16(1), 37-48.
Beerli P (2004) Migrate Version 2.0: documentation and program, part of LAMARC. Revised 23/12/2004. Distributed over the Internet: http://evolution.gs.washington.edu/lamarc.html
Belkhir K, Borsa P, Chikhi L, Raufaste N, Bonhomme F (2001) Genetix, a Windows software for population Genetics. Laboratoire Génome, Populations, Interactions, CNRS UPR 9060, Université de Montpellier II, Montpellier, France.
Botstein D, White RL, Skolnick M, Davis RW (1980) Construction of a genetic linkage map in man using restriction fragment length polymorphisms. Am J Hum Genet, 32, 314-331. Buchanan F, Friesen M, Littlejohn R, Clayton J (1996) Microsatellites from the beluga whale (Delphinapterus leucas). Mol Ecol, 5, 571-575.
Cassens I, van Waerebeek K, Best PB, Crespo EA, Reyes J, Milinkovitch MC (2003) The phylogeography of dusky dolphins (Lagenorhynchus obscurus): a critical examination of network methods and rooting procedures. Mol Ecol, 12, 1781-1792.
Connor RC, Wells RS, Mann J (2000) The bottlenose dolphins: social relationships in a fission-fusion society. In: Mann J, Connor RC, Tyack PL, Whitehead H (eds) Cetacean societies. Field studies of dolphins and whales. The University of Chicago Press, Chicago. Crandall KA (1996) Multiple interspecies transmissions of human and simian T-cell leukemia/lymphoma virus type I sequences. Mol Biol Evol, 13(1), 115-131.
Excoffier L, Laval G, Schneider S (2005) Arlequin ver. 3.0: An integrated software package for population genetics data analysis. Evol Bioinformatics Online, 1, 47-50.
Frankham R, Ballou JD, Briscoe DA (2002) Introduction to Conservation Genetics, Cambridge University Press.
Gaggiotti OE, Lange O, Rassmann K, Gliddon C (1999) A comparison of two indirect methods for estimating average levels of gene flow using microsatellite data. Mol Ecol, 8(9), 1513-1520.
Gagneux P, Gonder MK, Goldberg TL, Morin PA (2001) Gene flow in wild chimpanzee populations: what genetic data tell us about chimpanzee movement over space and time. Phil Trans R Soc London B, 356, 889-897.
Gemmel NJ, Akiyama S (1996) An efficient method for the extraction of DNA from vertebrate tissues. TREE, 12(9), 338-339.
Goodman SJ (1997) RST CALC: A collection of computer programs for calculating unbiased estimates of genetic differentiation and determining their significance for microsatellite data. Mol Ecol, 6, 881-885.
(version 2.9.3). Available from http://www.unil.ch/izea/softwares/fstat.html.
Hardy OJ, Vekemans X (2002) SPAGeDI: a versatile computer program to analyse spatial genetic structure at the individual or population levels. Mol Ecol Notes, 2, 618-620.
Hayano A, Yoshioka M, Tanaka M, Amano M (2004) Population differentiation in the Pacific white-sided dolphin Lagenorhynchus obliquidens inferred from mitochondrial DNA and microsatellite analyses. Zool Sci, 21, 989-999.
Hoelzel AR, Hancock JM, Dover GA (1991) Evolution of the cetacean miochondrial D-loop region. Mol Biol Evol, 8(3), 475-493.
Hoelzel AR, Dahlheim M, Stern SJ (1998a) Low genetic variation among killer whales (Orcinus orca) in the Eastern North Pacific and genetic differentiation between foraging specialists. J Hered, 89, 121-128.
Hoelzel AR, Potter CW, Best PB (1998b) Genetic differentiation between parapatric 'nearshore' and 'offshore' populations of the bottlenose dolphin. Proc R Soc London B, 265, 1177-1183.
Hoelzel AR, Goldsworthy SD, Fleischer RC (2002) Population genetic structure. In: Hoelzel AR (ed) Marine mammal biology. Blackwell Science Ltd, Oxford, UK.
Kimura M, Crow JF (1964) The number of alleles that can be maintained in a finite population. Genetics, 61,893-903.
Knutsen H, Jorde PE, André C, Stenseth NC (2003) Fine-scaled geographic population structuring in a highly mobile marine species: the Atlantic cod. Mol Ecol, 12, 385-394.
Krützen M, Valsecchi E, Connor RC, Sherwin WB (2001) Characterization of microsatellite loci in Tursiops aduncus. Mol Ecol Notes, 1, 170-172.
Krützen M, Sherwin WB, Berggren P, Gales N (2004) Population structure in an inshore cetacean revealed by microsatellite and mtDNA analysis: bottlenose dolphins (Tursiops sp.) in Shark Bay, Western Australia. Mar Mammal Sci, 20(1), 28-47.
Marshall TC, Slate J, Kruuk L, Pemberton JM (1998) Statistical confidence for likelihood-based paternity inference in natural populations. Mol Ecol, 7(5), 639-655.
Miller M (2005) Alleles In Space (AIS): Computer software for the joint analysis of interindividual spatial genetic information. J Hered, 96, 722-724.
Möller LM, Beheregaray LB (2004) Genetic evidence for sex-biased dispersal in resident bottlenose dolphins (Tursiops truncatus). Mol Ecol, 13, 1607-1612.
Natoli A, Peddemors VM, Hoelzel AR (2004) Population structure and speciation in the genus Tursiops based on microsatellite and mitochondrial DNA analyses. J Evol Biol, 17, 363-375.
Natoli A, Birkun A, Aguilar A, Lopez A, Hoelzel AR (2005) Habitat structure and the dispersal of male and female bottlenose dolphins (Tursiops truncatus) based on microsatellite and mitochondrial DNA analyses. Proc R Soc London B, 272, 1217-1226.
Natoli A, Cañadas A, Peddemors VM, Aguilar A, Vaquero C, Fernández-Piqueras P, Hoelzel AR (2006) Phylogeography and alpha taxonomy of the common dolphin (Delphinus sp.). J Evol Biol, 19, 943-954.
Nei M, Tajima F, Tateno Y (1983) Accuracy of estimated phylogenetic trees from molecular data. II. Gene frequency data. J Mol Evol, 19, 153-170.
electrophoretically detectable alleles in a genetic population. Genetic Res, 22, 201-204.
Park SDE (2001) Trypanotolerance in West African cattle and the population genetic effects of selection. PhD dissertation, University of Dublin.
Parsons KM, Noble LR, Reid RJ, Thompson PM (2002) Mitochondrial genetic diversity and population structuring of UK bottlenose dolphins (Tursiops truncatus): is the NE Scotland population demographically and geographically isolated? Biol Conserv, 108, 175-182.
Parsons KM, Durban JW, Claridge DE, Herzing DL, Balcomb KC, Noble LR (2006) Population genetic structure of coastal bottlenose dolphins (Tursiops truncatus) in the northern Bahamas. Mar Mamm Sci, 22, 276-298.
Pritchard JK, Stephens M, Donnelly P (2000) Inference of population structure using multilocus genotype data. Genetics, 155, 945-959.
Rice WR (1989) Analysing tables of statistical tests. Evolution, 43, 223-225.
Richard KR, Whitehead H, Wright JM (1996) Polymorphic microsatellites from sperm whales and their use in the genetic identification of individuals from naturally sloughed pieces of skin. Mol Ecol, 5, 313-315.
Ritland K. (2000) Marker-inferred relatedness as a tool for detecting heritability in nature. Mol Ecol, 9, 1195-1204.
Rosel PE, Dizon AE, Heyning JE (1994) Genetic analysis of sympatric morphotypes of common dolphins (genus Delphinus). Mar Biol, 119, 159-167.
Santos RS, Hawkins S, Monteiro LR, Alves M, Isidro EJ (1995) Case studies and reviews: Marine research, resources and conservation in the Azores. Aquat Conserv - Mar Freshw Ecosys, 5, 311–354.
Segura I, Rocha-Olivares A, Flores-Ramírez S, Rojas-Bracho L (2006) Conservation implications of the genetic and ecological distinction of Tursiops truncatus ecotypes in the Gulf of California. Biol Conserv, 133, 336-346.
Sellas AB, Wells RS, Rosel PE (2005) Mitochondrial and nuclear DNA analyses reveal fine scale geographic structure in bottlenose dolphins (Tursiops truncatus) in the Gulf of Mexico. Conserv Genet, 6, 715–728.
Shaw PW, Pierce GJ, Boyle PR (1999) Subtle population structuring within a highly vagile marine invertebrate, the veined squid Loligo forbesi, demonstrated with microsatellite DNA markers. Mol Ecol, 8, 407-417.
Shinohara M, Domingo-Roura X, Takenaka O (1997) Microsatellites in the bottlenose dolphin Tursiops truncatus. Mol Ecol, 6, 695-696.
Silva MA (2006) Population biology of bottlenose dolphins in the Azores Archipelago. Unpublished PhD thesis. University of St Andrews.
Silva MA, Prieto R, Magalhães S, Cabecinhas R, Cruz A, Gonçalves JM, Santos RS (2003) Occurrence and distribution of cetaceans in the waters around the Azores (Portugal), Summer and Autumn 1999-2000. Aquat Mammal, 29(1), 77-83.
Slatkin M (1995) A measure of population subdivision based on microsatellite allele frequencies. Genetics, 139, 457-462.
Tamura K, Nei M (1993) Estimation of the number of nucleotide substitutions in the control region of mitochondrial DNA in humans and chimpanzees. Mol Biol Evol, 10, 512-526. Templeton AR, Crandall KA, Sing CF (1992) A cladistic analysis of phenotypic associations
with haplotypes inferred from restriction endonuclease mapping and DNA sequence data. III. Cladogram estimation. Genetics, 132, 619-633.
Torres LG, Rosel PE, D’Agrosa C, Read AJ (2003) Improving management of overlapping bottlenose dolphin ecotypes through spatial analysis and genetics. Mar Mamm Sci, 19, 502-514.
Valsecchi E, Amos W (1996) Microsatellite markers for the study of cetacean populations. Mol Ecol, 5, 151-156.
Wang JY, Chou LS, White BN (1999) Mitochondrial DNA analysis of sympatric morphotypes of bottlenose dolphins (genus: Tursiops) in Chinese waters. Mol Ecol, 8, 1603-1612.
Wang JY, Chou LS, White BN (2000) Osteological differences between two sympatric forms of bottlenose dolphins (genus Tursiops) in Chinese waters. J Zool Lond, 252, 147-162.
Weir BS, Cockerham CC (1984) Estimating F-statistics for the analysis of population structure. Evolution, 38, 1358-1370.
Wells RS, Rhinehart HL, Cunningham P, Whaley J, Baran M, Koberna C, Costa DP (1999) Long distance offshore movements of bottlenose dolphins. Mar Mammal Sci, 15, 1098-1114. Wright S (1978) Evolution and the Genetics of populations. Vol. 4: variability within and among natural populations. University of Chicago Press, Chicago.
Figure 1. A. Map of the Atlantic Basin showing the populations for which mtDNA sequences
were available (Sampling site abbreviations: AZ: Azores, MA: Madeira, MP: Mainland Portugal, UK: United Kingdom, MS: Mediterranean Sea, NWAP: North-West Atlantic Pelagic, EA: East Atlantic, SWA: South-West Atlantic, NWAC: North-West Atlantic Coastal, BAH: Bahamas, GM: Gulf of Mexico).
B. Enlarged map of the Azorean archipelago, with sample collecting sites indicated by plain
triangles. One triangle main represent more than one sample.
SWA
EA
BAH
NWAP
NWAC
GM
AZ
MS
UK
MA
MP
SWA
EA
BAH
NWAP
NWAC
GM
AZ
MS
UK
MA
MP
37.50 38.50 39.50Figure 2. Median Joining network obtained with differential weighting of transitions, transversions and indels. Circle size is proportional to the number of samples. Filling patterns represent the provenance of the samples (red = western, yellow = central, orange = seamounts, green = eastern group of Azorean islands, blue = Madeira, black = Mainland). Connector length is proportional to the number of substitutions. Small open circles represent potential intermediate haplotypes that were not sampled.
Tables 1. Population differentiation within the archipelago of the Azores (2A) and between
the Portuguese archipelagos and Mainland (2B) based on 604 bp-long D-loop sequences: ΦST
with level of significance (*: p < 0.05, **: p < 0.01).
A N Western Central Seamounts Eastern
Western 9 - 0.163** 0.121 0.025
Central 46 - -0.052 0.032
Seamounts 5 - -0.011
Eastern 23 -
B n Azores Madeira Mainland
Azores 83 - 0.059* 0.089
Madeira 25 - 0.020
Mainland 7 -
Table 2. Asymmetric migration rates (Nm) with 95% confidence intervals (between brackets)
between populations, based on DNA sequences. All estimates were significantly different from zero (p < 0.001).
From \ To n Azores Madeira NWAP
Azores 83 - 0.4 1.0 [0.1-3.9] [0.2-8.6] Madeira 25 222.1 - 9.5 [67.7-671.3] [2.3-30.3] NWAP 36 10.6 1.4 - [2.3-220.1] [0.3-6.4]
Tables 3. AMOVA with samples grouped first according to island groups (island gr.) and
then according to habitats (4A), or first according to habitats and then according to island groups (4B) based on D-loop sequences (Tamura-Nei distances) and microsatellites (number of different alleles).
A D-loop Microsatellites
Source of variation df % var F p df % var F p
Among habitats (Fct) 1 -3.78 -0.038 0.951 1 -0.02 -0.001 0.335
Among island groups within habitats (Fsc)
7 5.28 0.051 0.172 7 0.21 0.002 0.352
Within island gr. (Fst) 98 98.50 0.015 0.074 207 99.81 0.002 0.329
B D-loop Microsatellites
Source of variation df % var F p df % var F p
Among island gr. (Fct) 4 8.60 0.086 0.250 4 -0.20 -0.002 0.447 Among habitats within
island gr. (Fsc) 4 -4.54 -0.050 0.703 4 0.39 0.004 0.085
Within habitats (Fst) 98 95.95 0.041 0.076 207 99.81 0.002 0.329 df: degree of freedom, % var: percentage of variance, F: fixation indices, p: probability of significance.
Table 4. Gene diversity (H) and nucleotide diversity (π) by population with standard deviation (s.d.), and haplotype sharing between the Portuguese archipelagos and Mainland and the Atlantic Basin populations, based on truncated 296 bp sequences.
Azores Madeira Mainland NWAP EA MS UK BAH GM NWAC
Study This study This study This study Natoli et al. 2004 Natoli et al. 2004 Natoli et al. 2004 Parsons et al. 2002* Parsons et al. 2006 Natoli et al. 2004 Natoli et al. 2004 N. samples 83 24 7 25 17 18 38 55 12 29 N. haplotypes 29 14 5 11 5 11 7 31 6 6 H s.d. 0.957 0.008 0.9270.033 0.8570.137 0.8770.049 0.0860.743 0.9350.035 0.4520.097 0.6680.061 0.8180.084 0.4260.113 π s.d. 0.015 0.008 0.012 0.007 0.014 0.008 0.022 0.012 0.016 0.009 0.022 0.012 0.009 0.006 0.008 0.005 0.007 0.005 0.006 0.004 Published reference AF268357G 1 0 1 0 0 0 1 0 0 0 AF268357I 10 1 0 0 0 0 1 0 0 0 ENA1 3 1 0 0 2 0 2 0 0 0 MS1 2 0 0 1 3 3 28 0 0 0 MS4 8 4 3 0 8 3 0 0 0 0 MS5 3 1 0 0 0 1 0 0 0 0 MS7 4 1 0 0 0 2 0 0 0 0 MS9 0 0 1 0 0 1 0 0 0 0 WNAPd 1 1 0 2 0 0 0 0 0 0 WNAPe 2 3 0 2 0 0 0 0 0 0 WNAPw 1 0 0 3 0 0 0 0 0 0 WNAPx 3 5 0 3 0 0 0 0 0 0
UK: United Kingdom (* including 9 sequences from Natoli et al. 2004), MS: Mediterranean Sea, NWAP: North-West Atlantic Pelagic, EA: East Atlantic, SWA: South-West Atlantic, NWAC: North-West Atlantic Coastal, BAH: Bahamas, GM: Gulf of Mexico
Table 5. Population differentiation between the Portuguese archipelagos and the Mainland,
and other populations of the Atlantic Basin, based on 296 bp-long D-loop sequences: ΦST,
with level of significance (*: p < 0.05, **: p < 0.01 and ***: p < 0.001).
Ecotype n Azores (n = 83) Madeira (n = 24) Mainland (n = 7) NWAP Pelagic 25 0.035 0.054 0.101 EA ? 17 0.126** 0.026 0.019 MS Coastal 18 0.104** 0.096* 0.006 UK Coastal? 38 0.354*** 0.374*** 0.435*** BAH Coastal 55 0.583*** 0.648*** 0.696*** GM Coastal 12 0.584*** 0.681*** 0.727*** NWAC Coastal 29 0.614*** 0.703*** 0.754***
NWAP: North-West Atlantic Pelagic, EA: East Atlantic, MS: Mediterranean Sea, SWA: South-West Atlantic, UK: United Kingdom, BAH: Bahamas, GM: Gulf of Mexico, NWAC: North-West Atlantic Coastal.
Table 6. Locus-specific information: allelic diversity (K), observed (HO) and expected (HE)
heterozygosity, Polymorphism Information Content (PIC), and probability of departure from Hardy-Weinberg Equilibrium within populations (HWE p-value).
Locus K HO HE PIC HWE (p)
D22 11 0.846 0.869 0.851 0.279 EV5 3 0.558 0.556 0.460 0.586 EV14 14 0.870 0.894 0.881 0.234 EV37 25 0.889 0.891 0.877 0.463 FCB1 12 0.812 0.832 0.812 0.338 FCB17 25 0.906 0.887 0.873 0.818 Mk6 19 0.922 0.893 0.879 0.880 Mk8 10 0.692 0.769 0.734 0.032 Sw10 3 0.621 0.595 0.524 0.740 Sw19 13 0.836 0.874 0.856 0.161 Mean +/-s.d. 13.5 +/- 7.7 0.992 +/-0.127 0.806 +/-0.128 0.775 +/-0.156
Tables 7. Population differentiation within the archipelago of the Azores (7A) and between
the Portuguese archipelagos and Mainland (7B) based on microsatellites: FST (below
diagonal) and RST (above diagonal) with level of significance (*: p < 0.05, **: p < 0.01, ***:
p < 0.001).
A n Western Central Seamounts Eastern
Western 9 - 0.032* 0.028 0.035
Central 46 0.007 - 0.034 -0.011
Seamounts 5 -0.010 0.001 - 0.021
Eastern 23 0.002 -0.001 -0.001 -
* p = 0.046
B n Azores Madeira Mainland
Azores 83 - -0.001 0.027
Madeira 27 0.001 - 0.010
Mainland 7 0.011 0.014 -