HAL Id: hal-03019182
https://hal.archives-ouvertes.fr/hal-03019182
Submitted on 14 Dec 2020
HAL is a multi-disciplinary open access
archive for the deposit and dissemination of
sci-entific research documents, whether they are
pub-lished or not. The documents may come from
teaching and research institutions in France or
abroad, or from public or private research centers.
L’archive ouverte pluridisciplinaire HAL, est
destinée au dépôt et à la diffusion de documents
scientifiques de niveau recherche, publiés ou non,
émanant des établissements d’enseignement et de
recherche français ou étrangers, des laboratoires
publics ou privés.
gamma: An R Package for Dose Rate Estimation from
In-Situ Gamma-Ray Spectrometry Measurements
Brice Lebrun, Nicolas Frerebeau, Guilhem Paradol, Guillaume Guérin,
Norbert Mercier, Chantal Tribolo, C. Lahaye, Magali Rizza
To cite this version:
Brice Lebrun, Nicolas Frerebeau, Guilhem Paradol, Guillaume Guérin, Norbert Mercier, et al..
gamma: An R Package for Dose Rate Estimation from In-Situ Gamma-Ray Spectrometry
Measure-ments. Ancient TL, Luminescence Dosimetry Laboratory, 2020, 38 (2), pp.1-5. �hal-03019182�
Brice Lebrun,
1∗Nicolas Frerebeau,
1Guilhem Paradol
2, Guillaume Guérin,
1Norbert Mercier,
1Chantal Tribolo,
1Christelle Lahaye,
1Magali Rizza
31IRAMAT-CRP2A, UMR 5060, CNRS - Université Bordeaux Montaigne, France 2SyMMES, UMR 5819 - CEA, CNRS, Université Grenoble Alpes, France
3CEREGE, Aix Marseille Univ, CNRS, IRD, INRAE, Coll France
∗Corresponding Author: brice.lebrun@u-bordeau-montaigne.fr
Received: September 25, 2020; in final form: October 28, 2020
Abstract
In situ gamma spectrometry is a useful tech-nique used by the Luminescence and ESR dating community to improve the representa-tivity of dose rate measurements in the context of gamma dose rate heterogeneities around dated material. This paper presents `gamma', a new R package and its graphical user in-terface `gammaShiny', allowing a reliable and reproducible workflow for in situ gamma spectrometry data analysis in the context of luminescence and ESR dating.
Keywords: Archaeology, Geochronology, Luminescence dating, Gamma spectrometry
1. Introduction
In situ gamma spectrometry is a powerful tool used in luminescence dating to tackle gamma dose rate heterogene-ity (Aitken, 1998; Klusoˇn, 2010). A gamma spectrometer probe records gamma rays emitted within a sphere of radius equal to 30 – 50 cm (Figure 1 in Guérin & Mercier,2011) whereas a classic BeGe laboratory gamma spectrometer with planar or coaxial geometry only characterizes samples of a few dozen cubic centimeters,thus greatly improving the rep-resentativity of the measurement (Gilmore,2008).
Different techniques are currently used in luminescence and ESR dating field to determine the gamma dose rate from in situgamma spectrometry measurements:
• The ‘window technique’, that consists in selecting dif-ferent parts of the spectra to quantify the U and Th-series and K radioelements contents in the sediment, around the probe.
• The ‘threshold techniques’, that allow a direct determi-nation of the gamma dose rate without individual deter-mination of K, U and Th series radioelements. Murray et al.(1978) have shown that the gamma dose rate can be estimated using the proportionality existing between the number of counts measured above a certain energy and the gamma dose rate. Mercier & Falguères(2007) developed this approach for a NaI(Tl) probe. They con-clude that the measurement time (and consequently the risk of changing temperature during the measurement) is significantly reduced in comparison with the ‘window technique’.
There are two methods based on the ‘threshold tech-nique’: in counts and in energy. In both cases, Guérin &
Mercier (2011) have shown that the environmental gamma
dose rate determined in this way does not depend on water presence, nor on U-series disequilibrium. They have also shown few dependence on the gamma dose rate with the na-ture of the sediment.
The majority of in situ gamma-ray spectrometers produce energy shifted and spectrally distorted spectra. This could be due to the fact that detector crystals (usually LaBr or NaI) are often used in unstable temperature conditions (Casanovas et al.,2012). As a result, spectrum processing is required before conversion from a spectrum to gamma dose rate.
A typical workflow for energy shifting correction requires manual identification of reference peaks. This is usually
Figure 1. A typical workflow within the`gamma' package.
performed using proprietary software such as Genie2000® (Canberra division of Mirion technologies, Windows OS only). Once reference peaks are identified, a new channel-energy curve is generated, taking into account the apparent shift between the observed and theoretical energies of these peaks. To this day, there is no turnkey solution for these steps and personal or laboratory-based solutions are implemented, e.g. Visual Basic Advance® macros within Microsoft Ex-cel®.
There are two challenging issues to these existing ap-proaches. The first one is the lack of transparency: details of spectrum processing are not presented in the publications and researcher’s internally developed solutions are not made available to the community, greatly limiting reproducibility and reliability of the measurements (seeKreutzer et al.,2017 for a broader discussion in the field of luminescence dating). Secondly, the use of proprietary software limits their access by the community, hindering their maintenance and evolu-tion.
To address theses differents issues, we present an inte-grated solution to analyse in situ gamma spectrometry data, from raw spectrum processing to gamma dose-rate estima-tion: the R package `gamma'. The R programming lan-guage (R Core Team,2020) has many advantages, starting
with its ease of learning and use. R is available on all com-puter platforms and its community offers efficient support. R is distributed under the GNU General Public License (there-fore free of charge), ensuring transparency and modularity. Finally, several R packages dedicated to geochronology al-ready exist (such as the ’Luminescence’ package; Kreutzer et al.,2012).
2. The R package
`gamma'
The`gamma' package allows the user to import, inspect and correct the energy scale of one or multiple spectra. It pro-vides methods for estimating the gamma dose rate by the use of built-in or custom calibration curves. A graphical user in-terface (GUI) is also provided through the dedicated R pack-age ’gammaShiny’, using the ’shiny’ packpack-age (Chang et al., 2020).
2.1. Workflow overview
This section present a typical workflow within the `gamma' package (Figure 1). A walk-through guide is also provided in the package manual. The following examples can be reproduced in any integrated development
environ-might not feel comfortable with the use of the command line. However, only the full publication of scripts along with the results guarantees the reproducibility of published studies.
2.1.1 Step 1: import and inspect a gamma spectrum The `gamma' package supports the most common type of spectrum files: Canberra CAM (.CNF) and Programmers Toolkit files (.TKA). This prevents spending time on data transformation and preserves file metadata. The read() function allows to import a CNF-file with the path of the file as a single argument. When the path leads to a directory in-stead of a single file, all spectra included in the directory are imported.
1 ## Get an example file
2 cnf <- system.file( 3 "extdata/LaBr.CNF", 4 package = "gamma" 5 ) 6 ## Import data 7 spc <- read(cnf) 8 spc
Spectra are stored as instances of an S4 class. Many muta-tor methods and group generic functions are available for ba-sic operations and data wrangling. Theplot(spc) method allows to quickly graphically inspect the data.
2.1.2 Step 2: adjust the energy scale
The energy calibration of a spectrum is a challenging part and must be performed before dose rate estimation. The so-lution presented here requires the user to specify the position (channel) of at least three observed peaks and their corre-sponding theoretical energies (in keV). A second order poly-nomial model is fitted on these energy versus channel values, then used to predict the new energy scale of the spectrum.
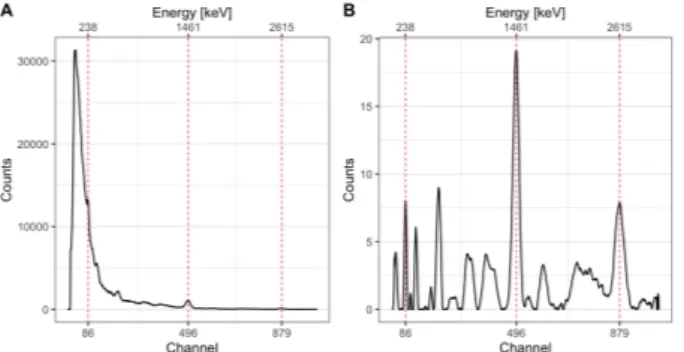
The package allows the user to provide the channel-energy pairs to be used. However, the spectrum can be noisy so it is difficult to properly identify the peak channel. In this case, a better approach may be to pre-process the spec-trum (variance-stabilization, smoothing and baseline correc-tion) and perform a peak detection (Figure 2). Once the peak detection is satisfactory, the user can set the corresponding energy values (in keV) and use these lines to calibrate the energy scale of the spectrum. All signal processing methods are prefixed withsignal_.
identification of peaks with a low signal-to-noise ratio. This particularly targets higher energy peaks. To per-form this step, a function is applied to all the intensity values of the spectrum with signal_stabilize(). The example below uses a square root transformation but any user defined function can be used.
Smoothing Counting artefacts can be removed by smooth-ing intensities withsignal_smooth(). Several meth-ods are implemented here such as (weighted) sliding-average and Savitzky-Golay filter (Savitzky & Golay,
1964; Gorry, 1990). The example below uses the
Savitzky-Golay filter as this method usually provides better results, at the expense of a longer computing time. Baseline correction Spectrum baseline can be estimated and removed withsignal_correct() using special-ized SNIP algorithm (Ryan et al.,1988;Morháˇc et al., 1997;Morháˇc & Matoušek,2008).
Peak detection find_peaks() allows automatic peak po-sition detection on a baseline-corrected spectrum. For a successful detection, a local maximum has to be the highest one in a given window and has to be higher than ktimes the noise (estimated as the Median Absolute De-viation) to be recognized as a peak.
Energy calibration The energy scale calibration needs the energy values of detected peaks to be set. calibrate_energy() then fits a second order poly-nomial model to predict the new spectrum energy scale.
1 library(magrittr)
2 ## Signal processing 3 tmp <- spc %>% 4 signal_slice() %>%
5 signal_stabilize(f = sqrt) %>%
6 signal_smooth(method = "savitzky", m = 21) ,→ %>%
7 signal_correct(method = "SNIP") 8 ## Peak detection
9 pks <- peaks_find(tmp)
10 set_energy(pks) <- c(238, NA, NA, NA,
11 1461, NA, NA, 2615)
12 ## Energy scale calibration
Figure 2. (A) Raw gamma ray spectrum from in situ measurement; (B) Processed spectrum used for peak finding along with the de-tected peaks.
2.1.3 Step 3: gamma dose-rate estimation
To estimate the gamma dose rate, one of the calibration curves distributed with this package can be used (Figure 3). These built-in curves are in use in several luminescence dat-ing laboratories and can be used to replicate published re-sults. As these curves are instrument specific, the user may have to build its own curve. The`gamma' package provides a set of functions to build custom calibration curves. 1 ## Load the calibration curve
2 data("BDX_LaBr_1", package = "gamma") 3 ## Estimate the gamma dose rate
4 doses <- dose_predict(BDX_LaBr_1, spc2) 5 doses
The construction of a calibration curve withdose_fit() requires a set of reference spectra for which the gamma dose rate is known (seeMiallier et al.,2009for the reference val-ues in use at the CRP2A laboratory) and a background noise measurement. First, each reference spectrum is integrated over a given interval, then normalized to active time and cor-rected for background noise. The dose rate is finally mod-elled by the integrated signal value used as a linear predictor (York et al.,2004). dose_predict() returns the predicted dose rate value with both the count and energy threshold ap-proaches.
3. Discussion
The`gamma' package provides a convenient and repro-ducible toolkit for in situ gamma spectrometry data analysis. Along with the dedicated ’gammaShiny’ package (GUI), it offers a useful set of functions for spectra processing, cali-bration curve building and dose rate estimation.
The`gamma' package allows batch processing of spectra. To ensure the reliability of the produced results, manual ver-ification is strongly recommended since automatic detection may sometime produce unreliable results, especially when the processed spectra display poor signal-to-noise ratios. In the future, improvement of the automatic peak detection pro-cess is to be expected (Guilhem Paradol, pers. comm.).
Figure 3. Built-in LaBr calibration curve in used at the CRP2A lab-oratory (Bordeaux).
4. Conclusions
The`gamma' package is distributed over the Comprehen-sive R Archive Network (CRAN; http://cran.r-project.org). It is provided under the General Public Licence (GNU GPL3) conditions: the code is open and anyone can re-view it. Source code and installation instructions are available on GitHub athttps://github.com/crp2a/gammaand
https://github.com/crp2a/gammaShiny. Users are invited to contribute, share feedback, request new features or report bugs via the GitHub plateform. As for the ’Luminescence’ package (Kreutzer et al.,2012;Fuchs et al.,2015), future im-provements to the`gamma' package and associated GUI are intended to be community driven.
5. Acknowledgements
This work received a state financial support managed by the Agence Nationale de la Recherche (France) through the program Investissements d’avenir ref. 10-LABX-0052. The project leading to this publication has received funding from the Excellence Initiative of AixMarseille University -A*Midex, a French ’Investissements d’Avenir’ programme ref. 11-IDEX-0001. BL thanks Didier Miallier (Laboratoire de Physique de Clermont, UMR 6533) for his help during the calibration of the NaI probe.
References
Aitken, M. J. An introduction to optical dating: the dating of qua-ternary sediments by the use of photon-stimulated luminescence. Oxford University Press, 1998.
Dating Analysis: An Exemplary Workflow Using the R Package ‘Luminescence’. Quaternary International, 362: 8–13, 2015. doi: 10.1016/j.quaint.2014.06.034.
Gilmore, G. R. Practical Gamma-Ray Spectrometry. John Wiley & Sons, Ltd, 2nd edition, 2008. ISBN 978-0-470-86198-1 and
978-0-470-86196-7.
Gorry, P. A. General Least-Squares Smoothing and Differentiation by the Convolution (Savitzky-Golay) Method. Analytical Chem-istry, 62(6): 570–573, 1990. doi: 10.1021/ac00205a007. Guérin, G. and Mercier, N. Determining Gamma Dose Rates by
Field Gamma Spectroscopy in Sedimentary Media: Results of Monte Carlo Simulations. Radiation Measurements, 46(2): 190– 195, 2011. doi: 10.1016/j.radmeas.2010.10.003.
Klusoˇn, J. In-Situ Gamma Spectrometry in Environmental Monitor-ing. Applied Radiation and Isotopes, 68(4): 529–535, 2010. doi: 10.1016/j.apradiso.2009.11.041.
Kreutzer, S., Schmidt, C., Fuchs, M. C., Dietze, M., Fischer, M., and Fuchs, M. Introducing an R Package for Luminescence Dat-ing Analysis. Ancient TL, 30(1): 1–8, 2012.
Kreutzer, S., Burow, C., Dietze, M., Fuchs, M. C., Fischer, M., and Schmidt, C. Software in the Context of Luminescence Dating: Status, Concepts and Suggestionsexemplified by the R Package ‘Luminescence’. Ancient TL, 35(2): 1–11, 2017.
Mercier, N. and Falguères, C. Field Gamma Dose-Rate Measure-ment with a NaI(Tl) Detector: Re-Evaluation of the "Threshold" Technique. Ancient TL, 25(1): 1–4, 2007.
Miallier, D., Guérin, G., Mercier, N., Pilleyre, T., and Sanzelle, S. The Clermont Radiometric Reference Rocks: A Convenient Tool for Dosimetric Purposes. Ancient TL, 27(2): 37–44, 2009. Morháˇc, M. and Matoušek, V. Peak Clipping Algorithms for
Back-ground Estimation in Spectroscopic Data. Applied Spectroscopy, 62(1): 91–106, 2008. doi: 10.1366/000370208783412762. Morháˇc, M., Kliman, J., Matoušek, V., Veselský, M., and Turzo, I.
Background Elimination Methods for Multidimensional Coinci-dence gamma-Ray Spectra. Nuclear Instruments and Methods in Physics Research Section A: Accelerators, Spectrometers, De-tectors and Associated Equipment, 401(1): 113–132, 1997. doi: 10.1016/S0168-9002(97)01023-1.
Murray, A. S., Bowman, S. G. E., and Aitken, M. J. Evalua-tion of the Gamma Dose-Rate ContribuEvalua-tion. In Zimmerman, D. W., Aitken, M. J., and Mejdahl, V. (eds.), A Specialist Seminar on Thermoluminescence Dating, volume 2 of PACT, pp. 84–96. Conseil de l’Europe, 1978.
Savitzky, A. and Golay, M. J. E. Smoothing and Differentiation of Data by Simplified Least Squares Procedures.Analytical Chem-istry, 36(8): 1627–1639, 1964. doi: 10.1021/ac60214a047. York, D., Evensen, N. M., Martínez, M. L., and De Basabe
Del-gado, J. Unified Equations for the Slope, Intercept, and Standard Errors of the Best Straight Line. American Journal of Physics, 72(3): 367–375, 2004. doi: 10.1119/1.1632486.