HAL Id: hal-03019022
https://hal-cnrs.archives-ouvertes.fr/hal-03019022
Submitted on 7 Dec 2020
HAL is a multi-disciplinary open access
archive for the deposit and dissemination of sci-entific research documents, whether they are pub-lished or not. The documents may come from teaching and research institutions in France or abroad, or from public or private research centers.
L’archive ouverte pluridisciplinaire HAL, est destinée au dépôt et à la diffusion de documents scientifiques de niveau recherche, publiés ou non, émanant des établissements d’enseignement et de recherche français ou étrangers, des laboratoires publics ou privés.
Structures and NMR spectra of short amylose-lipid
complexes. Insight using molecular dynamics and DFT
quantum chemical calculations
Adrien Schahl, Valérie Réat, Franck Jolibois
To cite this version:
Adrien Schahl, Valérie Réat, Franck Jolibois. Structures and NMR spectra of short amylose-lipid complexes. Insight using molecular dynamics and DFT quantum chemical calculations. Carbohydrate Polymers, Elsevier, 2020, 235, pp.115846. �10.1016/j.carbpol.2020.115846�. �hal-03019022�
Structures and NMR spectra of short amylose-lipid
complexes. Insight using molecular dynamics and
DFT quantum chemical calculations
Adrien Schahl1,2, Valérie Réat2, Franck Jolibois1
1) LPCNO, Université Fédérale de Toulouse Midi-Pyrénées, INSA-CNRS-UPS, 135 avenue de Rangueil, 31077 Cedex 4 Toulouse, France
2) Institut de Pharmacologie et de Biologie Structurale, UMR 5089, CNRS - Université de Toulouse, UPS BP 64182, 205 route de Narbonne, 31077 Toulouse, Cedex 04, France
Carbohydrate Polymers 235 (2020) 115846 https://doi.org/10.1016/j.carbpol.2020.115846
Introduction.
A member of the family of polysaccharides, amylose is an essentially linear polymer composed of [α-14]-linked glucose residues (Takeda, Shitaozono, & Hizukuri, 1990). It has been the subject of much attention and serves as a model for the study of more complex polysaccharides. The analysis of its interactions with other molecules is of great importance in many scientific fields: food chemistry, biological systems, pharmaceutical sciences (Carbinatto, Ribeiro, Colnago, Evangelista, & Cury, 2016). Amylose adopts specific conformations, including double helical and V-type helical forms, or unstructured conformations, depending on its environment (Burghammer et al., 2009; Gessler et al., 1999; Godet, Buléon, Tran, & Colonna, 1993; Horii, Yamamoto, Hirai, & Kitamaru, 1987; Le Bail, Rondeau, & Buléon, 2005; Nuessli, Putaux, Le Bail, & Buléon, 2003; Takahashi, Kumano, & Nishikawa, 2004). In particular, it has been demonstrated that amylose chains fold around guest hydrophobic molecules and in such complexes adopts V-helix conformations (Brisson, Chanzy, & Winter, 1991; Godet et al., 1993; Nuessli et al., 2003; Rappenecker & Zugenmaier, 1981; Whittam et al., 1989).
An experimental description of the structure of amylose and of its interactions with other molecules relies on X-ray diffraction and NMR studies. NMR experiments revealed specific
13C chemical shifts that are characteristic of the V-helix form of amylose complexes (Gidley &
Bociek, 1988; Veregin, Fyfe, & Marchessault, 1987; Zabar, Lesmes, Katz, Shimoni, & Bianco-Peled, 2009). Numerous efforts have sought to characterise the structure of amylose using molecular dynamics approaches (Cheng et al., 2018; Cheng, Zhu, Hamaker, Zhang, & Campanella, 2019; Feng et al., 2015, 2017; López, De Vries, & Marrink, 2012; Tusch, Krüger, & Fels, 2011). However, the theoretical link between this specific V-helix conformation and its associated chemical shifts has not previously been explored. The precise calculation of NMR parameters using quantum chemistry methods is now possible for large molecular systems. The
calculation of chemical shifts provides theoretical support to experimental data, facilitating resonance assignment or the prediction of other parameters. In addition, the atomistic level of calculation coupled with the ability to include solvent effects and/or to take into account specific interactions with other molecules, allows experimental results to be interpreted in terms of conformational parameters and the effects of interactions.
To the best of our knowledge, the study of polysaccharides using quantum chemistry methods has focused mainly on small systems (Toukach & Ananikov, 2013). These may provide insight into the variation of chemical shifts in terms of amylose structure but conformational properties alone are not sufficient to fully understand the changes in chemical shifts that occur when amylose adopts a specific form such as the V-helix. In this case, a sufficiently large system is needed to include all the factors that influence the calculation of chemical shielding. In addition, since the amylose helix undergoes fluctuations in structure as function of time (Cheng et al., 2018; Feng et al., 2015; López et al., 2012; Tusch et al., 2011) we must take into account the influence of such dynamics on NMR spectra.
We present here a detailed study of the structure and NMR parameters of amylose chains of increasing size and their interactions with palmitic acid. Analysis of the stability and complexation process of these molecular structures was undertaken using molecular dynamics
(MD) simulations. In addition, 13C chemical shifts were calculated using Density Functional
Theory (DFT) methods. In order to establish a computational strategy applicable to polysaccharide-host complexes of various sizes, the choice of structures used for the calculation of the NMR parameters was analyzed: either a structure calculated by geometry optimization at the DFT level or a set of 50 structures extracted from MD simulations was used. We show that longer polymers tend to stabilize the V-helix formation and their calculated spectra are closer to the experiment. Moreover, our calculations show that the incorporation of flexibility
(on nanosecond time scale explored) is essential for the accurate reproduction of experimental spectra.
2. Computational details.
2.1. Classical molecular dynamics.
The starting structure of palmitic acid was created using Avogadro molecular software (Hanwell et al., 2012). Two types of amylose chain were constructed. The first was constructed as starting point for studying the stability of amylose-fatty acid complex and consisted of a 19-residue chain folded around a molecule of palmitic acid, in order to obtain a structure similar to that determined crystallographically (Rappenecker & Zugenmaier, 1981). The second type was constructed to analyse the complexation process according to the size of the amylose and consisted of an unfolded amylose chain of 7, 9, 11, 13, 15, 17 or 19 residues in interaction with
palmitic acid. The C8 carbon of palmitic acid was positioned at 5.0 Å from the centre of mass
of the 4th or 10th residue of the amylose chain of less than or greater than 13 residues,
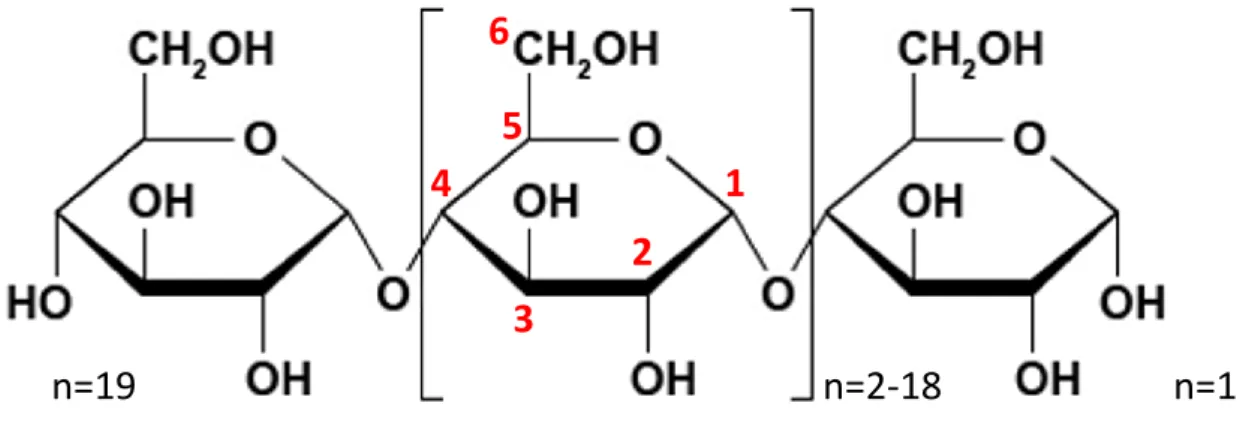
respectively. In both cases, the LEaP program of AMBER suite (Case et al., 2018) was used. For the folded amylose, dihedral angles φ (O5-C1-O4'-C4') and ψ (C1-O4'-C4'-C3') were set to 107.5° ± 4.5° and 110.8° ± 5.5°, respectively (Figure 1; primes denote atoms of the preceding residue). For the unfolded structures, dihedral angles φ and ψ angles were arbitrary set to 93.4° ± 0.1° and 93.8° ± 0.1°, respectively. The amylose-palmitic acid systems were solvated in a box of water such that the solute was placed set at 20 Å from the box boundaries. Box sizes ranged
from 60x68x63 Å3 (6,900 water molecules) to 86x85x86 Å3 (17,340 water molecules) for
Figure 1: Carbon atom numbering of glucose residues.
All MD simulations were performed using NAMD software (Phillips et al., 2005). Langevin dynamics were used to control the temperature and, for simulations within the isothermal-isobaric (NPT) ensemble, Nose-Hoover Langevin piston was employed to maintain the pressure at a constant value of 1 atmosphere. The propagation of the atoms was carried out using the velocity Verlet integration method with a time step of 1 fs. The energy gradients required to solve the equations of motion were computed using GLYCAM-06 (Kirschner et al., 2008) and LIPID-14 (Dickson et al., 2014) force fields for the description of amylose and palmitic acid, respectively. A cut-off of 15 Å and a switching function starting at 12 Å were applied for non-bonded interactions. The Particle Mesh Ewald (Darden et al., 1993) method was used for the complete electrostatic calculation using periodic boundary conditions. TIP3P model (Jorgensen, Chandrasekhar, Madura, Impey, & Klein, 1983) was used to describe water molecules. All MD simulations followed the same computational protocol: After a short 1000 cycle energy minimization procedure using a conjugate gradient algorithm, a slow increase in temperature from 5 K to 295 K in increments of 10 K was carried out with a 5 ps simulation at each temperature. The MD equilibration was allowed to continue at 300 K, for 800 ps under the NPT ensemble. The effective production step was then performed for at least 95 ns in the canonical ensemble (NVT) by saving atomic coordinates every picosecond.
n=2-18
1
2
3
4
5
6
n=1
n=19
2.2. Quantum chemical calculations.
Quantum chemistry calculations were performed using the Gaussian 09 suite of programs (Frisch et al., 2009). Where necessary, geometry optimization was performed at the DFT level using the B3LYP hybrid functional (Becke, 1993; Lee, Yang, & Parr, 1988) associated to the Pople double-zeta basis set augmented by a polarisation function on all atoms, namely 6-31G(d,p) (Krishnan, Binkley, Seeger, & Pople, 1980; McLean & Chandler, 1980).
13C isotropic chemical shieldings were computed using the GIAO approach (Ditchfield, 1972;
Wolinski, Hinton, & Pulay, 1990) at the B3LYP DFT level using the 6-31G(d,p) basis set. These were converted to chemical shifts using a value of 191.89 ppm for the chemical shielding of TMS (Jolibois, Soubias, Réat, & Milon, 2004). Structures obtained by full geometry optimisation at the DFT level or extracted from MD simulations were used for NMR computation. In the latter case, 50 structures were extracted every 200 fs from the last 10 to 20 ns of each trajectory depending on the size of the amylose under study.
The left-handed helix of V-amylose has been intensively characterised (Eliasson & Krog, 1985; Godet et al., 1993; Sarko & Winter, 1974). While a right-handed form may be considered from structural considerations, it has rarely been observed experimentally, to the best of our knowledge (Bulpin, Welsh, Morris, & England, 1982). The comparison of the relative energies
of left and right handed V6-type helix and V7-type left handed helix (with 6 or 7 glucoses per
turn, respectively) was performed at the DFT level for helices containing 19 units. These calculations confirmed that left-handed forms are the most stable (see Supplementary information) and only these were considered further.
2.3. Simulation of NMR spectra.
In order to simulate 13C NMR spectra, a summation procedure was developed.
For the complete quantum chemistry calculations (geometry optimisation and NMR calculation), the calculated chemical shift for each carbon was replaced by a Gaussian function
centered on the chemical shift value 𝛿𝑖. The whole spectrum was then obtained by summing these Gaussian functions:
𝐼𝑄𝑀(𝛿𝑠𝑝𝑒𝑐) = ∑ 𝑒−(𝛿𝑠𝑝𝑒𝑐−𝛿𝑖)
2 Δ
𝑁
𝑖 Eq.1
where N is the number of carbons and Δ was set to 2.25 ppm in order to obtain the required full width at half height at 2.5 ppm, estimated from experimental data (Gidley & Bociek, 1988).
Where conformations were extracted from MD simulations, we first calculated the average
value of the chemical shift of each carbon along the trajectory 〈𝛿𝑖〉. This value was used instead
of 𝛿𝑖 in the previous equation in order to calculate the entire spectrum.
3. Results and discussion.
3.1 Force field adaptation and validation in stability and complexation analyses. 3.1.1. Stability analysis.
Original Force Fields Modified Force Fields
Atoms GROMOS GLYCAM
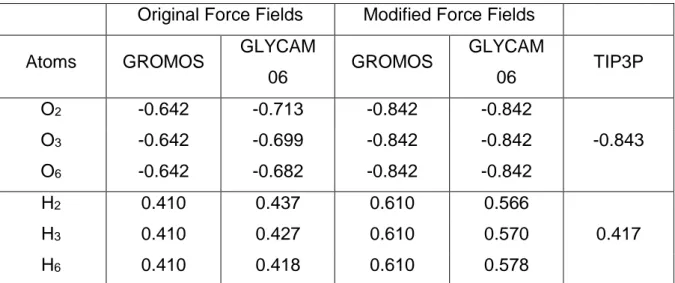
06 GROMOS GLYCAM 06 TIP3P O2 -0.642 -0.713 -0.842 -0.842 O3 -0.642 -0.699 -0.842 -0.842 -0.843 O6 -0.642 -0.682 -0.842 -0.842 H2 0.410 0.437 0.610 0.566 H3 0.410 0.427 0.610 0.570 0.417 H6 0.410 0.418 0.610 0.578
Table 1: Comparison of original GROMOS and GLYCAM partial charges of selected hydroxyl group atoms with modified GROMOS, GLYCAM and with TIP3P partial charges (See figure 1 for atom numbering).
In order to validate force field parameters for MD calculations, an initial simulation was
performed to analyse the stability of the left-handed V6 helix form of a 19-residue amylose
chain folded around a palmitic acid molecule. Starting from a folded configuration, the helical conformation is destabilised in less than 60 ns with the default parameters and charges in
GLYCAM06 and LIPID14. These parameters seemed unsuitable for reproducing both the experimental data (Godet et al., 1993) and the results of previous calculations (López et al., 2012). It has been demonstrated that, for the GROMOS force field, the dipolar moments of the
HO2, HO3 and HO6 bonds are underestimated (López et al., 2012). A modification of the
partial charges for the atoms of these hydroxyl groups has been proposed in order to maintain
the strength of the hydrogen bond network between (HO)6 of residue [n] and (HO)2 and (HO)3
of residue [n+6]. The authors increased the charge difference between H and O from 1.05 e to 1.45 e by modifying the initial partial charges of these atoms, leading to a slightly higher charge difference than in the TIP3P water model (1.25 e (Jorgensen et al., 1983)). As the GLYCAM hydroxyl groups charge difference is similar to that in GROMOS (1.15 e and 1.05 e, respectively - see Table 1), we applied the same strategy and increased the partial charges on
O2, O3 and O6 to -0.842. The partial charges of H2, H3 and H6 were adjusted to maintain the
electro-neutrality of the molecule (see Table 1). The resulting system appears better “balanced” insofar as the competition for hydrogen bond formation either between glucose units or with the surrounding water molecules.
For a simulation carried out with these new partial charges, we first analysed the distribution
of rotameric pairs around the glycosidic bond, using dihedral angles φ (O5-C1-O4’-C4’) and ψ
(C1-O4’-C4’-C3’). It has been shown experimentally that, in the case of a V-type helix, these
angles have values of 103.6° ± 12° and 115° ± 16°, respectively (Gessler et al., 1999). For each set of atomic coordinates recorded along the trajectory, the 18 pairs of angles for the 19-residue chain were analysed (Figure 2a).
a) b) Figure 2. Ramachandran-like plot of φ and ψ dihedral angles (in degrees) of a 19-residue amylose-palmitic acid complex. a) Analysis of the stability of V-helix type conformation. b) Analysis of the complexation process.
We show that these angles are mainly located in a region around φ = 115°, ψ = 105° in good agreement with previously reported data for this helical conformation (Cheng et al., 2018; Gessler et al., 1999; Tusch et al., 2011). The region of the Ramachandran diagram explored by amylose during the molecular dynamics simulations is extended and reflects the dynamic nature of the helix.
This is consistent with fluctuations of the V6-pitch (i.e. variation of the distance between the
centres of mass of residues [n] and [n+6] along the chain) along the trajectory (Figure S2). Experimentally, the pitch measured on the crystalline structure of the V-helix form of amylose is 8.05 ± 0.1 Å (Gessler et al., 1999; Murphy, Zaslow, & French, 1975; Rappenecker & Zugenmaier, 1981; Sarko & Zugenmaier, 2009). Depending on the position of the residues
along the amylose chain, simulations show a more or less significant variation in V6-pitch
compared to experiment. This clearly indicates that the V6-helix conformation is not fully
preserved throughout the simulation. In order to obtain further insight into the stability of the
structure, we have calculated the mean values of the V6-pitch (Figure 3) for the entire trajectory
of 100 ns and for the first and last 10 ns. Error bars were obtained by determining the standard
residues along the amylose chain and rely on extended fluctuations. They indicate that the entire
amylose chain is in a V6-helix conformation at the beginning of the simulation (Figures 3b–Red
bars and 4a), but that during the last 10 ns, this V6-helix conformation is broken, such that the
average values of several V6-pitches are far larger than those of the experiment. This indicates
that the nature of the helix evolves during time (as is it shown in figure 4b). Transitions between
V6-helix to another kind of helical conformation are allowed and distance variations reflect the
flexibility of a molecule that is not constrained by a crystal packing.
a) b) c)
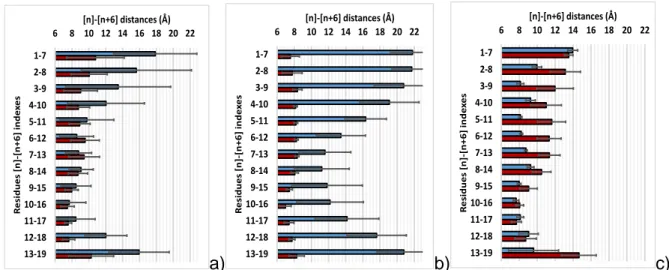
Figure 3: Mean values of the V6-pitches (angstroms) as a function of the position inside the
amylose chain. Full NVT trajectory (a), first 10 ns of NVT trajectory (b) and last 10 ns of NVT trajectory (c). Red bars: stability process and Blue bars: complexation process.
3.1.2. Complexation analysis.
In studies of complexation, the starting conformation consists of an unfolded 19-residue chain of amylose located close to a molecule of palmitic acid. In less than 100 ns, complexation is observed with the folding of the amylose into a V-helix around the fatty acid, as in previous
studies (Cheng et al., 2018; López et al., 2012). An analysis of the distribution of the V6-pitches
as a function of simulation time (Figure S3) shows that while the amylose is unfolded at the beginning of the dynamics trajectory (Figure 3b–Blue bars), the V-helix conformation is unambiguously characterized for the last 10 ns (Figures 3c–Blue bars and 4c).
6 8 10 12 14 16 18 20 22 1-7 2-8 3-9 4-10 5-11 6-12 7-13 8-14 9-15 10-16 11-17 12-18 13-19 [n]-[n+6] distances (Å) R e sid u e s [n ]-[n +6] in d e xe s 6 8 10 12 14 16 18 20 22 1-7 2-8 3-9 4-10 5-11 6-12 7-13 8-14 9-15 10-16 11-17 12-18 13-19 [n]-[n+6] distances (Å) R e sid u e s [n ]-[n +6] in d e xe s 6 8 10 12 14 16 18 20 22 1-7 2-8 3-9 4-10 5-11 6-12 7-13 8-14 9-15 10-16 11-17 12-18 13-19 [n]-[n+6] distances (Å) R e sid u e s [n ]-[n +6] in d e xe s
a) b) c)
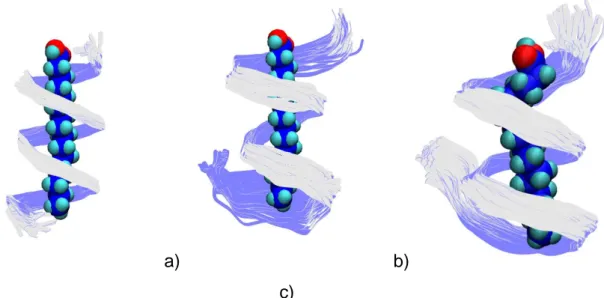
Figure 4: Superposition of 50 structures extracted from molecular dynamic simulations at regular intervals. a) First 10 ns of stability analysis; b) Last 10 ns of stability analysis; c) Last 10 ns of complexation analysis. Residue n=1 is at the bottom of each figure.
In the case of amylose complexed with palmitic acid, it appears that a minimum size of amylose is necessary to envelop the hydrophobic part of the fatty acid. It can be seen that residues at the ends of the helix are more flexible and unfold in solution. This suggests that the new dipolar momentum on the HO bonds, introduced to stabilize the helix around palmitic acid is not strong enough to trap the glucose units in a V-helix conformation, in absence of a lipidic neighbourhood.
3.2 Size effect and stabilisation of V-helix conformation.
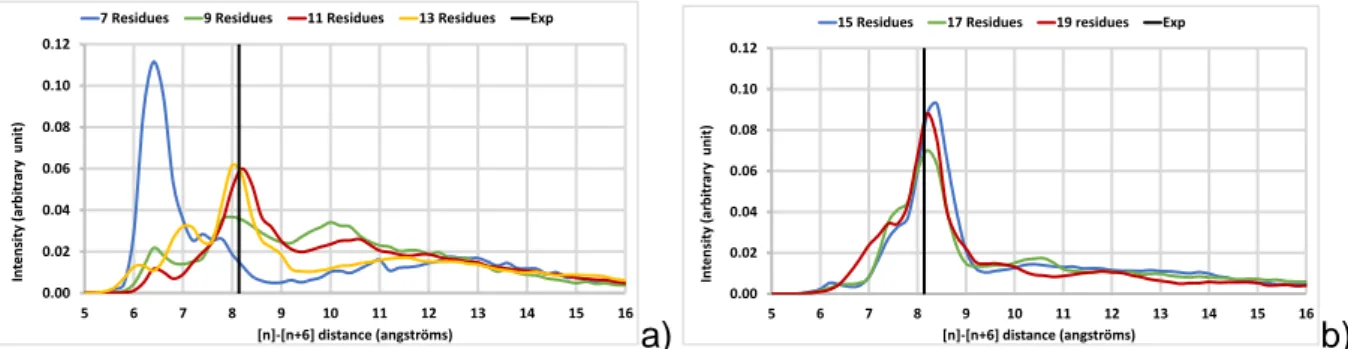
In order to identify the minimum size of amylose necessary to maintain the stability of the V-helix around the palmitic acid, the behaviour of chains of different lengths in the presence of fatty acid and in solution was investigated. The starting point of each simulation was an unfolded amylose chain (with 7, 9, 11, 13, 15, 17 residues) placed near the palmitic acid. For
all molecular complexes, V6-pitches distributions were plotted over the entire simulation
(Figure 5). For small amyloses, there is no clear evidence of the formation of a V-helix along
compared to experiment (~6.4 Å vs 8.05 ± 0.1 Å). As the number of residues increases, this peak at 6.4 Å disappears and a maximum appears around 8.0 Å with increasing intensities as the amylose length increases. These distributions indicate that, above a minimum value of 11 residues, the amylose tends to structure locally in a helical conformation (Figures 5a and b)
with the characteristic pitch of a V6-helix.
a) b)
Figure 5: V6-pitch distribution calculated for the whole NVT trajectory as a function of amylose
length. (a) 7 to 13 residues; (b) 15 to 19 residues.
The difference in behaviour as a function of the length of amylose can be interpreted as a subtle balance between the need to achieve two distinct objectives: to envelop most of the hydrophobic portion of the lipid and to form an intramolecular hydrogen bond network that stabilizes the V-helix form. If the chain is small, these two objectives cannot be achieved simultaneously. For a larger number of glucose units (15 or more residues), the hydrophobic interactions and the formation of a hydrogen bonds network are both satisfied, making it possible to conserve the helix in a more sustainable manner.
3.3 Computation of 13C NMR spectra from simulated amylose structures.
Since the structure of amylose often relies on 13C solid-state NMR, computation of these
spectra was carried out for amylose-palmitic acid complexes as a function of amylose length.
0.00 0.02 0.04 0.06 0.08 0.10 0.12 5 6 7 8 9 10 11 12 13 14 15 16 In te n sity (arbitr ar y u n it) [n]-[n+6] distance (angströms)
7 Residues 9 Residues 11 Residues 13 Residues Exp
0.00 0.02 0.04 0.06 0.08 0.10 0.12 5 6 7 8 9 10 11 12 13 14 15 16 In te n sity (arbitr ar y u n it) [n]-[n+6] distance (angströms) 15 Residues 17 Residues 19 residues Exp
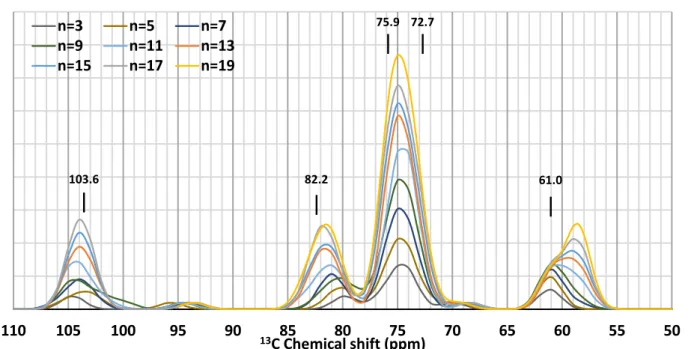
Figure 6: 13C theoretical NMR spectra of amylose in amylose-palmitic acid molecular complex
as a function of amylose size (n number of glucose units). Reported values are experimental chemical shifts (Gidley & Bociek, 1988).
A full quantum chemistry approach was employed to validate the computational strategy and to highlight the structural parameters (conformation, H-bonding …) that can help for the analysis of spectra. A set of molecular systems with amylose length varying from 3 to 19 glucose residues were investigated. From the 19-residue amylose folded around a palmitic acid molecule constructed for simulations, shorter amyloses were obtained by removing residues in pairs (1 residue from each side). Geometry optimizations followed by chemical shielding
calculations were performed and 13C NMR spectra were simulated according to the summation
procedure. The theoretical 13C spectra of amylose in the complex are plotted as a function of
length (Figure 6). The increase in length results in a variation of the calculated chemical shifts
from 104.6 to 103.8 ppm for anomeric-C1 and from 80.0 to 81.7 ppm for C4 carbons, converging
towards the values obtained experimentally for amylose/lipid complex (103.6 ppm and 82.2
ppm, respectively) (Gidley & Bociek, 1988). It should be noted that the C1 and C4 chemical
shifts of the terminal residues are computed to lie between 94.5 and 93.6 ppm and 68.4 and 69.6
50 55 60 65 70 75 80 85 90 95 100 105 110 13C Chemical shift (ppm) n=3 n=5 n=7 n=9 n=11 n=13 n=15 n=17 n=19 103.6 82.2 75.9 72.7 61.0
ppm, respectively. The C6 carbon exhibits particular behaviour depending on whether or not its
hydroxyl group, (HO)6, is involved in an intramolecular hydrogen bond. In our calculations,
there is no solvent effect in order to model water. It has been shown that explicit water molecules would be necessary to reproduce such effects (Cuny, Jolibois, & Gerber, 2018) but this would increase computational costs significantly and induce convergence difficulties. As a
result, several C6 carbons belonging to residues at the reducing end of the amylose helix do not
experience hydrogen bonding. Their chemical shift is greater (~61.0 ppm) than that of C6
carbons for which (HO)6 is engaged in the intramolecular hydrogen bonding network (~59.0
ppm) (Figure 6). In the region of C2, C3 and C5 chemical shifts where two characteristic peaks
are present in experimental spectra (Gidley & Bociek, 1988), we observe a single broad peak centred at ~75 ppm. Reducing in Eq.1 reveals two peaks but with intensities inverted with
respect to experiment: for the complex with 19-residue amylose, the chemical shifts of C2 and
C3 are close to 75.4 ppm and only that associated with C5 is about 73.8 ppm. A common method
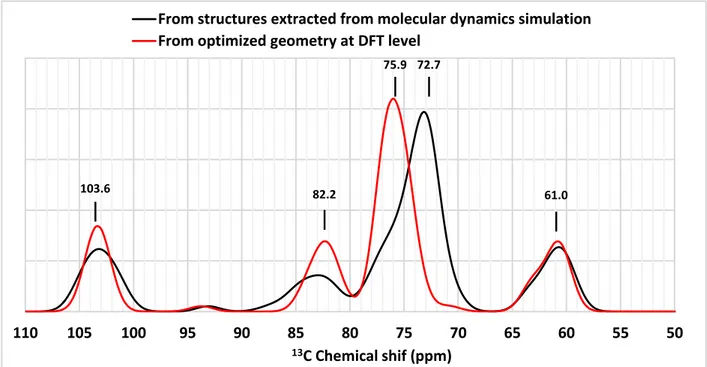
for correcting theoretical values with respect to experimental data is to use a linear fit to account for corrections arising from the slope and origin (essentially environmental effects that are not taken into account in the computational model) (Jolibois et al., 2004). For the complex with 19-residue amylose, such a fit performed using the chemical shifts of the unambiguously assigned
carbons (C1, C4 and C6) gave the following equation: δcorrected=0.9424*δtheo+5.4892 with a
R2=0.9999. Correction of the entire spectrum resulted in an increase in the chemical shifts of
C2, C3 and C5 carbons away from experimental values (Figure 7). Even with this correction, the
entire 13C NMR spectrum is not correctly reproduced suggesting that the computational strategy
needs to be improved. While the method for computing NMR parameters is suitable for this type of system, our initial strategy fails to take into account the flexibility of the amylose chain. This can be introduced into our theoretical analysis via MD simulations. Carbon chemical shifts were calculated for each of 50 structures extracted from the last 10 ns of simulations performed
for the analysis of the complexation process and an averaged 13C NMR spectrum was simulated.
The resulting carbon chemical shifts are all overestimated compare to the experiment.
Anomeric C1 carbons resonate around 110.0 ppm; the chemical shift ranges for carbons C2, C3
and C5 and for C4 and C6 carbons are located around 80.0, 88.0 and 66.0 ppm, respectively.
These discrepancies can be attributed to: 1) the force field parameters that produce structures different from the optimized structure; 2) the environmental effects; 3) unsuitability of the calculated reference (TMS) chemical shielding for chemical shift calculations using MD structures (Cuny et al., 2018; Gerber & Jolibois, 2015). As above, this spectrum may be
corrected using a linear fit (δcorrected=0.8963*δtheo+2.7044 with a R2=0.9993), leading to an
overall improvement, in particular in the upfield shift of the region corresponding to C2, C3 and
C5 atoms, toward that observed experimentally (i.e. between 70 and 79 ppm with a maximum
at 73 ppm). This suggests that the description of the hydrogen bond network involving the C2,
C3 and C6 carbons of residues [n] and [n+6] is better reproduced using a dynamical model than
a single optimised conformation.
Figure 7: Corrected theoretical 13C NMR spectra of amylose-palmitic acid complexes with a 19
sugars amylose. Red line: calculated using optimized geometry at the DFT level; Black line:
50 55 60 65 70 75 80 85 90 95 100 105 110 13C Chemical shif (ppm)
From structures extracted from molecular dynamics simulation From optimized geometry at DFT level
103.6 82.2
75.9 72.7
calculated using 50 structures extracted from the last 10 ns of complexation analysis trajectory. Reported values are experimental chemical shifts (Gidley & Bociek, 1988).
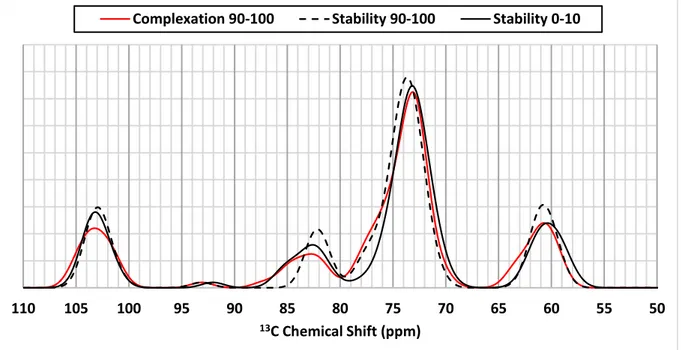
Since we observed a different conformational behaviour during studies of the stability and the complexation process of amylose, the NMR spectra of 19-residue amylose in complex was simulated, using 50 structures extracted from the first and the last 10 ns of stability analysis molecular simulation. The resulting spectra do not show significant differences to that associated with the complexation process (Figure S4). The shoulder that appears around 76-77 ppm (Figure 7 and Figure S4) might be attributed to the resonance observed at 75.4 ppm in experimental spectra.
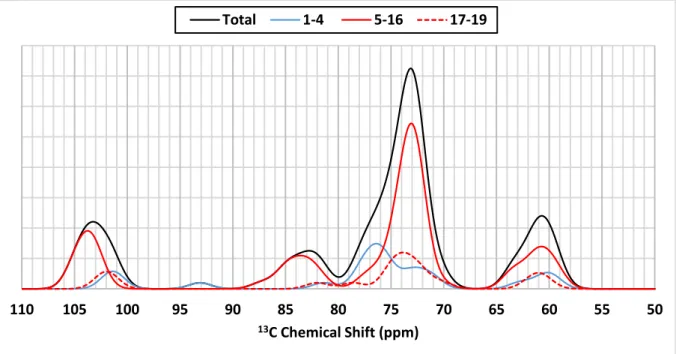
Spectral decomposition was undertaken by dividing the amylose into helical and non-helical portions using the conformational analysis performed previously (Figures 8, S5 and S6). If we consider the helical parts of amylose (residues 5 to 16, 3 to 10 and 6 to 16 for the last 10 ns of complexation, the first 10 ns of stability and the last 10 ns of stability analysis MD simulation,
respectively), there is no major contribution of C2, C3 or C5 carbons to the spectrum above 75
ppm (peak maximum centred at 73 ppm). The theoretical resonance close to 76 ppm is however associated with carbon atoms 2 to 4 of the first four residues (Figure 8, blue line) for which a non-helical conformational has been highlighted in the case of the last 10 ns of complexation trajectory (Figure 6c). The experimental resonance at 75.4 ppm seems therefore not to be a
specific feature related to V-helix conformation associated to C3 carbon. The experimental
assignments of the C2, C3 and C5 chemical shifts of amylose-lipid complexes have always been
performed by analogy with cyclodextrin crystals and/or amylose solubilized in (CD3)2SO at
high temperature (Gidley & Bociek, 1988). Some models have been postulated showing unstructured parts of the amylose in amorphous lamellas (Gelders, Goesaert, & Delcour, 2005). Because these unstructured parts induce the modification of the hydrogen bonds network present in the V-helix, the 76 ppm resonance may be the fingerprint of another type of
interactions coming either from conformational modifications or from the presence of intermolecular interactions between V-type helices within a crystal lattice.
Figure 8: Decomposition of theoretical 13C NMR spectra of amylose-palmitic acid complexes
with 19-residue amylose obtained from 50 structures extracted from the last 10 ns of complexation analysis MD simulation. Black line: Spectrum calculated using the full set of 19 residues; contributions to the spectrum for residues 1 to 4, 5 to 16 and 17 to 19 are given using plain blue line, plain red line and dotted red line, respectively.
4. Conclusion.
We report intensive calculations using MD simulations to analyse the conformation of small amylose molecules complexed with palmitic acid. We show that a minimum of 11 residues is sufficient to observe the transitional appearance of a V-helix structure, but that 15 residues are necessary for the amylose to fold around the palmitic acid in a well-established helical conformation. A DFT method has been employed to simulate NMR spectra of various amylose-palmitic acid complexes. We demonstrate that some carbon chemical shifts are affected by the amylose length, depending on the presence of intramolecular hydrogen bonds. Decomposition
50 55 60 65 70 75 80 85 90 95 100 105 110 13C Chemical Shift (ppm) Total 1-4 5-16 17-19
of NMR spectra of 19-residue amylose calculated using a series of structures extracted from molecular dynamics has allowed the precise assignment of each of the characteristic resonances. We propose that the double peak that appears, experimentally, in the region between 73 and 76 ppm is not a characteristic of V-helix conformation. On the contrary, we postulate that these peaks correspond to the presence of different local conformations or of specific intermolecular interactions between V-type helices within a crystal lattice.
Acknowledgements
A.S. was a recipient of a PhD scholarship from University of Toulouse and the “Région Occitanie”.
This work was supported by the CNRS-MITI grant “Modélisation du vivant” 2019. This work
was granted access to the HPC resources of CALMIP supercomputing center under the allocation
2018-p0758 and of CINES and IDRIS supercomputing center under the allocation 2019-A0060810816
made by GENCI. The authors acknowledge Anne Lemassu at IPBS-Toulouse for fruitful
discussions and Andrew Atkinson at King’s College London for the meticulous corrections of the manuscript.
References.
Becke, A. D. (1993). Density-functional thermochemistry. III. The role of exact exchange. The
Journal of Chemical Physics, 98(7), 5648–5652.
Brisson, J., Chanzy, H., & Winter, W. T. (1991). The crystal and molecular structure of VH amylose by electron diffraction analysis. International Journal of Biological
Macromolecules, 13(1), 31–39.
Bulpin, B. P. V, Welsh, E. J., Morris, E. R., & England, B. (1982). Physical characterization of amylose-fatty acid complexes in starch granules and in solution. Starch‐Stärke, 10, 335– 339.
Burghammer, M., Chanzy, H., Potocki-Véronèse, G., Putaux, J.-L., Montesanti, N., Popov, D., … Buléon, A. (2009). Crystal structure of A-amylose: A revisit from synchrotron microdiffraction analysis of single crystals. Macromolecules, 42(4), 1167–1174.
Carbinatto, F. M., Ribeiro, T. S., Colnago, L. A., Evangelista, R. C., & Cury, B. S. F. (2016). Preparation and characterization of amylose inclusion complexes for drug delivery applications. Journal of Pharmaceutical Sciences, 105(1), 231–241.
Case, D. A., Ben-Shalom, I. Y., Brozell, S. R., Cerutti, D. S., Cheatham, III, T. E., Cruzeiro, V. W. D., … Kollman, P. A. (2018). AMBER 2018. San Francisco: University of California,.
Cheng, L., Feng, T., Zhang, B., Zhu, X., Hamaker, B., Zhang, H., & Campanella, O. (2018). A molecular dynamics simulation study on the conformational stability of amylose-linoleic acid complex in water. Carbohydrate Polymers, 196, 56–65.
Cheng, L., Zhu, X., Hamaker, B. R., Zhang, H., & Campanella, O. H. (2019). Complexation process of amylose under different concentrations of linoleic acid using molecular dynamics simulation. Carbohydrate Polymers, 216, 157–166.
Cuny, J., Jolibois, F., & Gerber, I. C. (2018). Evaluation of gas-to-liquid 17 O chemical shift of water: A test case for molecular and periodic approaches. Journal of Chemical Theory and
Computation, 14(8), 4041–4051.
Darden, T., York, D., Pedersen, L., Darden, T., York, D., & Pedersen, L. (1993). Particle mesh Ewald : An Nlog ( N ) method for Ewald sums in large systems Particle mesh Ewald : An N -log ( N ) method for Ewald sums in large systems. J. Chem. Phys., 10089.
Dickson, C. J., Madej, B. D., Skjevik, Å. A., Betz, R. M., Teigen, K., Gould, I. R., & Walker, R. C. (2014). Lipid14: The amber lipid force field. Journal of Chemical Theory and Computation,
10(2), 865–879.
Ditchfield, R. (1972). Molecular orbital theory of magnetic shielding and magnetic susceptibility. The Journal of Chemical Physics, 56(11), 5688–5691.
Eliasson, A. C., & Krog, N. (1985). Physical properties of amylose-monoglyceride complexes.
Journal of Cereal Science, 3(3), 239–248.
Feng, T., Li, M., Zhou, J., Zhuang, H., Chen, F., Ye, R., … Fang, Z. (2015). Application of molecular dynamics simulation in food carbohydrate research - A review. Innovative Food Science
and Emerging Technologies, 31, 1–13.
Feng, T., Wang, K., Zhuang, H., Bhopatkar, D., Carignano, M. A., Park, S. H., & Bing, F. (2017). Molecular dynamics simulation of amylose-linoleic acid complex behavior in water.
Journal of Nanoscience and Nanotechnology, 17(7), 4724–4732.
Frisch, M. J., Trucks, G. W., Schlegel, H. B., Scuseria, G. E., Robb, M. A., Cheeseman, J. R., … Fox, D. J. (2009). Gaussian 09, Revision A.02. Wallingford CT: Gaussian, Inc.
Gelders, G. G., Goesaert, H., & Delcour, J. A. (2005). Potato phosphorylase catalyzed synthesis of amylose-lipid complexes. Biomacromolecules, 6(5), 2622–2629.
Gerber, I. C., & Jolibois, F. (2015). Theoretical gas to liquid shift of 15 N isotropic nuclear magnetic shielding in nitromethane using ab initio molecular dynamics and GIAO/GIPAW calculations. Physical Chemistry Chemical Physics, 17(18), 12222–12227.
Gessler, K., Uson, I., Takaha, T., Krauss, N., Smith, S. M., Okada, S., … Saenger, W. (1999). V-Amylose at atomic resolution: X-ray structure of a cycloamylose with 26 glucose residues (cyclomaltohexaicosaose). Proceedings of the National Academy of Sciences, 96(8), 4246–4251.
Gidley, M. J., & Bociek, S. M. (1988). 13C CP/MAS NMR studies of amylose inclusion complexes, cyclodextrins, and the amorphous phase of starch granules: Relationships between glycosidic linkage conformation and solid-state 13C chemical shifts. Journal of
the American Chemical Society, 110(13), 3820–3829.
Godet, M. C., Buléon, A., Tran, V., & Colonna, P. (1993). Structural features of fatty acid-amylose complexes. Carbohydrate Polymers, 21(2–3), 91–95.
Hanwell, M. D., Curtis, D. E., Lonie, D. C., Vandermeerschd, T., Zurek, E., & Hutchison, G. R. (2012). Avogadro: An advanced semantic chemical editor, visualization, and analysis platform. Journal of Cheminformatics, 4(8), 1–17.
Horii, F., Yamamoto, H., Hirai, A., & Kitamaru, R. (1987). Structural study of Amylose polymorphs by cross-polatization-magic-angle spinning 12C-NMR spectroscopy.
Carbohydrate Research, 160, 29–40.
Jolibois, F., Soubias, O., Réat, V., & Milon, A. (2004). Understanding sterol-membrane interactions part I: Hartree-Fock versus DFT calculations of 13C and 1H NMR isotropic chemical shifts of sterols in solution and analysis of hydrogen-bonding effects. Chemistry
- A European Journal, 10(23), 5996–6004.
Jorgensen, W. L., Chandrasekhar, J., Madura, J. D., Impey, R. W., & Klein, M. L. (1983). Comparison of simple potential functions for simulating liquid water. The Journal of
Chemical Physics, 79(2), 926–935.
Kirschner, K. N., Yongye, A. B., Tschampel, S. M., González-Outeiriño, J., Daniels, C. R., Foley, B. L., & Woods, R. J. (2008). GLYCAM06: A generalizable biomolecular force field. carbohydrates. Journal of Computational Chemistry, 29(4), 622–655.
Krishnan, R., Binkley, J. S., Seeger, R., & Pople, J. A. (1980). Self-consistent molecular orbital methods. XX. A basis set for correlated wave functions. The Journal of Chemical Physics,
72(1), 650–654.
Le Bail, P., Rondeau, C., & Buléon, A. (2005). Structural investigation of amylose complexes with small ligands: Helical conformation, crystalline structure and thermostability.
International Journal of Biological Macromolecules, 35(1–2), 1–7.
Lee, C., Yang, W., & Parr, R. G. (1988). Development of the Colle-Salvetti correlation-energy formula into a functional of the electron density. Physical Review B, 37(2), 785–789. López, C. A., De Vries, A. H., & Marrink, S. J. (2012). Amylose folding under the influence of
lipids. Carbohydrate Research, 364, 1–7.
McLean, A. D., & Chandler, G. S. (1980). Contracted gaussian basis sets for molecular calculations. I. Second row atoms, Z=11-18. The Journal of Chemical Physics, 72(10), 5639–5648.
Murphy, V. G., Zaslow, B., & French, A. D. (1975). The Structure of V amylose dehydrate : A combined X-Ray and stereochemical approach. Biopolymers, 14, 1487–1501.
Nuessli, J., Putaux, J. L., Le Bail, P., & Buléon, A. (2003). Crystal structure of amylose complexes with small ligands. International Journal of Biological Macromolecules, 33(4–5), 227–234. Phillips, J. C., Braun, R., Wang, W., Gumbart, J., Tajkhorshid, E., Villa, E., … Schulten, K. (2005). Scalable molecular dynamics with NAMD. Journal of Computational Chemistry, 26(16), 1781–1802.
Rappenecker, G., & Zugenmaier, P. (1981). Detailed refinement of the crystal structure of Vh-Amylose. Carbohydrate Polymers, 89, 11–19.
Sarko, A., & Winter, W. T. (1974). Crystal and molecular structure of the amylose-DMSO complex. Biopolymers, 13(7), 1461–1482.
Sarko, A., & Zugenmaier, P. (2009). Crystal structures of amylose and its derivatives. A review. In A. D. French & K. H. Gardner (Eds.), Fiber Diffraction Methods - ACS Symposium series (pp. 459–482).
Takahashi, Y., Kumano, T., & Nishikawa, S. (2004). Crystal structure of B-amylose.
Macromolecules, 37(18), 6827–6832.
Takeda, Y., Shitaozono, T., & Hizukuri, S. (1990). Structures of sub-fractions of corn amylose.
Carbohydrate Resaerch, 199, 207–214.
Toukach, F. V., & Ananikov, V. P. (2013). Recent advances in computational predictions of NMR parameters for the structure elucidation of carbohydrates: Methods and limitations.
Chemical Society Reviews, 42(21), 8376–8415.
Tusch, M., Krüger, J., & Fels, G. (2011). Structural stability of V-amylose helices in water-DMSO mixtures analyzed by molecular dynamics. Journal of Chemical Theory and Computation,
7(9), 2919–2928.
Veregin, R. P., Fyfe, C. A., & Marchessault, R. H. (1987). Investigation of the crystalline “V” amylose complexes by high-resolution 13C CP/MAS NMR spectroscopy. Macromolecules,
20(12), 3007–3012. https://doi.org/10.1021/ma00178a010
Whittam, M. A., Orford, P. D., Ring, S. G., Clark, S. A., Parker, M. L., Cairns, P., & Miles, M. J. (1989). Aqueous dissolution of crystalline and amorphous amylose-alcohol complexes.
International Journal of Biological Macromolecules, 11(6), 339–344.
gauge-independent atomic orbital method for NMR chemical shift calculations. Journal of the
American Chemical Society, 112(23), 8251–8260.
Zabar, S., Lesmes, U., Katz, I., Shimoni, E., & Bianco-Peled, H. (2009). Studying different dimensions of amylose-long chain fatty acid complexes: Molecular, nano and micro level characteristics. Food Hydrocolloids, 23(7), 1918–1925.
Supplementary Materials
Influence of amylose size on the structure and NMR
spectrum of amylose-palmitic acid complexes. Insight from
Classical Molecular Dynamics simulations and DFT
quantum chemical computations.
Adrien Schahl1,2, Valérie Réat2, Franck Jolibois1*
1) LPCNO, Université Fédérale de Toulouse Midi-Pyrénées, INSA-CNRS-UPS, 135 avenue de Rangueil, 31077 Cedex 4 Toulouse, France
2) Institut de Pharmacologie et de Biologie Structurale, UMR 5089, CNRS - Université de Toulouse, UPS BP 64182, 205 route de Narbonne, 31077 Toulouse, Cedex04, France
Stability of the helical forms: The left-handed helix is the form of V-amylose that has been intensively characterised (Eliasson & Krog, 1985; Godet et al., 1993; Sarko & Winter, 1974). While a right-handed form can be envisaged regarding structural considerations only, it has rarely experimentally been observed, to the best of our knowledge (Bulpin, Welsh, Morris, &
England, 1982). Moreover, the so-called V6 helix (with 6 glucoses per turn) seems to be more
experimentally detected than other kind of helices with more glucoses per turn. In order to explain these experimental features of V-type amylose, their relative stabilities have been computed at the quantum chemical level (see computational details) in the case of helices that
contains 19 units of glucose. Results showed that the V6 left-handed form is more stable than
the V6 right handed form by 60 kcal.mol-1. This energy difference can be attributed to the
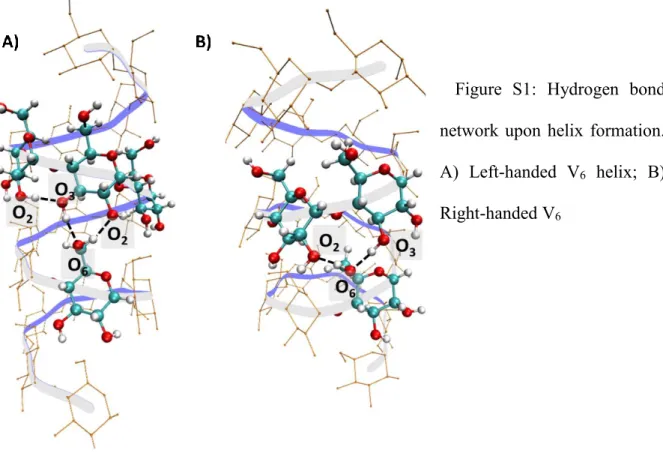
difference in hydrogen bond network created upon the helix formation (Figure S1). In the V6
left-handed helix, hydrogen bonds are observed between the (HO)6 hydroxyl group (see Figure
1 for atom numbering) at position [n] with the (HO)2 (H-bond acceptor) and (HO)3 (H-bond
donor) hydroxyl groups at position [n+6] ((HO)2, (HO)3 and (HO)6 correspond to the hydroxyl
groups of the carbons 2, 3 and 6, respectively). In the same time, a hydrogen bond exits between
(HO)3 helix hydroxyl group (H-bond acceptor) at position [n] and (HO)2 hydroxyl group
(H-bond donor) at position [n+1] (Gessler et al., 1999) . These features are in perfect agreement with the experimental crystal structure obtained by X-Ray diffraction (Gessler et al., 1999). In
the case of right-handed helix, hydrogen bonds are observed between the (HO)6 hydroxyl group
at position [n] with the (HO)2 (H-bond acceptor) and HO3 (H-bond donor) hydroxyl group at
position [n+5] and [n+6] respectively. Thus, the third hydrogen bond that is observed in the left-handed structure cannot be formed between successive residues.
Figure S1: Hydrogen bond network upon helix formation.
A) Left-handed V6 helix; B)
Right-handed V6
Comparison with the left-handed V7 helixform exhibits an energy difference of 40 kcal.mol
-1. An attempt to take into account solvent effects has been envisaged by using SMD continuum
solvation model (Marenich, Cramer, & Truhlar, 2009) for geometry optimisations. In this case,
the V6 form remains more stable than the V7 one, with a relative energy difference reduced to
26 kcal.mol-1. These theoretical results corroborate the experimental observations.
References :
Bulpin, B. P. V, Welsh, E. J., Morris, E. R., & England, B. (1982). Physical Characterization of Amylose-Fatty Acid Complexes in Starch Granules and in Solution. Starch‐Stärke, 10, 335– 339.
Eliasson, A. C., & Krog, N. (1985). Physical properties of amylose-monoglyceride
complexes. Journal of Cereal Science, 3(3), 239–248.
Gessler, K., Uson, I., Takaha, T., Krauss, N., Smith, S. M., Okada, S., … Saenger, W. (1999). V-Amylose at atomic resolution: X-ray structure of a cycloamylose with 26 glucose residues (cyclomaltohexaicosaose). Proceedings of the National Academy of Sciences, 96(8), 4246–
4251. https://doi.org/10.1073/pnas.96.8.4246
Godet, M. C., Buléon, A., Tran, V., & Colonna, P. (1993). Structural features of fatty
acid-amylose complexes. Carbohydrate Polymers, 21(2–3), 91–95. https://doi.org/10
Marenich, A. V, Cramer, C. J., & Truhlar, D. G. (2009). Universal Solvation Model Based on Solute Electron Density and on a Continuum Model of the Solvent Defined by the Bulk Dielectric Constant and Atomic Surface Tensions. J. Phys. Chem. B, 113(18), 6378–6396.
https://doi.org/10.1021/jp810292n
Sarko, A., & Winter, W. T. (1974). Crystal and Molecular Structure of the Amylose-DMSO Complex. Biopolymers, 13(7), 1461–1482.1016/0144-8617(93)90003-M
Figure S2: [n]-[n+6] distance variations along the amylose chain in the case of the analysis of the stability of a preformed V6 type helix of 19 residues complexed with a palmitic acid molecule. The variations are plotted clockwise
as a function of time for the whole NVT molecular dynamics simulation and for each residue along the amylose chain (from n=1 to n=13). Yellow circle corresponds to the experimental value in case of V-helix conformation (see main text for details)
Figure S3: [n]-[n+6] distance variations along the amylose chain in the case of the analysis of the complexation process between a 19 residues amylose and a palmitic acid molecule. The variations are plotted clockwise as a function of time for the whole NVT molecular dynamics simulation and for each residue along the amylose chain (from n=1 to n=13). Yellow circle corresponds to the experimental value in case of V-helix conformation (see main text for details)
Figure S4: Corrected theoretical 13C NMR spectra of amylose-palmitic acid complexes with a 19 sugars
amylose from 50 snapshots extracted from the last 10 ns of complexation analysis molecular dynamics simulation (Red Line), the first (Black Plain Line) and the last (Black Dotted line) 10 ns of stability analysis molecular dynamics simulation.
Figure S5: Deconvolution of theoretical 13C NMR spectra of amylose-palmitic acid complexes with a 19
sugars amylose obtained from 50 snapshots extracted from the first 10 ns of stability analysis molecular dynamics simulation. Black line: Spectrum calculated using the whole 19 residues; Contributions to the spectrum for residues 1 to 2, 3 to 10 and 11 to 19 are given using plain blue line, plain red line and dotted red line, respectively.
50 55 60 65 70 75 80 85 90 95 100 105 110 13C Chemical Shift (ppm)
50 55 60 65 70 75 80 85 90 95 100 105 110 13C Chemical Shift (ppm) TOTAL 1-2 3-10 11-19
Figure S6: Deconvolution of theoretical 13C NMR spectra of amylose-palmitic acid complexes with a 19
sugars amylose obtained from 50 snapshots extracted from the last 10 ns of stability analysis molecular dynamics simulation. Black line: Spectrum calculated using the whole 19 residues; Contributions to the spectrum for residues 1 to 5, 6 to 16 and 17 to 19 are given using plain blue line, plain red line and dotted red line, respectively.
50 55 60 65 70 75 80 85 90 95 100 105 110 13C Chemical Shift (ppm) TOTAL 1-5 6-16 17-19