HAL Id: inserm-01196078
https://www.hal.inserm.fr/inserm-01196078
Submitted on 9 Sep 2015HAL is a multi-disciplinary open access archive for the deposit and dissemination of sci-entific research documents, whether they are pub-lished or not. The documents may come from teaching and research institutions in France or abroad, or from public or private research centers.
L’archive ouverte pluridisciplinaire HAL, est destinée au dépôt et à la diffusion de documents scientifiques de niveau recherche, publiés ou non, émanant des établissements d’enseignement et de recherche français ou étrangers, des laboratoires publics ou privés.
Ebola virus dynamics in mice treated with favipiravir
Vincent Madelain, Lisa Oestereich, Frederik Graw, Thi-Huyen Nguyen, Xavier
de Lamballerie, France Mentré, Stephan Günther, Jeremie Guedj
To cite this version:
Vincent Madelain, Lisa Oestereich, Frederik Graw, Thi-Huyen Nguyen, Xavier de Lamballerie, et al.. Ebola virus dynamics in mice treated with favipiravir. Antiviral Research, Elsevier Masson, 2015, pp.10.1016/j.antiviral.2015.08.015. �10.1016/j.antiviral.2015.08.015�. �inserm-01196078�
1
Ebola virus dynamics in mice treated with favipiravir
Vincent Madelaina, Lisa Oestereichb,c, Frederik Grawd, Thi Huyen Tram Nguyena, Xavier de Lamballeriee,f, France Mentréa, Stephan Güntherb,c and Jeremie Guedja*
a
INSERM, IAME, UMR 1137, F-75018 Paris, France; Université Paris Diderot, Sorbonne Paris Cité, Paris, France
b
Bernhard-Nocht-Institute for Tropical Medicine, 20359 Hamburg, Germany
c
German Centre for Infection Research (DZIF), Partner Site Hamburg, Germany
d
Center for Modeling and Simulation in the Biosciences, BioQuant-Center, Heidelberg University, 69120 Heidelberg, Germany
e
Aix Marseille Université, IRD French Institute of Research for Development, EHESP French School of Public Health, EPV UMR_D 190 "Emergence des Pathologies Virales", F-13385 Marseille, France.
f
Institut Hospitalo-Universitaire Méditerranée Infection, F-13385 Marseille, France. *: corresponding author jeremie.guedj@inserm.fr
Abstract
The polymerase inhibitor favipiravir is a candidate for the treatment of Ebola virus disease. Here, we designed a mathematical model to characterize the viral dynamics in 20 mice experimentally infected with Ebola virus, which were either left untreated or treated with favipiravir at 6 or 8 days post infection. This approach provided estimates of kinetic parameters of Ebola virus reproduction, such as the half-life of productively infected cells, of about 6 hours, and the basic reproductive number which indicates that virus produced by a single infected cell productively infects about 9 new cells. Furthermore, the model predicted that favipiravir efficiently blocks viral production, reaching an antiviral effectiveness of 95% and 99.6% at 2 and 6 days after initiation of treatment, respectively. The model could be particularly helpful to guide future studies evaluating favipiravir in larger animals.
1. Introduction
Ebola virus (EBOV) is among the deadliest pathogens currently known, leading to multiple organ failure and death in 40-90% of cases (Feldmann and Geisbert, 2011). Despite substantial and rapid progress (Geisbert, 2015), vaccines remain in early phases of clinical trials and potent antiviral drugs are urgently needed. Last year, two studies published in Antiviral Research showed that favipiravir, a pyrazinecarboxamide derivative approved for complicated influenza in Japan, had a large antiviral effectiveness against EBOV both in vitro and in vivo in infected mice (Oestereich et al., 2014; Smither et al., 2014). Moreover favipiravir can be given orally and has shown a good safety profile in over 2,000 patients
2 worldwide, leading the WHO to consider it as a potential antiviral candidate against EBOV. Indeed favipiravir, along with few other molecules, is currently tested in human clinical trials (Sissoko et al., 2015).
In order to support the development of new drugs, it is crucial to have a better quantitative understanding of EBOV dynamics in vivo. This can be achieved using mathematical models based on ordinary differential equations which characterize the non-linear interactions between the pathogen, the host and the drug. This type of approach has provided many insights in the pathogenesis of several viruses, in particular influenza, HCV and HIV (Baccam et al., 2006; Neumann et al., 1998; Perelson, 2002). Further, by characterizing the effect of treatment on the viral load, these models have allowed to better understand the mechanisms of action and the antiviral effect of drugs in vivo (Perelson and Guedj, 2015).
Here we applied this approach to characterize the viral kinetics in mice treated with favipiravir or left untreated, using data previously published (Oestereich et al., 2014). Further, drug concentration data obtained in uninfected mice from different experiments were used to construct a pharmacokinetic model for favipiravir. By using a model combining both the viral kinetic and the pharmacokinetic data, we could provide an estimation of the infected cell half-life, the basic reproductive number of EBOV and the effectiveness of favipiravir in reducing viral production in vivo.
2. Material and methods
2.1 Data2.1.1 Pharmacokinetic
The pharmacokinetic data were provided by Toyama Chemical (Tokyo, Japan) and came from two separate studies of N=54 Crlj:CD1 female mice in total treated with favipiravir 150 mg/kg twice a day by oral route for 14 days. Nine sampling times were available on day 0 and on day 14. For each sampling time, three mice were sampled and then sacrificed. Plasma concentrations were quantified using high performance liquid chromatography, with a limit of quantitation of 0.1 µg/mL.
2.1.2 Viral kinetic
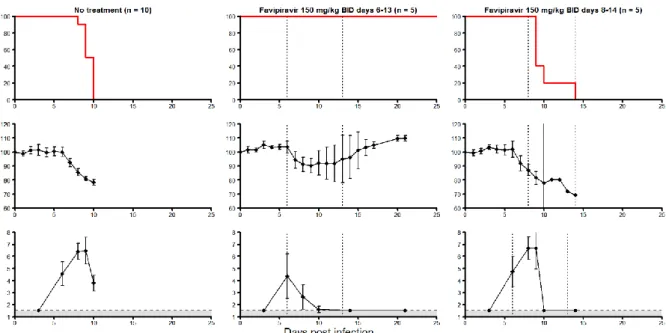
We reanalyzed viral load data from twenty C57BL/6 female mice lacking the type I interferon receptor that were infected with Zaire EBOV Mayinga 1976 strain (Oestereich et al., 2014). In brief, mice were either left untreated (n=10) or were treated with oral favipiravir 150 mg/kg BID for 7 days, starting at 6 (n=5) or 8 (n=5) days post infection (dpi), respectively. All mice treated at 6 dpi survived while all mice left untreated or treated 8 dpi
3 died within 15 dpi (Figure 1). Viral load was quantified in immunofocus assay as focus forming units (FFU) with a limit of quantitation of 1.5 log10 FFU/mL.
2.2 Pharmacokinetic model of favipiravir
Favipiravir plasma concentration over time, C(t), was characterized by a standard one compartment model with first-order absorption and elimination. In that model total plasma concentration, C(t), is given by:
𝐶(𝑡) =𝑉𝐷
𝐷 𝑘𝑎 𝑘𝑎−𝑘𝑒(𝑒
−𝑘𝑒𝑡− 𝑒−𝑘𝑎𝑡) (Eq. 1)
where D is the dose, VD is the apparent volume of distribution, ka is the absorption rate
and ke is the elimination rate. Further a protein-binging rate, fu, of 0.90 (data from the
manufacturer) was used, and therefore, the active free concentration of favipiravir was defined to 𝐶𝑢(𝑡) = 𝐶(𝑡) × 𝑓𝑢 where C(t) is given by (Eq. 1).
2.3 Viral kinetic model for EBOV
The change in viral load was characterized using a standard viral dynamic model during acute infection (Baccam et al., 2006):
𝑑𝑇 𝑑𝑡 = −𝛽𝑉𝑇 (Eq. 2) 𝑑𝐼1 𝑑𝑡 = 𝛽𝑉𝑇 − 𝑘𝐼1 𝑑𝐼2 𝑑𝑡 = 𝑘𝐼1− 𝛿𝐼2 𝑑𝑉 𝑑𝑡 = 𝑝𝐼2 − 𝑐𝑉
where T, I1, I2 and Vdenote uninfected target cells, non-productively infected cells,
productively infected cells and free virions, respectively (Figure 2). These four compartments are parameterized as concentrations related to plasma volume. Free virions infect target cells at rate β, and are cleared at rate c, i.e. ln(2)/c is plasma virion half-life. After infection, cells do not immediately produce virus and rather enter into an eclipse phase of half-life equal to ln(2)/k. Lastly productively infected cells produce p virions per day and are lost with rate δ, i.e. ln(2)/δ is the infected cell half-life. Therefore, the average total infected cell lifetime, tinf,
is given by 1/k + 1/δ.
The model predicts first an exponential growth of the viremia as long as there is a large number of available target cells for infection (up-slope). At the end of this first phase, the
4 target cells are largely depleted, the number of new infections declines and therefore the loss of infected cells can no longer be compensated by new cell infections. Consequently, the number of infected cells, and hence the total viral production, rapidly declines (down-slope). Mathematical analysis shows that this decline is exponential with a rate proportional to the infected cell half-life. One can derive from this model the basic reproductive number, R0,
representing how many new productively infected cells would be generated by one infected cell, and is given by 𝑅0 =𝑝𝛽𝑇𝛿𝑐0. The model was reparametrized as a function of R0, such as
β=1/R0,and we constrained it to be larger than 1 to ensure productive infection. More details
on viral dynamics models can be found in (Canini and Perelson, 2014; Smith and Perelson, 2011).
2.4 Antiviral effect of favipiravir
Favipiravir is metabolized by host enzymes into a nucleotide analog that selectively inhibits the viral RNA dependent RNA polymerase or causes lethal mutagenesis upon incorporation into the virus RNA (Furuta et al., 2005). This mechanism of action can be incorporated in the model by assuming that favipiravir reduces the viral production rate, noted p in Equation 2. If we let ε the antiviral effectiveness of favipiravir in blocking production, i.e., ε=1 corresponds to 100% effect and ε=0 corresponds to no effect, the viral production during treatment can be written as p(1-ε). In order to model the relationship between the drug antiviral effectiveness and the plasma free drug concentration, Cu(t), a direct E-max model
and a model with an effect compartment were tested.
In the direct E-max model the drug effectiveness is directly related to the plasma free concentration Cu(t) (Eq. 3).
𝜀(𝑡) = 𝐸𝑚𝑎𝑥 𝐶𝑢(𝑡) 𝑛 𝐸𝐶50𝑛+ 𝐶𝑢(𝑡)𝑛
(Eq. 3)
where Emax is the maximal effect of favipiravir, EC50 is the concentration inhibiting
50% of viral production and n is the Hill coefficient.
In the effect compartment model, the possibility of a delay between the plasma concentration and the pharmacological effect is taken into account using an effect compartment, and the drug effectiveness is related to the free favipiravir concentration Ceu(t)
in this compartment (Eq. 4).
𝑑𝐶𝑒𝑢
𝑑𝑡 = 𝑘𝑒0(𝐶𝑢(𝑡) − 𝐶𝑒𝑢(𝑡))
5 𝜀(𝑡) = 𝐸𝑚𝑎𝑥 𝐶𝑒𝑢(𝑡)𝑛
𝐸𝐶50𝑛+𝐶𝑒𝑢(𝑡)𝑛
where ke0 is a parameter reflecting the delay between the plasma and the effect
compartment.
2.5 Parameter estimation
Drug concentrations and viral load data were fitted separately using non-linear mixed-effect models (Pinheiro and Bates, 2006). In this approach, each individual parameter can be written as 𝜃𝑖 = 𝜃𝑒𝜂𝑖, where 𝜂
𝑖~𝑁(0, 𝜔𝑖2) and θ represents the median value of the parameter
in the population (called population parameters in the following), and ηi accounts for the
inter-individual variabilities. The data fitting was performed assuming an inter-individual variability of 40% on all parameters, a proportional error on the favipiravir concentration and an additive error on the log-viral load. Parameters were estimated by maximizing the likelihood using the stochastic approximation expectation–maximization (SAEM) algorithm implemented in Monolix Software v4.2 (http://www.lixoft.eu). Population parameters were reported with their associated standard error. Bayesian Information Criterion (BIC, the lower the better) was used to assess statistical relevance of structural modification.
After estimations of the population viral kinetic parameters were obtained, the individual viral load course was reconstructed using empirical Bayes estimates for the individual parameters. This allowed us to calculate the peak viremia value, the time to the peak, the average favipiravir effectiveness and the area under the curve (AUC) of viremia from 1 to 9 dpi. The values found in each group of treated mice were compared to the value found in untreated mice using Wilcoxon non-parametric test.
As no pharmacokinetic data was available in infected mice, we used the median values found in uninfected mice to simulate the pharmacokinetic concentrations in infected mice. Because the rates of the virion clearance and of the eclipse phase cannot be reliably identified using viral load data only, they were fixed to 20 and 4 day-1, respectively, as reported for other viral infections (Guedj et al., 2013; Smith and Perelson, 2011). Because only the product p×T0 can be estimated in Equation 2 (Stafford et al., 2000), T0 was set to 108
cells/mL, a proxy for the liver size, one of the largest target compartments for EBOV (Olejnik et al., 2011). For that reason, the estimated rate of viral production is directly proportional to the value assumed for T0. In order to assess the stability of the results, univariate sensitivity
analysis was carried out on parameters c and k.
6
3.1 Favipiravir pharmacokinetics
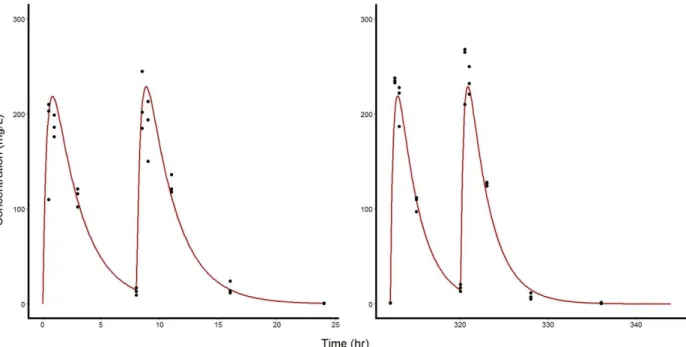
The pharmacokinetic model (Eq. 1) fit well the data with no indication of misspecification (Figures 3, S1 and S2). Median values (standard error) of ka, ke and VD were
found equal to 62.9 (8.16) d-1, 9.67 (0.288) d-1 and 0.488 (0.015) L/kg, respectively.
3.2 EBOV kinetics
The two models used to capture the effect of favipiravir, with or without an effect compartment, were tested and the fit of the data was better when a compartment effect was introduced (BIC of 202 vs 223, respectively). Therefore only the results of the compartment effect model will be discussed below and diagnostic plots of this model are given in Figures S3 and S4.
In all mice, the viremia initially increased exponentially, due to large availability and rapid infection of target cells (Figure 4). The basic reproductive number, R0, was estimated to
9.0 (standard error 2.4) (Table 1). Using the parameter values to reconstruct the viral kinetic profiles (Table 2), the median peak of viremia in untreated mice was predicted to be equal to 7 log10 (FFU/mL) (min-max range: [6.8-7.1]), and the median time to peak was 7.5 dpi with
little variation among mice. After the peak, the viremia declined exponentially, due to the exhaustion of target cells, (Figure 5), revealing a rapid elimination of productively infected cells with a median rate δ of 2.59 (0.77) d-1
, corresponding to a half-life of 6.4 hours. Because infected cells pass through an eclipse phase before producing virus (Equation 2), the average total infected cell lifetime, tinf, was longer and equal to 15.3 hours.
3.3 Antiviral effect of favipiravir
Because of the presence of an effect compartment there was a delay between treatment initiation and maximal drug effectiveness. The average drug effectiveness increased over time from 50% at day 1 post treatment initiation to 95%, 98.5% and 99.6% at 2, 3 and 6 days post treatment, respectively.
The early initiation of treatment at 6 dpi stopped the exponential increase in viremia (Figure 4) and led to a lower peak than in untreated mice (median peak value of 5.5 vs 7.0 log10 FFU/mL, P=0.004). As a consequence of the reduction in the viral replication near the
maximum, the pool of uninfected target cells in early treated mice remained largely preserved from EBOV infection (Figure 5). Furthermore, the median cumulative virus production, measured by the AUC of viremia from day 0 to day 9, was reduced from 21.9 in untreated mice to 18.0 log10 FFU/mL×day in mice treated from 6 dpi, but the difference did not reach
7 In mice treated at 8 dpi, the initiation of treatment came too late to impact the course of the infection and neither the peak value, the time to the peak, nor the AUC of viremia were significantly improved compared to untreated mice (Table 2).
Univariate sensitivity analysis showed that parameter estimates remained largely stable as long as c was larger than 2 d-1 and k was smaller than 20 d-1 (Table 3).
4. Discussion
We provided the first mathematical description of viral kinetics during EBOV infection in vivo in a small animal model. The model could well reproduce the viral load data and provided estimates of the elimination rate of infected cells and the basic reproductive number. Furthermore the dramatic decline in viremia in mice receiving oral favipiravir could also be modeled, revealing a strong antiviral effectiveness in blocking virion production in mice treated at 6 dpi. In mice treated at 8 dpi, the model predicted that death occurred before favipiravir achieved its maximal antiviral effectiveness.
Although Ebola virus infection rapidly leads to high level of viral load and death, the estimates of viral kinetic parameters remain comparable to ones reported in other acute viral infections. In particular, the half-life of infected cells, found equal to 6.4 hours, is close to the values found for influenza PR8-PB1-F2(1918), estimated to be between 7-24 hours (Smith et al., 2011). Likewise the basic reproductive number R0, estimated to 9, remained much lower
than the reproductive number estimated in mice infected with influenza H1N1 or PR8-PB1-F2(1918), all found to be larger than 20 (Smith et al., 2011). The initiation of favipiravir dramatically reduced the viral replication and our model predicted that favipiravir achieved an antiviral effectiveness in blocking viral replication of 95% and 99.6% at 2 and 6 days after initiation of treatment, respectively.
Several aspects limited the estimation of the parameters. First, as no pharmacokinetic data were available in infected mice, we had to assume that the drug pharmacokinetics in EBOV-infected mice was similar to what had been observed in uninfected mice. This assumption will need to be verified by assessing drug pharmacokinetics during the course of the infection. In particular a study conducted in hamsters has suggested that infection with arenavirus led to lower favipiravir plasma and tissue concentration and that the impairment in pharmacokinetics increased with higher viral load levels (Gowen et al., 2015). Second the viral clearance rate, c, and the eclipse phase rate of transition, k, had to be fixed to ensure parameter identifiability. The results of the sensitivity analysis showed that the parameter estimates were largely robust as long as c and k remained larger than 2 d-1 (corresponding to virion half-life of 8 hours) and lower than 20 d-1 (corresponding to a median value of 0.83 hours), respectively. For comparison in vivo virion half-life in Influenza virus, HCV or HIV infections were found shorter than 6 hours whereas the median eclipse phase duration in
8 Influenza was larger than 4 hours (Beauchemin and Handel, 2011; Chatterjee et al., 2012; Perelson, 2002). Although the intervals found for these viruses may not be true for EBOV, it is reassuring that the parameter values found here were not substantially modified by changes of k and c within the previously observed range of values for these parameters in vivo.
Beside the limitations on parameter values, the mathematical model remains a simple representation of the complex biological processes occurring during infection. First, the model assumes that the infection takes place in a single compartment. This may be appropriate for infections having a clear tropism, such as influenza or hepatitis viruses. However in the case of a systemic infection such as EBOV, both the viral production and the treatment effectiveness may differ in each compartment of the infection. Second the infected mice lacked a type-I IFN response, which is a critical component of the immune response against systemic viral infections (Mohamadzadeh et al., 2007). Despite the alteration of the innate immune response, the viremia dropped after the peak, which was interpreted in the model as an effect of target cell exhaustion and rapid elimination of infected cells. Whether this short half-life of infected cells is modulated by the adaptive or innate immune response (and may be enhanced by IFN in other models) or is mostly the result of the viral cytopathic effect will have to be determined. Further the translation of our results to nonhuman primates (NHPs), which are generally considered as the gold-standard model for studying pathogenesis and evaluating potential medical countermeasures (Safronetz et al., 2013), or even human, remains to be investigated. However, we note that both the patterns of viral kinetics (time to the peak, peak viremia) and survival time were very similar here to what has been described in NHPs (Geisbert et al., 2003), supporting that the results found here may be relevant for understanding EBOV dynamics in larger animals.
Because the therapeutic dose of favipiravir in ongoing clinical trials was chosen in order to achieve the same exposure than the one achieved here in mice (Mentré et al., 2015), favipiravir may have the capability to reduce viral load in humans. However, our analysis indicated that favipiravir needed at least 3 days to achieve its maximal effectiveness, which can be due to the time needed to achieve high levels of intracellular triphosphates. This may explain why mice receiving favipiravir 8 dpi, i.e. after the viremia peak was reached, died within 1-2 days before a dramatic change in viremia could occur, and predicts that a therapeutic effect of the drug can hardly be achieved in patients in the terminal stage of the disease.
5. Conclusion
This work provided first estimates of kinetic parameters of EBOV dynamics in mice, such as a short half-life of infected cells and a moderate basic reproductive number. In addition, we estimated the time orally administered favipiravir needs to become fully effective. This result reinforces the hypothesis that favipiravir, in order to be effective, needs to be administered as early as possible.
9
Acknowledgements:
This project has received funding from the European Union’s Horizon 2020 research and innovation programme under grant agreements No. 666092 and 666100. We thank Toyama Chemical for sharing data on favipiravir pharmacokinetics in mice.
References
Baccam, P., Beauchemin, C., Macken, C.A., Hayden, F.G., Perelson, A.S., 2006. Kinetics of influenza A virus infection in humans. J. Virol. 80, 7590–7599.
Beauchemin, C.A.A., Handel, A., 2011. A review of mathematical models of influenza A infections within a host or cell culture: lessons learned and challenges ahead. BMC Public Health 11 Suppl 1, S7.
Canini, L., Perelson, A.S., 2014. Viral kinetic modeling: state of the art. J. Pharmacokinet. Pharmacodyn. 41, 431–443.
Chatterjee, A., Guedj, J., Perelson, A.S., 2012. Mathematical modeling of HCV infection: what can it teach us in the era of direct antiviral agents? Antivir. Ther. 17, 1171–1182. Feldmann, H., Geisbert, T.W., 2011. Ebola haemorrhagic fever. Lancet 377, 849–862.
Furuta, Y., Takahashi, K., Kuno-Maekawa, M., Sangawa, H., Uehara, S., Kozaki, K., Nomura, N., Egawa, H., Shiraki, K., 2005. Mechanism of action of T-705 against influenza virus. Antimicrob. Agents Chemother. 49, 981–986.
Geisbert, T.W., 2015. Emergency treatment for exposure to Ebola virus: the need to fast-track promising vaccines. JAMA 313, 1221–1222.
Geisbert, T.W., Hensley, L.E., Jahrling, P.B., Larsen, T., Geisbert, J.B., Paragas, J., Young, H.A., Fredeking, T.M., Rote, W.E., Vlasuk, G.P., 2003. Treatment of Ebola virus infection with a recombinant inhibitor of factor VIIa/tissue factor: a study in rhesus monkeys. Lancet 362, 1953–1958.
Gowen, B.B., Sefing, E.J., Westover, J.B., Smee, D.F., Hagloch, J., Furuta, Y., Hall, J.O., 2015. Alterations in favipiravir (T-705) pharmacokinetics and biodistribution in a hamster model of viral hemorrhagic fever. Antiviral Res. 121, 132–137.
Guedj, J., Dahari, H., Rong, L., Sansone, N.D., Nettles, R.E., Cotler, S.J., Layden, T.J., Uprichard, S.L., Perelson, A.S., 2013. Modeling shows that the NS5A inhibitor daclatasvir has two modes of action and yields a shorter estimate of the hepatitis C virus half-life. Proc. Natl. Acad. Sci. U. S. A. 110, 3991–3996.
Mentré, F., Taburet, A.-M., Guedj, J., Anglaret, X., Keïta, S., de Lamballerie, X., Malvy, D., 2015. Dose regimen of favipiravir for Ebola virus disease. Lancet Infect. Dis. 15, 150– 151.
10 Mohamadzadeh, M., Chen, L., Schmaljohn, A.L., 2007. How Ebola and Marburg viruses
battle the immune system. Nat. Rev. Immunol. 7, 556–567.
Neumann, A.U., Lam, N.P., Dahari, H., Gretch, D.R., Wiley, T.E., Layden, T.J., Perelson, A.S., 1998. Hepatitis C viral dynamics in vivo and the antiviral efficacy of interferon-alpha therapy. Science 282, 103–107.
Oestereich, L., Lüdtke, A., Wurr, S., Rieger, T., Muñoz-Fontela, C., Günther, S., 2014. Successful treatment of advanced Ebola virus infection with T-705 (favipiravir) in a small animal model. Antiviral Res. 105, 17–21.
Olejnik, J., Ryabchikova, E., Corley, R.B., Mühlberger, E., 2011. Intracellular events and cell fate in filovirus infection. Viruses 3, 1501–1531.
Perelson, A.S., 2002. Modelling viral and immune system dynamics. Nat. Rev. Immunol. 2, 28–36.
Perelson, A.S., Guedj, J., 2015. Modelling hepatitis C therapy-predicting effects of treatment. Nat. Rev. Gastroenterol. Hepatol. 12, 437–445.
Pinheiro, J., Bates, D., 2006. Mixed-Effects Models in S and S-PLUS. Springer Science & Business Media.
Safronetz, D., Geisbert, T.W., Feldmann, H., 2013. Animal models for highly pathogenic emerging viruses. Curr. Opin. Virol. 3, 205–209.
Sissoko, D., Anglaret, X., Malvy, D., Folkesson, E., Abdoul, M., Shepherd, S., Danel, C., Beavogui, A.H., Gunther, S., Mentre, F., 2015. Favipiravir in Patients with Ebola Virus Disease: Early Results of the JIKI trial in Guinea. Presented at the CROI 2015, Abstract Number 103-ALB, Seattle, Washington, USA.
Smith, A.M., Adler, F.R., McAuley, J.L., Gutenkunst, R.N., Ribeiro, R.M., McCullers, J.A., Perelson, A.S., 2011. Effect of 1918 PB1-F2 expression on influenza A virus infection kinetics. PLoS Comput. Biol. 7, e1001081.
Smith, A.M., Perelson, A.S., 2011. Influenza A virus infection kinetics: quantitative data and models. Wiley Interdiscip. Rev. Syst. Biol. Med. 3, 429–445.
Smither, S.J., Eastaugh, L.S., Steward, J.A., Nelson, M., Lenk, R.P., Lever, M.S., 2014. Post-exposure efficacy of oral T-705 (Favipiravir) against inhalational Ebola virus infection in a mouse model. Antiviral Res. 104, 153–155.
Stafford, M.A., Corey, L., Cao, Y., Daar, E.S., Ho, D.D., Perelson, A.S., 2000. Modeling plasma virus concentration during primary HIV infection. J. Theor. Biol. 203, 285– 301.
11 Figure 1: Survival (top line), mean relative weight loss (middle line), and mean viremia
(bottom line) in mice IFNαR-/- infected by 1000 FFU of Zaire Mayinga 1976 Ebola virus by nasal route, and receiving no treatment (left panels), favipiravir started on day 6 (middle panels), and on day 8 (right panels). Mice treated by favipiravir received dose of 150 mg/kg twice a day, by oral route. Error bars represent 95% confidence interval of the mean.
Reproduced from (Oestereich et al., 2014).
Figure 2: Model of the host-pathogen-drug interactions during infection with EBOV and treatment with favipiravir. In the viral kinetic part of the model (black), T, I1, I2 and V
represent target cells, infected non-productive cells, productively infected cells and free virions, respectively. Parameters β and k represent the infection and the transition from non-productively to non-productively infected cells, respectively, while c and δ are elimination rate of free virions and infected cells, respectively. In absence of treatment, infected cells produce p
12 virions per day and this production is lowered in presence of favipiravir using an E-max model parameterized by EC50, Emax and n. Drug pharmacokinetics is defined by the absorption
rate, ka, the elimination rate ke. In order to account for a possible delay between drug
concentration in plasma, i.e. central compartment C, and pharmacological effect, a compartment effect noted Ce (associated with a transition rate ke0) was added.
Figure 3: Observed total plasma concentrations (black dots) and median predicted profile (red line) in mice treated by oral favipiravir 150 mg/kg BID, on the first day of administration (left panel), and after 14 days of repeated administration (right panel)
13 Figure 4A
Figure 4B
Figure 4: Viremia data (points) and individual model prediction (line) in A) untreated mice. B) mice treated with favipiravir 300 mg/kg/day at 6 dpi (upper panel) or 8 dpi (lower panel). Data below the limit of quantification of the assay (30 FFU/mL) are indicated in red.
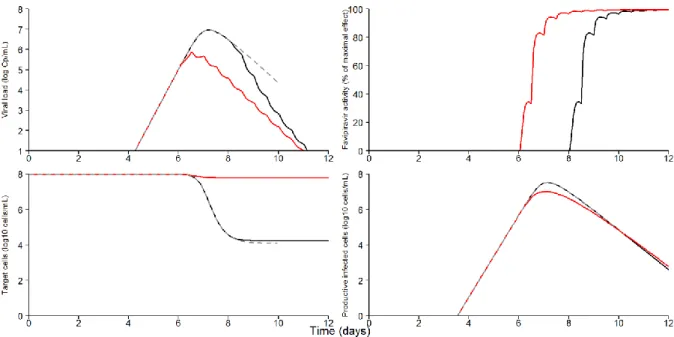
14 Figure 5: Predicted kinetics of viremia (top left), antiviral effectiveness of favipiravir (top right), target cells population (bottom left) and productively infected cells population (bottom right) during the course of the infection. Dashed gray are non-treated mice, solid red line are mice treated at 6 dpi and solid black line are mice treated 8 dpi. In each treatment group the predictions were computed using the estimated population parameter and were run until the last observed death time.
Table 1: Estimated population parameters of the viral kinetic model. δ is the elimination rate of infected cells, p is the virion production rate, V0 is the initial viremia, R0 is the basic
reproductive number and ke0 is the transfer constant of effect compartment.
Estimated population parameters, median (standard error) δ (day-1 ) 2.59 (0.77) p (day-1) 5.56 (3.2) V0 (log10(FFU/mL)) -8.02 (1.6) R0 9.01 (2.35) ke0 (d-1) 0.321 (0.094)
15 Table 2: Predicted peak values, times to the peak, viremia AUC and average favipiravir effectiveness according to the treatment group. Six dpi treated group and 8 dpi treated group were compared to untreated group using non-parametric Wilcoxon test.
Median peak (log10(FFU/mL))
[min-max]
p Median time to peak
(days) [min-max] p Median viremia AUCD1-D9 (log10(FFU/mL)•day) [min-max] p Average antiviral effectiveness at 6 dpi Average antiviral effectiveness at 7 dpi Average antiviral effectiveness at 8 dpi Average antiviral effectiveness at 12 dpi Non treated mice (n=10) 6.99 [6.77-7.06] NA 7.59 [6.17-8.43] NA 21.90* [19.28-26.83] NA NA NA NA NA Favipiravir 6-13 dpi (n=5) 5.49 [3.50-6.82] 0.004 6.52 [4.92-7.02] 0.028 18.02 [10.21-22.12] 0.065 49.9% 94.6% 98.5% 99.6% Favipiravir 8-14 dpi (n=5) 7.10 [6.77-7.18] 0.358 7.20 [6.98-8.14] 0.953 23.22 [20.37-25.68] 0.622 NA NA 49.9% 99.3% *
16 Table 3: Sensitivity analysis for different values of the viral clearance (c) and the transition rate from non-productively to productively infected cells (k). δ is the elimination rate of infected cells, p is the virion production rate, V0 is the initial viremia, R0 is the basic reproductive number
and ke0 is the transfer constant of effect compartment.
Sensitivity analysis
Estimated population parameters, median (standard error)
c = 2 day-1 c = 5 day-1 c = 10 day-1 c = 30 day-1 c = 60 day-1 c = 100 day-1 δ (day-1 ) 6.05 (17) 3.34 (1.5) 2.5 (0.77) 2.42 (0.59) 2.84 (0.72) 3.24 (1.1) p (cell-1day-1) 0.76 (2.2) 1.78 (1.3) 2.25 (1.2) 8.07 (3.6) 17.60 (7.2) 54.70 (33) V0 (log10(FFU/mL)) -6.91 (1.8) -6.47 (1.6) -6.88 (1.8) -8.55 (0.51) -6.66 (1.2) -7.74 (0.31) R0 12.74 (15.58) 9.62 (3.61) 9.52 (3.63) 9.43 (1.78) 6.67 (1.56) 6.62 (1.49) ke0 (day -1 ) 1.28 (1.9) 0.47 (0.16) 0.32 (0.10) 0.29 (0.08) 0.28 (0.07) 0.28 (0.08) k = 2 day-1 k = 6 day-1 k = 8 day-1 k = 10 day-1 k = 20 day-1 k = 40 day-1 δ (day-1 ) 4.80 (4) 2.44 (0.67) 2.68 (0.67) 2.36 (0.49) 2.59 (0.59) 2.65 (0.71) p (cell-1day-1) 9.52 (9.1) 4.94 (2.6) 7.50 (3.9) 5.82 (2.5) 6.93 (3.4) 7.05 (3.8) V0 (log10(FFU/mL)) -8.52 (0.83) -7.60 (1.2) -8.00 (1.1) -8.53 (0.29) -8.23 (1.7) -7.95 (1.9) R0 10.42 (4.34) 7.30 (2.13) 6.25 (1.37) 6.58 (1.08) 4.98 (1.09) 4.27 (1.17) ke0 (day -1 ) 0.36 (0.12) 0.26 (0.08) 0.27 (0.07) 0.26 (0.07) 0.24 (0.07) 0.24 (0.07)