HAL Id: lirmm-01275684
https://hal-lirmm.ccsd.cnrs.fr/lirmm-01275684
Submitted on 18 Oct 2017
HAL is a multi-disciplinary open access
archive for the deposit and dissemination of
sci-entific research documents, whether they are
pub-lished or not. The documents may come from
teaching and research institutions in France or
abroad, or from public or private research centers.
L’archive ouverte pluridisciplinaire HAL, est
destinée au dépôt et à la diffusion de documents
scientifiques de niveau recherche, publiés ou non,
émanant des établissements d’enseignement et de
recherche français ou étrangers, des laboratoires
publics ou privés.
Images of Urban Areas by Combining Two Methods
Jérôme Pasquet, Thibault Desert, Olivier Bartoli, Marc Chaumont, Carole
Delenne, Gérard Subsol, Mustapha Derras, Nanée Chahinian
To cite this version:
Jérôme Pasquet, Thibault Desert, Olivier Bartoli, Marc Chaumont, Carole Delenne, et al.. Detection
of Manhole Covers in High-Resolution Aerial Images of Urban Areas by Combining Two Methods.
IEEE Journal of Selected Topics in Applied Earth Observations and Remote Sensing, IEEE, 2016, 9
(5), pp.1802-1807. �10.1109/JSTARS.2015.2504401�. �lirmm-01275684�
aerial images of urban areas by combining two
methods
J´erˆome PASQUET
∗‡, Thibault DESERT
†, Olivier BARTOLI
†, Marc CHAUMONT
‡§,
Car-ole DELENNE
k, G´erard SUBSOL
‡, Mustapha DERRAS
∗and
Nan´ee CHAHINIAN
†Abstract—Mispositioning of buried utilities is an increas-ingly important problem both in industrialized and developing countries because of urban sprawl and technological advances. However, some of these networks have surface access traps which may be visible on high resolution airborne or satellite images and could serve as presence indicators. We put forward a methodology to detect manhole covers and grates on very high-resolution aerial and satellite images. Two methods are tested: the first is based on a geometrical circular filter whereas the second uses machine learning to retrieve some patterns. The results are compared and combined in order to benefit from the two approaches.
Index Terms—Machine learning; geometrical filter; buried utility network; circular object detection; high resolution
I. INTRODUCTION
R
EGARDLES of economic growth, urban expansion is an on-going trend [1] [2] and urban areas are viewed as particularly vulnerable to climate change; current forecasts predict increasing poverty and rapid urbanization [3]. Hence, urban areas are highly sensitive and need frequent monitoring. One of the direct consequences of urban expansion is the development of underground utility networks. Over the past century it was common practice for public service providers to install, operate and repair their networks separately [4]. Hence it is now very difficult to find accurate records of utility network maps. Mispositioning of buried utilities is an increas-ingly important problem both in industrialized and developing countries because of urban sprawl and technological advances that create new needs among consumers resulting in additional cables and pipes that have to be added and connected [5] [6]. Urban works will thus be more prone to delays with concomitant additional costs [7] [8]. Locating past records can be a cumbersome and time consuming task. An alternative would be to use a quick survey method to have an estimate of the current situation. Some of these buried networks have surface access traps which may be visible on high resolution airborne or satellite images. Indeed, high spatial resolution∗Berger-Levrault, Lab`ege, France
†IRD, UMR HSM 5569 (CNRS, IRD, Universit´e de Montpellier), France § Univ Nimes, France
‡ LIRMM, Univ. Montpellier / CNRS, France
¶ Univ. Montpellier, UMR HSM 5569 (CNRS, IRD, Univ. Montpellier), France
imagery is becoming more and more available. There is a growing number of cities that provide high resolution (<20 cm/pixel) orthophotos through open data platforms i.e. free of charge. If correctly detected, these elements could serve as indicators of underground utility networks. Furthermore, they can be used as landmarks in photogrammetric applications [9] or in geotechnical works such as subsidence calculations [10]. We put forward a methodology to detect small urban objects, namely manhole covers and grates, on very high-resolution aerial and satellite images. Two methods are tested: the first is based on a geometrical circular filter whereas the second uses machine learning to retrieve some patterns. The results are compared and combined in order to benefit from the two approaches.
II. MATERIALS AND METHODS
T
HE methodology is tested on a small town in southern France (Gigean, Herault).A. Data
Three images with different resolutions were used to put forward the method. Pl´eiade bundle products (50 cm resolu-tion) obtained through the SUDOC project and Orthophotos (Fig. 1) of the town of Gigean (Herault, South of France) with a 25 cm resolution provided by SIG-LR, were used in the pretreatment step of the methodology. Supplementary high resolution orthorectified aerial photographs (5,300 x 5,500 pixels at 4 cm resolution) were specifically acquired since the machine learning method requires a very high resolution (see Figure 2). Ground truth was acquired on three residential zones (Zone 1 to 3 in Fig. 1).
The methodology is threefold. First the image is segmented to extract the zones where manhole covers and grates can be found i.e. roads, streets and pavements. Then the vegetation and shadows are eliminated by using colorimetric indices, using infrared information provided by the Pl´eiade images. Finally either the circular object detection method proposed in [11] or the machine learning approach is used to locate the manhole covers and grates. These two methods are compared and merged to increase the detection performance.
Fig. 1. Orthophoto of Gigean, south of France c SIG-LR 2014, and location of the three testing zones used to validate the approach.
Fig. 2. Extract of the 4 cm resolution image.
B. Pretreatment procedure
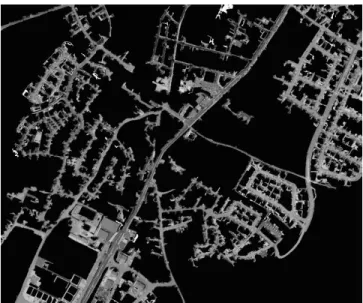
1) Roads detection: Several methods were tested to extract the roads. The most efficient one in terms of implementation simplicity, calculation time and final results, consists in select-ing all the light grey pixels in the image, i.e. pixels havselect-ing a low intensity in all channels of the image. The average value of each pixel over the three channels (Red, Green, Blue) is computed and the pixel is classified as ”road” if its radiometric value in each channel deviates from the mean value by less than a given threshold. In this application the threshold was set to 10%. Classified pixels are then merged into connected components using the union-find algorithm. The roads are expected to constitute large connected components; hence the smallest units (smaller than 1000 pixels) are eliminated. Figure 3 shows the orthophoto after the road detection step.
2) Vegetation and shadow removal: Two indices are used to segment the vegetation. The classical NDVI uses the Near InfraRed (NIR) information of the Pl´eiades images in contrast
Fig. 3. Roads detection using grey-level threshold and extraction of the biggest connected components.
with the Red (R) band:
NDVI = NIR-R
NIR+R (1)
The ExG index (Excess Green) is used on the areal orthopho-tos which do not have a NIR channel; it is defined as:
ExG = 2G-R-B (2) The results are then combined to benefit from the spectral resolution of the Pl´eiades images and the spatial resolution of the orthophotos (see Fig. 4).
Fig. 4. Detection of vegetation using, left: NDVI, middle: ExG and right: fusion of the two previous results. Whiter pixels belong to the vegetation class.
The shadow elimination procedure is based on Dempster-Shafer’s evidence theory following a method presented in [12]. A final smoothing using the Iterated Conditional Modes (ICM) algorithm [13] is performed (Fig. 5). The resulting shadow characteristic image is then combined with the vegetation image to clean the orthophotos from areas not supposed to contain manhole covers.
C. Circular object detection
The geometrical approach is based on the method proposed in [11] for the detection of circular patterns in a noisy and low contrasted image. The authors put forward a filter that consists of two annular regions R1 and R2 of radius r1 to r and r to
Fig. 5. Shadow elimination from [12] and smoothing using an ICM algorithm.
r
2r
r
1R
1R
2 S1 3 S1 1 S15 S2 5 S1 6 S2 6 S1 7 S2 7 S1 8 S28 S21 S22 S2 3 S2 4 S14 S1 2Fig. 6. Circular filter (from [11]). Left: R1and R2are the two main regions;
middle and right: definition of the subregions (the phase shift is π/4).
The filter is applied to a grey-scaled image, obtained with the luminance formula.
Three indices are computed to detect a circular pattern on a sliding window, using normalized histograms of each region/subregion. The first one estimates the similarity be-tween two statistical distributions using the Bhattacharyya coefficient: S(R1, R2) = L X l=1 p p1(l)p2(l) (3)
where p1 (respectively p2) is the normalized histogram of
R1 (respectively R2) and L is the maximal intensity of the
two histograms. The result of this index is 1.0 when the two histograms are identical and 0.0 when they are completely different. The desirable value for this index to isolate a circular pattern from its background is thus the lower.
The second index is computed to avoid detection of linear patterns. It is based on the comparison between the intensity distribution of R1 and those of the eight sub-regions of R2:
S8= max j∈1...8 n S(R1, S2j) o (4)
where S2j denotes the jth subregion of R
2. This index is
low when all oriented similarity scores between R1 and each
subregion of R2 are small.
The last index assesses the uniformity within the two main regions:
U(Ri) = min j,j0∈{1..8}
n
S(Sij, Sij0)o (5)
ζ = (1 − max {S(R1, R2), S8}) · U(R1) · U(R2) (6)
The higher the value of ζ, the higher the probability of encountering a circular shaped object.
D. Machine learning approach
The circular object detection is only efficient when there is an average color difference between the inside and outside circles. Moreover, this approach doesn’t use the texture in-formation inside the circle to decide on the manhole cover identification. To overcome these problems we use a machine learning algorithm which builds the best model from the data. This method is quite efficient for urban object detection [14]. The learning phase involves three steps [15]:
• extraction of a sample composed of manhole covers and
small random images from the training database (each extract being resized to a constant size for the sake of robustness at all scales);
• extraction of multiple histograms from oriented gradients (HOG) [16] to transform data into feature vectors mea-suring the distribution of the gradient angles within the image;
• application of a linear SVM classifier [17] to create the required model.
The scene covered by the 4cm image contained 125 manholes, with an average size of 80 x 80cm, 91 of which were used to build the training set and 34 for the testing step. During the evaluation step, a multi-scale representation of the testing image called ”pyramid” is used. The pyramid approach allows us to find manhole covers with different sizes. A sliding window is applied on each pyramid to localise the manhole cover. During the process, the training classifier gives a score for recognized manhole covers at each position.
E. Merging the approaches
The significant difference between the two approaches, stems from the fact that the first one uses pixel intensity to detect a circular shape while the second one is based on a model of the object, built from the gradient. We observed that the detection errors differ from one approach to the other. Therefore, we combined the results from the two methods to increase the detection performance. The final score is obtained by merging the scores given by each approach. Let f (x) be a function that returns the value of ζ for a pixel x (Eq. 6) rescaled between 0 and 100, and g(x) a function that returns the probability of a pixel x being a manhole cover center by the machine learning approach. The product function between f and g is called h (Eq. 7) and is used as a score value for the presence of manhole covers. Note that all the objects may not be detected by both methods. For instance, function f returns a null score for rectangular shapes. We thus suggest other functions for scoring the presence of a manhole cover,
s(x) for the sum (Eq. 8), n(x) and m(x) for the min and max (Eqs. 9 and 10). Scoring functions are evaluated in section III. h(x) = f (x).g(x) (7) s(x) = 2.f (x) g(x) = 0 2.f (x) f (x) = 0 f (x) + g(x) otherwise (8) n(x) = min(f (x), g(x)) (9) m(x) = max(f (x), g(x)) (10) III. RESULTS
T
HE circular method was first applied on three test zones extracted from the orthophoto image, corresponding to housing estates for which ground truth is available.TABLE I
DETECTION RESULTS IN RESIDENTIAL AREAS
Zones 1 2 3 Manholes per zone (nb) 26 19 19
Detected objects (nb) 23 21 13 True positives (nb) 12 11 4 False positives (nb) 11 10 9 Detected manholes (%) 46% 58% 21% Undetected manholes (%) 54% 42% 79% False detection (%) 47% 47% 69%
The primary results indicate (Tab. I) that the filter is able to detect manhole covers, in all three zones with slightly better results for zone 2 and poorer results for zone 3. As the three zones are residential areas with similar semi-detached houses, the difference in results is thought to be caused by a higher proportion of vegetation and shadows. Fig. 7 shows examples of true and false positives as well as undetected objects.
Fig. 7. Examples of results. Left: true positive, middle: undetected; right: false positive.
The results also highlight the existence of false positives, reaching nearly 60% in zone 3. No clear typology of the situations which lead to false detection can be made at this stage. Over the three zones, 42% to 79% of manholes remain undetected. This may seem as a poor result, however, it is common practice in southern France not to systematically take down all manhole locations during surveying, but rather to register only half or one third of covers each time, in an effort to cut down costs.
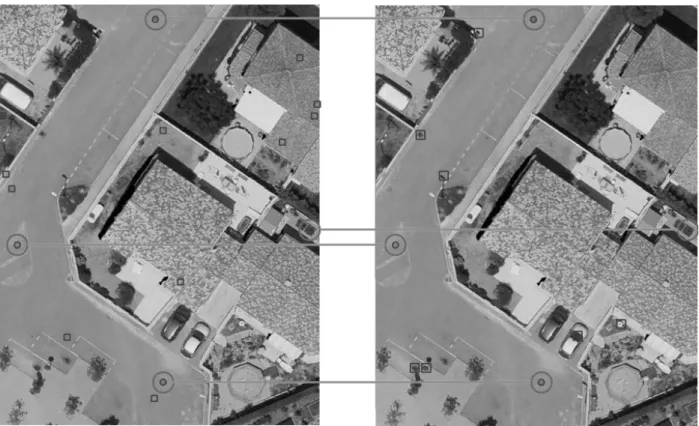
The two methods have then been applied on the 4 cm resolution image (see Figure 8). Their results are compared in terms of precision and recall:
precision = TP TP+FP (11) Page 1 0 10 20 30 40 50 60 0 10 20 30 40 50 60 70 80 90 100 ML CF Recall (%) P re ci si on ( % )
Fig. 9. Precision vs recall, with circular pattern detection (CF) and with the machine learning method (ML).
recall = TP
TP+FN (12)
where TP stands for true positive i.e. number of correctly detected manhole covers; FN for false negative, i.e. number of omitted manhole covers and FP for false positive, i.e. number of objects confused as manhole covers. TP+FP is thus the total number of detected objects.
Figure 9 illustrates the performance of the circular detec-tion filter method using a Receiver Operating Characteristics (ROC) graph [18] i.e. precision as a function of the recall, where the threshold applied to ζ varies. All manhole covers could not be detected by this method because about 20% of them had a rectangular shape and were undetectable. We also noticed a significant number of false positives. In fact, there were many circular patterns on the road such as oil spots or potholes, which are enhanced as the image is smoothed.
The ROC curve of the machine learning method, which has higher precision than the previous one, is also plotted in Figure 9. Poor results are obtained: for a recall of 50%, only 20% of the objects were manhole covers. They may stem from the small size of the training database.
Figure 10 illustrates the combined method, with functions h, s, n and m. All these functions but s give better results than the two methods taken separately. The poorer results obtained with the summing function s were due to the addition of all detections, including false ones. Hence, the precision was worsened according to Eq. 11.
With the other functions (m, n and h), the precision was increased by more than 25%. For instance, a recall of 40% corresponded to a precision of approximately 43% for the machine learning approach (M L curve) and reached 68% for the min function (n curve).
We noticed that the maximum function m gave a better score: nearly twice the precision of the machine learning method. Actually, if the classifier probability value is high, then this response is more efficient than the dot or minimum return. This could have two explanations. First, nearly ideal circular shapes may be detected with high precision by the
Fig. 8. The two figures represent the results obtained with the circular filter on the left and the machine learning method on the right. The rectangles are the true negatives and the circles are the true positives. The lines connect the two common results between two approaches. The testing image is at 4 cm resolution. Feuille1 Page 1 0 10 20 30 40 50 60 0 10 20 30 40 50 60 70 80 90 100 s h m n Recall (%) P re ci si on ( % )
Fig. 10. Results of the combined method: sum (s), product (h), maximum (m) and minimum (n) functions. Comparison with the two approaches (ML-machine learning) and (CF-circular filter)
circular filter, but may have a lower probability with the machine learning method, which has no information on the shape. In contrast, the circular filter gives a lower score for rectangular manhole covers, contrary to the machine learning approach, which is more robust.
The main shortcomings of this kind of approach are that, when using two methods, the combined recall value is always lower than the lowest score of each method taken separately.
IV. CONCLUSION
The objective of this work was to put forward a methodol-ogy to detect small urban objects on high resolution images in order to reconstruct buried utility networks. The main challenge was to detect grey objects whose size is within the spatial resolution limit of the image and that are located on a grey background.
The preliminary results obtained using the geometrical filter are satisfactory as they allow the detection of 42% of manhole covers in residential areas. Surveying companies in southern France are often required to report one third of manholes in order to cut down production costs. Our method thus allows the same detection rate. However, the rate of false negatives is still unacceptably high and remains unchanged even when using higher resolution images (4 cm resolution). Additional criteria can be used to discriminate these false negatives, such as the density of detected objects. Furthermore, we are currently investigating the use of alternative remote-sensing data such as thermal or infra-red images, in order to improve the detection rate.
Regarding the machine learning method, the results show that nearly 40% of manhole covers were detected with a precision of 80%. These results are encouraging, specially considering that a small training database was used.
Many options remain unexplored and will be investigated in the very near future. For instance, a square filter could be added to the geometrical detection procedure, additional SVMs could be tested as well as other combined methods [19]. The
high resolution of the aerial images for the localisation of small urban objects is a highly promising research field.
The final objective of this project is to estimate urban contri-bution to downstream waterbodies and not to precisely assess water fluxes in the buried network itself. Based on the detected manhole covers locations, and knowing the efficiency of the method, a network will be statistically reconstructed using the rules and regulations of drainage network implementation in France.
A sensitivity analysis will also be performed to estimate the impact the partial information on network characteristics have on the assessment of downstream fluxes.
ACKNOWLEDGMENT
This work has been suported by the Programme National de T´el´ed´etection Spatiale
(PNTS, http://www.insu.cnrs.fr/actions-sur-projets/pnts-programme-national-deteledetection-spatiale), grant noPNTS-2014-01.
This work was supported by public funds received in the framework of GEOSUD, a project (ANR-10-EQPX-20) of the program ”Investissements d’Avenir” managed by the French National Research Agency”.
The orthophotos of Gigean were kindly provided by SIG-LR.
REFERENCES
[1] S. Poelhekke, “Urban growth and uninsured rural risk: Booming towns in bust times,” Journal of Development Economics, no. 96, pp. 461–475, 2011.
[2] D. Burns, V. T., J. McDonnell, J. Hasseth, J. Duncan, and C. Kendall, “Effects of suburban development on runoff generation in the croton river basin, new york, usa,” Journal of Hydrology, no. 311, pp. 266–281, 2005. [3] R. Gasper, A. Blohm, and M. Ruth, “Social and economic impacts of climate change on the urban environment,” Current Opinion in Environ-mental Sustainability, no. 3, pp. 150–157, 2011.
[4] C. Rogers, T. Hao, S. Costello, M. Burrow, N. Metje, D. Chapman, ..., and A. Saul, “Condition assessment of the buried utility service infrastructure: a proposal for integration.” Tunnelling and Underground Space Technology, vol. 28, pp. 202–211, 2012.
[5] H. Jamil, N. Z., and M. Mohid Yussof, “Underground utility mapping and its challenges in malaysia,” in FIG working week 2012. Knowing to manage the territory, protect the environment, evaluate the cultural heritage, Rome, Italy, 2012, p. 15.
[6] N. Metje, P. Atkins, M. Brennan, D. Champan, H. Lim, J. Machell, J. Muggleton, S. Pennock, J. Ratcliffe, M. Redfern, C. Rogers, A. Saul, Q. Shan, S. Swingler, and A. Thomas, “Mapping the underworld: State of the art review,” Tunnelling and underground space technology, no. 22, pp. 568–586, 2007.
[7] Y. Yung, “Evaluation of subsurface utility engineering for highway projects: benefit-cost analysis,” Tunnelling and underground space tech-nology, no. 27, pp. 111–122, 2012.
[8] H. Jeong, D. Abraham, and J. Lew, “Evaluation of an emerging market in subsurface utility engineering,” Journal of construction engineering and management, vol. 130, no. 2, pp. 225–234, 2004.
[9] C. Drewniok and K. Rohr, “Exterior orientation-an automatic approach based on fitting analytic landmark models,” ISPRS Journal of Photogram-metry and Remote Sensing, vol. 52, pp. 132–145, 1997.
[10] G. Liu, H. Jia, R. Zhang, H. Zhang, H. Lia, and M. Sang, “Exploration of subsidence estimation by persistent scatterer insar on time series of high resolution terrasar-x images.” Selected Topics in Applied Earth Observations and Remote Sensing, IEEE Journal, vol. 4, no. 1, pp. 159– 170, 2011.
[11] H. Niigaki, J. Shimamura, and M. Morimoto, “Circular objet detec-tion based on seperability and uniformity of feature distribudetec-tions using bhattacharrya coefficient,” in 21st International conference on pattern regocnition (ICPR 2012), Tsukuba, Japan, 2012, pp. 2009–2012.
[12] T.-T. Ngo, C. Collet, and V. Mazet, “D´etection simultan´ee de l’ombre et la v´eg´etation sur des images a´eriennes couleur en haute r´esolution,” in RIFA, 2014.
[13] R. Glendinning, “An evaluation of the ICM algorithm for image re-construction,” Journal of Statistical Computation and Simulation, vol. 3, no. 31, pp. 169–185, 1989.
[14] M. Chaumont, L. Tribouillard, G. Subsol, F. Courtade, J. Pasquet, and M. Derras, “Automatic localization of tombs in aerial imagery: application to the digital archiving of cemetery heritage,” in Digital Heritage -International Congress, vol. 1, 2013, pp. 657–660.
[15] P. Viola and M. Jones, “Rapid object detection using a boosted cascade of simple features,” in Proceedings of Computer Vision and Pattern Recognition, 2001, pp. 511–518.
[16] Q. Qiang, S. Avidan, M. Yeh, and K. Cheng, “Fast human detection using a cascade of histograms of oriented gradients,” Proceedings of Computer Vision and Pattern Recognition, no. 1491-149, 2006. [17] R. Fan, K. Chang, C. Hsieh, and C. Lin, “’LIBLINEAR: A library for
large linear classification,” Journal of Machine Learning Research, vol. 9, pp. 1871–1874, 2008.
[18] T. Fawcett, “An introduction to ROC analysis,” vol. 27, pp. 861–874, 2006.
[19] J. Kittler, M. Hatef, R. P. W. Duin, and J. Matas, “On combining classifiers,” IEEE Trans. Pattern Anal. Mach. Intell., vol. 20, no. 3, pp. 226–239, Mar. 1998. [Online].
detection and segmentation in aerial photography.
T. Desert Thibault Desert received the M.Sc. degree in applied mathematics from the French National Institute of Applied Sciences (INSA) in Toulouse in 2015. He worked as a research fellow on project PNTS 2014-1.He is currently pursuing the Ph.D. degree at ONERA, in the field of aerodynamic design.
O. Bartoli Olivier Bartoli received an M.Sc. degree in the field of image treatment from the University of Montpellier in 2014. He did a six month internship at UMR HydroScience Montpellier and worked as a research fellow on projet PNTS 2014-1. He is currently working as a consultant for a global asset servicing provider.
M. Chaumont Marc CHAUMONT received his Engineer Diploma in Com-puter Sciences at the INSA of Rennes, France in 1999, his Ph.D. at the IRISA Rennes in 2003, and his HDR (”Habilitation `a Diriger des Recherches”) at the University of Montpellier in 2013. Since September 2005, he is an Assistant Professor in the LIRMM laboratory of Montpellier and the University of Nmes. His research areas are multimedia security (steganography, water-marking, digital forensics, video & image compression) and segmentation & tracking in images and videos. He is member of the TC of IEEE SPS -Information Forensics and Security for the period 2015-2017. He was program chair of ACM IH&MMSec’2013. He is reviewer for more than 20 journals (IEEE TIFS, IS&T JEI, ...) and for more than 10 conferences (EI MWSF, IEEE WIFS, ACM IH&MMSec, IEEE ICIP, ...).
C. Delenne Carole Delenne is a lecturer at the University of Montpellier, France since 2007. She obtained an M.Sc. degree in applied mathematics from the University of Toulouse in 2003 and a PhD in remote sensing from the University of Montpellier in 2006. Her research interests include hydraulic modeling, sensitivity analysis, and remote sensing for the calibration and validation of hydrodynamics models.
G. Subsol Grard Subsol obtained a Ph.D. Thesis in Computer Science in 1995. He was successively Ph.D. student, then Expert-Engineer at INRIA Sophia Antipolis, Research Engineer at University of Avignon and R&D Engineer with the start-up company Intrasense. Since 2006, he has been a CNRS Researcher at LIRMM located in the South of France. He is currently working on several applications of 2D and 3D image processing.
M. Derras Mustapha Derras obtained a Ph.D. Thesis in Computer Science in 1993. He is currently Director of Technology, Innovation and Research of Berger-Levrault. Previously he held positions with the aim of creating innovative new products as Business Unit Director Catia, Dassault Systmes, Marketing and R&D at TIMEG, Director of Business Unit CAT at Cadence Design Systems, software development architect at General Electric Medical Systems and project Manager at CLAAS where he completed his mobile robotics and image processing studies.
regarding underground water networks. Her current research interests include urban hydrology and rainfall-runoff modelling.
![Fig. 5. Shadow elimination from [12] and smoothing using an ICM algorithm. r 2r r 1 R 1 R 2 S 1 3 S 1 1 S 1 5S25S16S26S17S27 S 1 8 S 2 8S21S22S23S14S24S12](https://thumb-eu.123doks.com/thumbv2/123doknet/13624087.425850/4.918.92.435.82.301/fig-shadow-elimination-smoothing-using-icm-algorithm-r.webp)