HAL Id: hal-01295403
https://hal.archives-ouvertes.fr/hal-01295403
Submitted on 30 Mar 2016HAL is a multi-disciplinary open access archive for the deposit and dissemination of sci-entific research documents, whether they are pub-lished or not. The documents may come from teaching and research institutions in France or abroad, or from public or private research centers.
L’archive ouverte pluridisciplinaire HAL, est destinée au dépôt et à la diffusion de documents scientifiques de niveau recherche, publiés ou non, émanant des établissements d’enseignement et de recherche français ou étrangers, des laboratoires publics ou privés.
Identifying, estimating and correcting the biases in
WTO rules on public stocks: a proposal for the
post-Bali food security agenda
Franck Galtier
To cite this version:
Franck Galtier. Identifying, estimating and correcting the biases in WTO rules on public stocks: a proposal for the post-Bali food security agenda. [University works] auto-saisine. 2015, 47 p. �hal-01295403�
WORKING-PAPER – UMR MOISA
_______________________________
WORKING PAPER MOISA 2015-5
Identifying, estimating and correcting the biases
in WTO rules on public stocks.
A proposal for the post-Bali food security agenda
WORKING-PAPER – UMR MOISA
_______________________________
Identifying, estimating and correcting the biases in WTO rules on public
stocks. A proposal for the post-Bali food security agenda
Franck Galtier
CIRAD, UMR MOISA, F-34398 Montpellier, France
galtier@cirad.fr
Novembre 2015
Abstract
In this paper, we analyse the WTO rules that specify how the subsidy provided to farmers by public stocks should be estimated. We identify three biases in these rules:
- Bias B1, resulting from the use of a fixed past unit value of imports or exports as the external reference price, instead of the
current price cost of imports or exports.
- Bias B2, resulting from the use of the public stock procurement price instead of the price prevailing on the domestic market to estimate the price support received by farmers selling their production on the domestic market.
- Bias B3, resulting from the use of total national production instead of the marketed share of national production, thereby ignoring farmers’ self-consumption.
The effect of these three biases on the estimated subsidy varies from country to country, but on average, WTO rules result in the subsidy being overestimated by a factor of between 2 and more than 300, depending on public stock intervention modalities and country characteristics. This means that in the most favourable scenarios, the estimated subsidy is (on average) twice the real subsidy.
These biases have a huge effect on country compliance: many countries have an estimated subsidy that exceeds their maximum allowed level (even with very limited public stock interventions), simply because the subsidy provided by public stocks is overestimated by WTO rules. This result challenges the widespread idea that almost all countries comply with WTO rules on public stocks.
We also test the effect of individually correcting biases B1, B2 and B3. It appears that doing so would not eliminate the bias on country compliance. One implication of this is that expressing the fixed external reference price (FERP) in US dollars, correcting it with the country inflation rate or replacing it by the average unit value of imports or exports over the last five years (as proposed by some experts and WTO Members) would not be enough to remove the bias on country compliance. It is therefore necessary to correct all three biases, which can be achieved in a rather simple manner, as shown at the end of the paper.
Keywords: World Trade Organization, Doha Round, Bali Agreement, Public stock, Subsidy, Domestic support
Identifier, estimer et corriger les biais des règles de l’OMC sur les stocks publics. Une proposition
pour l’agenda post-Bali sur la sécurité alimentaire
Résumé
Dans cet article, nous analysons les règles de l’OMC qui définissent comment estimer la subvention procurée par les stocks publics aux producteurs agricoles. Nous identifions trois biais dans ces règles :
- le biais B1, qui résulte du fait d’utiliser comme prix extérieur de référence la valeur unitaire des importations ou des exportations au cours d’une période fixe passée, au lieu d’utiliser le coût de revient actuel des importations ou des exportations.
WORKING-PAPER – UMR MOISA
_______________________________
- le biais B2, qui résulte du fait d’utiliser le prix d’achat du stock public (au lieu du prix en vigueur sur le marché domestique) pour estimer la subvention reçue par les agriculteurs qui vendent leur production sur le marché domestique.
- le biais B3, qui résulte du fait d’utiliser la production nationale au lieu de la part commercialisée de cette production (ignorant par la même l’autoconsommation des producteurs).
L’effet de ces trois biais sur la subvention estimée diffère selon les pays mais, en moyenne, les règles de l’OMC conduisent à surestimer la subvention d’un facteur 2 à plus de 300, selon les modalités d’intervention des stocks publics et les
caractéristiques des pays. Cela signifie que, dans les scénarios les plus favorables, la subvention estimée représente en moyenne le double de la subvention réelle.
L’effet de ces biais sur la conformité des pays avec leurs engagements à l’OMC se révèle être très important : beaucoup de pays ont une subvention estimée au-dessus du plafond autorisé (même avec des interventions de faible ampleur), simplement parce que la subvention est surestimée par les règles de l’OMC. Ceci remet en cause l’idée très répandue selon laquelle presque tous les pays seraient en règles vis-à-vis de leurs engagements sur les stocks publics et le soutien interne. Nous avons également testé les effets d’une correction partielle des biais B1, B2 et B3. Il s’avère que cette correction partielle ne permet pas d’éliminer le biais sur la conformité des pays avec leurs engagements à l’OMC. Ceci implique notamment qu’exprimer le prix fixe extérieur de référence (FERP) en dollar US, que le corriger par le taux d’inflation du pays ou que le remplacer par la moyenne de la valeur unitaire des importations ou des exportations au cours des cinq années précédentes (comme proposé par différents experts et pays Membres) ne serait pas suffisant pour corriger le bais sur la conformité des pays avec leurs engagements.
Il est donc nécessaire de corriger les trois biais, ce qui peut être fait d’une manière assez simple, comme nous le montrons à la fin de l’article.
Mots-clés : Organisation Mondiale du Commerce, Cycle de Doha, Accord de Bali, Stock public, Subvention, Soutien interne JEL : Q18, Q11, F1
Revised version of a paper presented at the WTO public forum in October 2013 (Geneva, Switzerland)
Acknowledgments and disclaimer
To conduct the analyses presented in this document, we used different types of public data provided by the WTO, the World Bank and FAO (especially the FAOSTAT database).
We also used CEPII data on applied tariffs (MacMap database) and are very grateful to Houssein Guimbard (CEPII) for providing these data. We would also like to thank those who provided data on the marketed share of production (for different types of grain in different countries): Nicolas Bricas and Pauline Martin (CIRAD) for West Africa, and Thom Jayne (Michigan State University) for Eastern and Southern Africa.
We are grateful to Lee-Ann Jackson from the WTO Secretariat, Panos Konandreas (independent consultant), George Mermigkas (economist with the FAO Liaison Office in Geneva), Joseph Rocher (independent consultant), Jonathan Hepburn (ICTSD) and Christophe Bellman (ICTSD) for their insights into the subtleties of WTO rules.
This article benefited from the stimulating comments of Lars Brink. A much earlier version of it benefited from the helpful comments of Philip Abbott, Jacques Berthelot, Ralph Cummings, David Dawe, Christophe Gouël, Sébastien Jean, Tom Lines, Will Martin, Sophia Murphy, Peter Timmer and Steve Wiggins.
We also wish to thank Anna Kiff for proofreading the final manuscript.
The views expressed here are those of the author and do not necessarily reflect the views of the WTO, the World Bank, FAO, CEPII, Michigan State University, ICTSD, CIRAD, UMR MOISA, the French government or the above-mentioned experts and colleagues.
1
INTRODUCTION ... 2
1. WTO DISCIPLINES ON PUBLIC STOCKS... 2
1.1.GENERAL PRINCIPLES ... 2
1.2.DOMESTIC SUPPORT CEILINGS ... 3
1.3.RULES ON HOW THE SUBSIDY PROVIDED BY PUBLIC STOCKS SHOULD BE ESTIMATED ... 4
2. IDENTIFYING THE BIASES IN WTO RULES... 6
2.1.ESTIMATING THE REAL SUBSIDY PROVIDED BY PUBLIC STOCKS ... 6
2.2.IDENTIFYING THE BIASES IN WTO RULES:B1,B2 AND B3 ... 7
3. ESTIMATING THE MAGNITUDE OF THE BIASES IN WTO RULES ... 8
3.1.ESTIMATING THE MAGNITUDE OF BIAS B1 ... 8
3.2.ESTIMATING THE MAGNITUDE OF BIAS B2 ... 10
3.3.ESTIMATING THE MAGNITUDE OF BIAS B3 ... 12
4. ESTIMATING THE EFFECT OF THE BIASES ON THE ESTIMATED SUBSIDY ... 13
4.1.METHODOLOGY ... 13
4.2.RESULTS ... 15
5. ESTIMATING THE EFFECT OF THE BIASES ON COUNTRY COMPLIANCE ... 16
5.1.METHODOLOGY ... 16
5.2.RESULTS ... 18
5.3.THE NEED TO CORRECT THE THREE BIASES ... 20
6. A PROPOSAL OF NEW RULES FOR AN UNBIASED ESTIMATION OF THE SUBSIDY PROVIDED BY PUBLIC STOCKS... 21
6.1.A FORMULA TO ESTIMATE THE SUBSIDY ... 21
6.2.ESTIMATING THE EXTERNAL REFERENCE PRICE PP* ... 21
6.3.THE SPECIFIC CASE OF SELF-SUFFICIENT AND ALMOST SELF-SUFFICIENT COUNTRIES ... 23
CONCLUSION ... 24
REFERENCES ... 25
2
Introduction
WTO rules on public stocks (PS) are part of the Agreement on Agriculture (AoA) that was negotiated during the Uruguay Round of the General Agreement on Tariffs and Trade and entered into force with the establishment of the WTO on 1 January 1995. India and the G33 countries proposed modifications to these rules (Bellman et al., 2013)1, which were consequently debated during the Bali Ministerial Conference in December 2013. However, the Bali conference failed to produce an agreement on this issue: Members simply agreed on a peace clause exempting the already existing public stockholding programmes from legal challenges until a “permanent solution” is found (WTO, 2013; Diaz-Bonilla, 2014). The need to find a permanent solution to the issue of public stockholding for food security purposes was reaffirmed in December 2015 during the Nairobi Ministerial Conference (WTO, 2015a).
The debates on this matter between WTO Members can be organised around two key questions2: Q1. Should the rules on how to estimate the subsidy provided to farmers by public stocks be modified?
Q2. Should the maximum allowed subsidy level be increased, at least for specific countries, commodities and/or situations (safeguard clauses)?
In this article, we analyse the first question, relating to the metrics (the right way to estimate the subsidy provided by PS). We show that current WTO rules generally result in the subsidy provided by public stocks being significantly overestimated, and that this has a huge effect on countries’ compliance with their WTO domestic support commitments.
We will successively present i) WTO disciplines on public stocks, ii) the biases in these rules, iii) the magnitude of these biases, iv) their effect on the estimated subsidy, and v) their effect on country compliance. We will conclude by proposing new rules to estimate the subsidy provided by public stocks as accurately as possible.
1. WTO disciplines on public stocks
1.1. General principles
The AoA established disciplines on “market access” (part III), “domestic support” (part IV) and “export subsidies” (part V) (WTO, 1994). Domestic support measures are classified into two broad categories:
measures that are bounded (Amber Box)
measures that are exempt from any disciplines, because i) they are considered to have “no or at most minimal” distorting effects on trade or production (Annex 2, also referred to as the “Green Box”)3, ii) they are accompanied by production-limiting programmes (Article 6.5 or “Blue Box”), and iii) they concern “investment subsidies which are generally available to agriculture in developing country Members and agricultural input subsidies generally available to low-income or resource-poor producers in developing country Members” (Article 6.2, sometimes called the “Development Box”).
3
Public stocks (PS) are generally classified in the Amber box, but under specific conditions they may be classified in the Green box. These conditions (defined in Annex 2 of the AoA, more specifically in Paragraphs 3 and 4) are as follows: i) PS should be focused on food security, ii) their management should be transparent, iii) food purchases by the government should be made “at current market prices”, and iv) sales from PS should be made “at no less than the current domestic market price”, except if these sales are targeted “to sections of the population in need”, the “eligibility to receive the food aid [being] subject to clearly-defined criteria related to nutritional objectives”.
The practical implication of these conditions is that only some types of PS can be classified in the Green box. Public stocks are usually grouped according to three types, depending on their objective (see for instance Deuss, 2014): i) emergency reserves, which provide free or subsidised food to specific subsets of the population in periods of crisis, ii) social safety net PS, which provide free or subsidised food to specific subsets of the population in normal times (with the goal of addressing chronic malnutrition), and iii) buffer stocks, the purpose of which is to stabilise prices (keeping them above a floor and/or below a ceiling). Buffer stocks are of course excluded from the Green box because they do not meet the third and/or fourth condition (by definition, they purchase and/or sell at administered prices). Social safety net PS are also often excluded from the Green box because purchasing at an administered price is often the only practical way of buying the large quantities required to supply large food distribution systems. It is only for emergency reserves that buying at the market price is an option (this is, for instance, the way the Stock National de Sécurité in each Sahel countries procures grain on its domestic market). When a PS is classified in the Amber box, the subsidy provided by this PS is bounded.
1.2. Domestic support ceilings
When not classified in the Green box, the subsidy provided by PS should be accounted for in the Aggregate Measurement of Support (AMS) of the product in question. An AMS is calculated for each agricultural product that receives some kind of domestic support. A “non-product-specific AMS” is also calculated for support that may benefit several products (such as some kind of insurance subsidy). If a product-specific AMS or non-product-specific AMS is above a certain threshold called de minimis, it is included in the calculation of the Total AMS, which is bounded by the WTO. The de minimis is defined as a percentage of the value of national production of the product in question (for the product-specific AMS) and of total agricultural production (for the non-product-specific AMS). This percentage amounts to 5% for developed countries, 10% for developing countries and 8.5% for China.
The country Total AMS ceiling is determined by the level of the country Total AMS during a reference period called the “base period” in the AoA. The base period depends on the year in which a country became a Member of the WTO: for countries that have been Members since the beginning of the WTO (because they were already Members of the GATT), the base period is 1986-88. Of the 133 WTO Members subject to domestic support disciplines (all WTO Members except the 28 EU Members, because domestic support disciplines are calculated and notified at the EU level), 101 have a base period Total AMS equal to zero. For these countries, the Total AMS ceiling is equal to zero. For the remaining 32 countries, the Total AMS ceiling is their base period Total AMS reduced by 20 % (for
4
developed country Members) or by 13 % (for developing country Members)4. Table 1 in appendix 1 shows country base period, de minimis and Total AMS ceiling.
What are the implications of these rules for the maximum subsidy level countries are allowed to apply to a specific commodity C? For countries with a Total AMS ceiling below their de minimis for C, the maximum allowed subsidy level for C is this de minimis. For countries with a Total AMS ceiling above the de minimis for C, the maximum allowed subsidy level for C depends on the way the country Total AMS ceiling is allocated between C, the other commodities and the non-product-specific AMS: if 0% of the Total AMS ceiling is allocated to C, the maximum allowed subsidy level is the de minimis; if it is 100%, the maximum allowed subsidy level is the Total AMS ceiling (if, for instance, Canada decides to use all of its Total AMS ceiling to support wheat production, it will be able to provide a subsidy equal to 64.98% of the value of its wheat production, which is well above its de minimis level of 5%, see table 1, appendix 1). More generally, if p is the percentage of the country Total AMS ceiling allocated to C, the compliance rule is given by:
AMS(C) ≤ Max [de minimis (C); p Total AMS ceiling] (1)
Note that AMS(C), the AMS for C, encompasses not only the subsidy provided by PS but all types of Amber box domestic supports provided to C. However, in practice, the subsidy provided by PS accounts for the greater part of AMS(C). The key reason for this is that the main types of domestic support used by countries fall within the Green box: this is particularly the case for decoupled direct payments provided by developed countries (which are assumed to be non-distortive) and input subsidies or investment subsidies provided by developing countries (which are exempt from domestic support disciplines in order “to encourage agricultural and rural development”, see WTO, 1994, Article 6.2).
1.3. Rules on how the subsidy provided by public stocks should be estimated
The AoA (especially Annex 3) specifies how the subsidy provided by PS to the producers of a specific commodity should be calculated (WTO, 1994). This subsidy (SWTO) is equal to the product of i) the difference between the PS procurement price (PPROC) and a fixed external reference price (FERP), and ii) the quantity of production eligible (QELIGIBLE):
SWTO = (PPROC – FERP) QELIGIBLE (2)
The fixed external reference price (FERP) “shall generally be the average f.o.b. unit value for the basic agricultural product concerned in a net exporting country and the average c.i.f. unit value for the basic agricultural product concerned in a net importing country in the base period” (Annex 3, Article 9), the base period being 1986-88 for the countries that joined the WTO at the outset. The AoA also specifies that the quantity eligible (QELIGIBLE) is “the quantity of production eligible to receive the applied administered price” (Annex 3, Article 8).
However, several debates emerged among experts and WTO Members regarding the way to interpret these definitions of FERP and QELIGIBLE. The three main debates are the following:
5
DEBATE 1. Should the FERP be expressed in US dollars (USD) or in local currency units (LCU)? According to some interpretations, the FERP should be expressed in LCU, whereas for other experts, countries should be able to choose whether to express the FERP in LCU or in USD. A third interpretation is that countries should use the currency they used in their first notification, when they notified their AMS for the base period (Hoda and Gulati, 2013). Nothing in the AoA helps to choose between these competing interpretations: the AoA does not specify the currency that should be used to express the FERP and is rather ambiguous regarding the role of the methodology used in country notifications for the base period5.
DEBATE 2. Should the FERP be considered as a current price or a real price? If the FERP is considered as a real price, the price of the base period should be corrected using the country inflation rate since the base period. However, the AoA does not support this interpretation because the case for inflation is dealt with in another article of the AoA (Article 18.4), which mentions that “in the review process Members shall give due consideration to the influence of excessive rates of inflation on the ability of any Member to abide by its domestic support commitments”. Although some experts interpreted this as meaning it may give countries the right to update the base period FERP with the domestic inflation rate (Hoda and Gulati, 2013), the dominant view is that this is not the case: Article 18.4 only mentions “excessive rates of inflation” and deals more with considerations to be taken into account when assessing the situation of countries that have been unable to comply with their commitments than with calculating the subsidy itself (WTO, 2014). It seems therefore that the FERP should be considered as a current price.
DEBATE 3. What quantity should be used for QELIGIBLE? Some countries notify total national
production, while others notify only the quantity actually procured by the PS. Another interpretation is that the relevant quantity is the share of production that is marketed (i.e. that is not self-consumed by farmers). This interpretation (proposed, for instance, by Hoda and Gulati, 2007) is supported by the idea that if public stock purchases affect the domestic market price, only marketed quantities will benefit from this (not the share of production that is self-consumed by farmers). Another view is that if the PS authorities gave prior notice of the quantity they wanted to buy, then QELIGIBLE would be this quantity. We therefore have four different interpretations of QELIGIBLE (classified here from the smallest to the largest quantity): the quantity actually procured by the PS, the quantity to be purchased announced by the PS authorities, the marketed share of national production, and total national production6.
These different ways of interpreting the FERP and QELIGIBLE may significantly affect the estimated subsidy and countries’ compliance with their WTO commitments, as shown by Brink (2014a) for the case of rice, wheat, cotton and sugarcane in India, and by Konandreas and Mermigkas (2014) for specific country-commodity pairs.
Does the jurisprudence shed any light on these debates? To our knowledge, the Korea beef case is the only decision on domestic support made by the WTO Appellate Body7: this case is therefore the only one that provides some insights into how to interpret WTO rules on public stocks. The complainants were Australia and the United States. The first decision was made by a three-person panel agreed by all the parties (WTO, 2000a). Korea appealed this decision and the WTO Appellate Body made the final decision (WTO, 2000b). As far as WTO rules on public stocks are concerned, the main discussions centered on the correct way to interpret QELIGIBLE. Korea argued that QELIGIBLE should
6
be the quantity actually procured because this is the quantity for which there is actually money available to pay the PS procurement price (WTO, 2000a, §371). The Panel made it very clear that this interpretation was wrong because what matters is not the actual amount of budgetary outlays (as confirmed by the last sentence of paragraph 8, Annex 3 of the AoA), but the fact that “it is marketable production as a whole which benefits from this type of [price] support” (WTO, 2000a, §832). The Appellate Body confirmed that “production eligible refers to production that is ‘fit or entitled’ to be purchased rather than production that was actually purchased” (WTO, 2000b, §120). It is worth noting that it did not make any mention of the concept of “marketable production” used by the Panel. Finally, the Appellate Body clarified that if the quantity to be procured is announced in advance, this quantity should be considered as the eligible production (WTO, 2000b, §121).
It thus appears that DEBATE 2 does not really reflect any ambiguity in the AoA, as a careful reading of Article 18.4 seems to imply that the FERP is a current price (which should not therefore be corrected by inflation). It also appears that DEBATE 3 has been clarified by the jurisprudence: according to the WTO Appellate Body decision for the Korea beef case, QELIGIBLE should be the total national production, unless the quantity to be procured is announced in advance (in this case, QELIGIBLE is this quantity). Therefore, the main remaining ambiguity relates to the currency countries should use to express the FERP (DEBATE 1). This is why in the remainder of this document we will always consider two interpretations of the rules, one with the FERP expressed in local currency units and one with the FERP expressed in US dollars.
2. Identifying the biases in WTO rules
2.1. Estimating the real subsidy provided by public stocks
Analysing the subsidy provided to farmers by public stocks (PS) means comparing the income received by farmers when these PS intervene on the market (purchases, sales and free distributions) with the income they would have received without these interventions. An obvious effect is that PS purchases provide a direct subsidy to the farmers that supply the PS, providing that the PS procurement price (PPROC) is higher than the price these farmers would have obtained without PS purchases. In addition, public stock procurement may result in an increase in the domestic price and thereby provide a subsidy to the farmers selling their production on the domestic market. Therefore, in order to estimate the subsidy amounts provided by public stocks, it is necessary to take into account the (direct) subsidy S1 received by the farmers who supply the public stock and the (indirect) subsidy S2 received by the farmers who sell some of their production on the domestic market.
PD’ is the price that would have prevailed on the domestic market without PS intervention. If we assume that the quantity sold to the public stocks (QPROC) would have been sold on the domestic market if the public stocks had not purchased, then S1 is given by:
S1 = (PPROC – P’D) QPROC (3)
If QMARKETED is the total quantity sold by farmers (either on the domestic market or to the PS) and PD is the price prevailing on the domestic market (with PS interventions), S2 is given by:
7 We therefore obtain:
S = (PPROC – P’D) QPROC + (PD – P’D) (QMARKETED - QPROC) (5)
In this formula, the value of PD’ is unknown: PD’ cannot be observed because it is not a real price but a counterfactual price (the price that would have prevailed on the domestic market in the counterfactual situation without PS interventions). We must therefore replace PD’ by a proxy. But which proxy? As PS intervention may affect domestic prices, the only option is to use an external reference price (ERP). But which ERP? For importing countries, the domestic price is usually determined by the price cost of imports, or “import parity price” (PM). Similarly, for exporting countries, the domestic price is usually determined by the price cost of exports, or “export parity price” (PX). It appears, therefore, that the best proxy for the domestic price without PS intervention (P’D) is the parity price PP (PM for net importing countries and PX for net exporting countries). By replacing P’D with PP in formula 5, we get:
S = (PPROC – PP) QPROC + (PD – PP) (QMARKETED - QPROC) (6)
The next step is to compare the unbiased estimation of the subsidy provided by formula 6 with the subsidy calculated according to WTO rules (formula 2). This will enable us to identify the biases in WTO rules on PS.
2.2. Identifying the biases in WTO rules: B1, B2 and B3
As we have seen in section 1c, the most orthodox view (confirmed by the jurisprudence) is that QELIGIBLE means “national production” (becoming QPRODUCED). Formula 2 then becomes:
SWTO = (PPROC – FERP) QPRODUCED (7)
This formula implicitly assumes that farmers who do not supply the PS receive the same unitary subsidy as farmers who do. To make this clearer, it is better to separate these two categories of subsidies. The formula then becomes:
SWTO = (PPROC – FERP) QPROC +(PPROC – FERP) (QPRODUCED - QPROC) (8)
The subsidy calculated according to WTO rules (SWTO) can then easily be compared with the unbiased estimation of the subsidy (S) calculated with formula 6. The comparison of these two formulas shows three biases in WTO rules:
Bias B1, resulting from the use of a fixed past unit value of imports or exports as the external reference price (FERP), instead of the current price cost of imports or exports (also called the parity price, PP).
Bias B2, resulting from the use of the procurement price PPROC instead of the price prevailing on the domestic market PD to estimate the price support received by farmers selling their production on the domestic market.
8
Bias B3, resulting from the use of total national production QPRODUCED instead of the marketed share of national production (QMARKETED) to estimate the subsidy received by farmers (thereby ignoring farmers’ self-consumption).
We define the following variables to measure these biases: B1 = FERP / PP
B2 = PPROC /PD
B3 = QPRODUCED /QMARKETED
The subsidy calculated according to WTO rules (SWTO) can then be expressed using B1, B2 and B3: SWTO = (PPROC – PP B1) QPROC + (PD B2-PP B1) (QMARKETED B3 - QPROC) (9)
The next step is to estimate the magnitude of biases B1, B2 and B3.
3. Estimating the magnitude of the biases in WTO rules
3.1. Estimating the magnitude of bias B1
B1 (equal to FERP / PP) expresses the bias produced by using a fixed external reference price FERP instead of the current parity price PP as a reference price. As defined by the WTO Agreement on Agriculture (WTO, 1994), the FERP is the average unit value of exports (for net exporting countries) or imports (for net importing countries) of the commodity concerned during the country base period (1986-88 for most countries, see appendix 1). The current parity price PP expresses the current price cost of exports (for net exporting countries) or imports (for net importing countries). In order to be comparable with the price received by farmers when they sell to the PS (PPROC) or on the domestic market (PD), PP should be expressed as a “producer price equivalent”. This means that, for net exporting countries, the (transfer) cost of moving the commodity from the producing areas to the border should be included in the estimation of PP as well as the (transaction) cost of transferring property rights from farmers to exporters. Therefore, the price cost of exports (or “export parity price” PX) is determined by the current unit value of exports (the price received by exporters for a product delivered to the border of the country) converted into local currency plus export subsidies minus the transfer and transaction cost (TTC) from farmers on rural markets to exporters at the border. Similarly, the price cost of imports (or “import parity price” PM) is equal to the current unit value of imports converted into local currency plus import taxes plus the TTC8.
Therefore, if UVMBP is the unit value of imports during the base period, UVMCURRENT the current unit value of imports, ERBP the exchange rate with the US dollar during the base period, ERCURRENT the current exchange rate with the US dollar, tM theimport tax rate and ttc the TTC expressed as a percentage of the import unit value plus import taxes, for net importing countries, B1 can be expressed by:
9
Similarly, if sX is the export subsidy rate, for net exporting countries, B1 is given by:
B1 = (UVXBP / UVXCURRENT)(ERBP / ERCURRENT) (1 / 1 + sX) (1 /1 - ttc) (11)
Formulas 10 and 11 show that bias B1 can be expressed as the product of four sub-biases:
B1a = UVBP / UVCURRENT, resulting from the use of a past unit value of imports or exports (the one from the base period) instead of the current unit value
B1b = ERBP / ERCURRENT, resulting from the use of a past exchange rate (the one from the base period) instead of the current exchange rate
B1c, resulting from not including taxes or subsidies on imports or exports (B1c = 1 / 1 + tM for importing countries and B1c = 1 / 1 + sX for exporting countries)
B1d, resulting from not including the transport and transaction cost between importers or exporters at the border and farmers on rural markets (for importing countries, B1d = 1 / 1 + ttc and for exporting countries B1d = 1 /1 – ttc).
As we have seen before, whether countries should express the FERP in local currency units (LCU) or in US dollars (USD) is unclear (see section 1c). If the FERP is expressed in USD, ERBP = ERCURRENT = 1 and bias B1b disappears (B1b = 1). In the following sections, we will use both possible definitions of B1: with bias B1b (expressing the fact that the FERP is expressed in LCU) and without bias B1b (expressing the fact that the FERP is expressed in USD). We thus obtain:
B1 = B1a B1b B1c B1d (if the FERP is expressed in LCU) (12)
B1 = B1a B1c B1d (if the FERP is expressed in USD) (13)
In order to estimate B1, we estimated B1a, B1b, B1c and B1d separately. We conducted this analysis for the case of wheat. Our analysis covers 132 of the 133 WTO Members that have domestic support commitments9 (Lichtenstein was not included because this country is not in the FAOSTAT database, which is the one we used for data on country import and export unit values). We conducted the analysis for 2011 (taking 2011 as the year representing the current period): the most recent year available in the FAOSTAT database is 2012, but as the most recent year available in the CEPII database on import taxes (needed to estimate B1c) is 2011, that is the year we chose. We used FAOSTAT data for country import and export unit values (to estimate B1a) and World Bank data for exchanges rates10 (to estimate B1b). To estimate B1c, we used WTO data on export subsidies11 and CEPII data on applied import taxes12. Estimating B1d is more difficult because of the lack of systematic data on transfer and transaction costs. We therefore used the ratio between the wholesale price at the border and the average producer price as a proxy for ttc. More specifically, in order to smooth the potential effect of price fluctuations, we took the Olympic average of this ratio over the last five years as a proxy for ttc. The wholesale price at the border has been approximated by the unit value of exports (for net exporting countries) and by the unit value of imports plus import taxes (for net importing countries)13. For producer prices, we used the data provided by FAOSTAT14. We have been able to estimate B1 for 118 countries (out of 132) with the definition of B1 where the FERP is expressed in US dollars, and for 114 countries with the definition of B1 where the FERP is expressed in local currency units: 14 countries did not import or export in 2011 or during their base period (preventing us from estimating their B1a) and data on exchange rates are missing for four countries (preventing us from estimating their B1b). The estimated values of B1a, B1b, B1c and B1d
10
(by country) are presented in appendix 2, as well as the resulting estimation of B1 (for the two possible definitions of B1: with and without B1b).
B1 varies from country to country, but on average its value is 0.47 (with a standard deviation of 0.21) with the definition of B1 that does not include the exchange rate bias, and 0.29 (with a standard deviation of 0.27) with the definition of B1 that does include the exchange rate bias. The average value of B1 is lower in the second case because, for most countries, the exchange rate with the US dollar has decreased over time (B1b < 1). This means that, on average, the external reference price (ERP) specified by WTO rules only accounts for 47% or 29% of the value of the relevant ERP (the current price cost of imports or exports). This implies that if the current price cost of imports or exports is 100, and if the PS is purchasing at 120, the real unitary subsidy is 20, but the unitary subsidy calculated according to WTO rules is on average 73 (120-47) or 91 (120-29), depending on the definition used for B1. Therefore, when the real price support provided by public stocks is 20%, bias B1 leads to the subsidy provided by public stocks being overestimated by a factor of 3.65 or 4.55 on average.
Table 1 below shows that when the exchange rate bias B1b is not included in B1, the average value for B1 (0.47) mainly reflects the evolution of international wheat prices between 1986-1988 (which is the base period for most countries) and 2011. Table 1 also suggests that for maize and rice, B1 is probably of the same order of magnitude as for wheat (or even lower)15.
Table 1. 1986-1988 grain prices compared to current prices 1986 1987 1988 Average 1986-1988 (1) 2011 2012 2013 Average 2011-2013 (2) (1) / (2) Maize, US 88 76 107 90 292 298 259 283 0.32 Wheat, US, HRW 115 113 145 124 316 313 312 314 0.40 Wheat, US, SRW 118 112 141 124 286 295 277 286 0.43
Rice, Thai, A1.Special 104 154 220 159 459 525 474 486 0.33
Rice, Thailand, 25% 104 191 258 184 506 544 473 508 0.36
Rice, Thailand, 5% 186 215 277 226 543 563 506 537 0.42
Unit: USD/MT
Source: Global Economic Monitor (GEM) Commodities. US Department of Agriculture; World Bank.
3.2. Estimating the magnitude of bias B2
Bias B2 results from the use of the public stock procurement price PPROC instead of the price prevailing on the domestic market PD to estimate the price obtained by farmers selling their production on the domestic market (B2 = PPROC /PD).
B2 therefore depends on the effect of public stock interventions on the domestic price. This effect depends on the modalities of PS interventions, especially the quantity procured (QPROC) and the quantity released (QRELEASED) by the PS on the domestic market. The quantity released (in the form of sales and/or free distributions) may be lower or higher than QPROC, depending on the objectives of
11
the PS: if the objective is to support the domestic price, part of the quantity stored will be exported and will usually give QPROC > QRELEASED; if the objective is to supply safety nets that distribute food to poor households, this may give QPROC = QRELEASED (if the system is 100% supplied by domestic production) or QPROC < QRELEASED (if the system is partly supplied by imports); if the objective is to supply emergency aid in periods of crisis, QPROC may be much higher than QRELEASED in some years and much lower in others. Consequently, the net effect of PS interventions may be the removal of quantities from the domestic market (when QPROC > QRELEASED) or the injection of quantities into the domestic market (when QPROC < QRELEASED). As a result, PS can generate upward or downward pressure on the domestic price.
The effect of public stock interventions on the domestic price also depends on country characteristics, especially the way in which market players react to public stock interventions by adjusting their stocks, their imports and/or their exports. For instance, when the public stock procures grain, market players’ incentive to store is reduced: the current price increases and the price expected for the future decreases (as players expect that the public stock will release significant quantities in the future). Market players are therefore likely to reduce their purchases or to increase their sales: part of the quantity removed from the market by PS procurement (QPROC) is offset by a reduction in private storage. Similarly, the quantity removed from the market by PS procurement may be (partly or fully) offset by an increase in country imports or a decrease in exports.
As a result, the assumption that the procurement price PPROC makes the domestic price PD (which is the implicit assumption behind WTO rules) is not always satisfied: it may also be that PS procurement pushes up the domestic price without allowing it to reach PPROC, or that PS procurement does not affect the domestic price because the quantity procured is low or is offset by an adjustment in imports or exports, for instance. It may even be that the domestic price falls because of PS interventions (because the PS release exceeds the PS procurement).
The magnitude of B2 and of its effect on the estimation of the subsidy provided by PS can be illustrated by the following example. Let us assume that the PS purchases 10% of national production, the remaining 90% being sold on the domestic market. If the procurement price is 30% higher than the parity price PP, the subsidy received by the farmers who supply the PS is 30%. According to WTO rules, all farmers receive this amount of subsidy: the average price support is therefore considered to be 30%. If the domestic price actually increases by 30%, B2 = 1 and the (average) price increase is actually 30%. However, if the domestic price only increases by 15%, B2 = 1.13 and the average price increase is only 16.5% (0.1 x 30% + 0.9 x 15%), meaning that B2 results in the subsidy being overestimated by 81%. If the domestic price does not increase, B2 = 1.3 and the average price increase is only 3% (meaning that B2 results in the subsidy being overestimated by a factor of 10). If the domestic price decreases by 10%, B2 = 1.44 and the average price decreases by 6% (0.1 x 30% - 0.9 x 10%): in this case, WTO rules estimate a 30% subsidy when in reality PS interventions result on average in a 6% tax on farmers.
This example shows that bias B2 may lead to the subsidy provided by PS being significantly overestimated (including in some cases considering that there is a subsidy, when in reality there is a tax).
12
3.3. Estimating the magnitude of bias B3
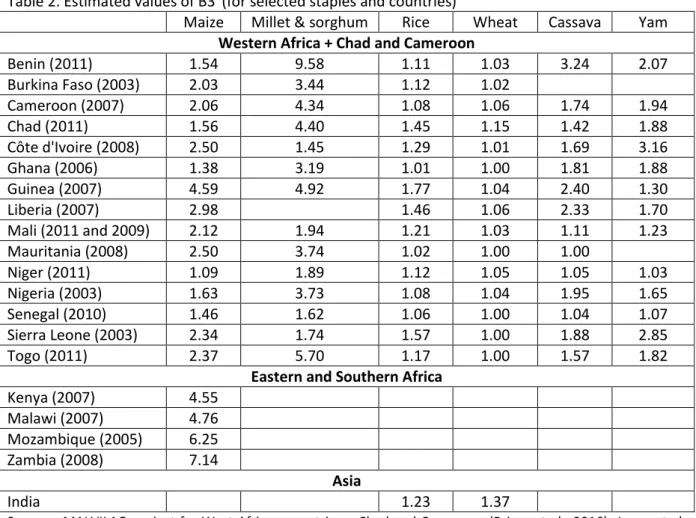
Bias B3 results from the assumption that all national production benefits from the price support provided by PS. The implicit assumption behind WTO rules is that farmers sell all their production (no self-consumption). Obviously, this is often far from the reality in developing countries, especially for grain and other staple food products. No systematic data on the marketed share of production by country and commodity exist. However, we have been able to gather data for specific staples in specific countries, enabling us to estimate B3 for many commodity-country pairs. If δ is the percentage of national production marketed by farmers (δ = QMARKETED / QPRODUCED), then B3 = 1 / δ. Our estimations of B3 are presented in table 2 below.
This table shows that bias B3 varies widely depending on the country and commodity concerned. For rice in India, for example, where it is estimated that 81% of production is marketed, B3 = 1.23. But in the case of maize in Eastern and Southern African countries (where only 14% to 22% of production is marketed), B3 ranges from 4.5 to 7.
Table 2. Estimated values of B3 (for selected staples and countries)
Maize Millet & sorghum Rice Wheat Cassava Yam Western Africa + Chad and Cameroon
Benin (2011) 1.54 9.58 1.11 1.03 3.24 2.07 Burkina Faso (2003) 2.03 3.44 1.12 1.02 Cameroon (2007) 2.06 4.34 1.08 1.06 1.74 1.94 Chad (2011) 1.56 4.40 1.45 1.15 1.42 1.88 Côte d'Ivoire (2008) 2.50 1.45 1.29 1.01 1.69 3.16 Ghana (2006) 1.38 3.19 1.01 1.00 1.81 1.88 Guinea (2007) 4.59 4.92 1.77 1.04 2.40 1.30 Liberia (2007) 2.98 1.46 1.06 2.33 1.70 Mali (2011 and 2009) 2.12 1.94 1.21 1.03 1.11 1.23 Mauritania (2008) 2.50 3.74 1.02 1.00 1.00 Niger (2011) 1.09 1.89 1.12 1.05 1.05 1.03 Nigeria (2003) 1.63 3.73 1.08 1.04 1.95 1.65 Senegal (2010) 1.46 1.62 1.06 1.00 1.04 1.07 Sierra Leone (2003) 2.34 1.74 1.57 1.00 1.88 2.85 Togo (2011) 2.37 5.70 1.17 1.00 1.57 1.82
Eastern and Southern Africa
Kenya (2007) 4.55 Malawi (2007) 4.76 Mozambique (2005) 6.25 Zambia (2008) 7.14 Asia India 1.23 1.37
Sources: MALVILAO project for West African countries + Chad and Cameroon (Bricas et al., 2016); Jayne et al. (2010) for Eastern and Southern African countries, and Blink (2014a) for India.
For Mali, data are from 2011 for grain and from 2009 for roots and tubers.
What are the implications of these B3 values when estimating the subsidy provided by PS? Let us take an example. We consider a country where the PS buys 10% of national production, the remaining 90% being either sold on the domestic market or self-consumed by farmers. We assume
13
that PS procurement generates an increase in the domestic price that becomes equal to the procurement price (therefore B2 = 1: all farmers receive the same subsidy). If 80% of the production is marketed (then B3 = 1.25), 10% is sold to the PS, 70% is sold on the domestic market and 20% is self-consumed by farmers. Bias B3 (ignoring self-consumption) results in wrongly allocating a subsidy to the 20% self-consumed by farmers, thereby overestimating the subsidy by 25% (or by a factor of 1.25). If only 20% of production is marketed (then B3 = 5), 10% is sold to the PS, 10% is sold on the domestic market and 80% is self-consumed by farmers. Bias B3 results in wrongly allocating a subsidy to the 80% self-consumed by farmers, thereby overestimating the subsidy by a factor of 5.
4. Estimating the effect of the biases on the estimated subsidy
4.1. Methodology
Estimating the bias on the subsidy means comparing the value of the unbiased estimation of the subsidy (S, estimated using formula 6) and the value of the subsidy calculated according to WTO rules (SWTO, estimated using formula 7).
As shown by formula 6, the unbiased estimation of the subsidy (S) depends on the modalities of PS intervention: the procurement price PPROC, the procured quantity QPROC and implicitlyQRELEASED because the quantity released by the PS affects the domestic price PD). S also depends on country characteristics, more specifically the marketed share of production and the factors that determine the effect of given PS interventions on the domestic price (these factors are mainly due to the ability of traders to smooth the effect of PS interventions by adjusting their stocks, their imports and/or theirs exports, see section 3b).
In order to estimate the subsidy S, we must therefore build scenarios for PS interventions and country characteristics. The main PS intervention and country characteristics can be captured through the following variables:
α = QPROC / QPRODUCED: quantity procured by the PS expressed as a % of national production
ß = [PPROC - PP] / PP: price support provided to the farmers who supply the PS, expressed as a % of the parity price PP
γ = [PD -PP] / [PPROC - PP]: increase in the domestic price PD, expressed as a % of the price support provided to the farmers who supply the PS
δ = QMARKETED / QPRODUCED: % of national production that is marketed by farmers
S can thus be expressed as a combination of α, ß, γ, δ, the current parity price PP and the quantity produced QPRODUCED:
S = α QPRODUCED PP ß + (δ-α) QPRODUCED PP ß γ (14)
In order to assess country compliance, S must be compared with the country de minimis (see section 1b). As the de minimis is a percentage of the production value of the commodity concerned (10% for
14
developing countries, 5% for developed countries, and 8.5% for China), it is convenient to express S directly as a percentage of the production value (which is equal to QPRODUCED PD). We thus obtain:
s = ß [α + (δ - α) γ] / [1 +ß γ] (15)
As shown by formula 7, the subsidy calculated according to WTO rules (SWTO) depends on the PS
procurement price (PPROC), national production (QPRODUCED) and the unit value of imports or exports during a past period called the “base period” (FERP).Using the FERP instead of the current parity price PP is precisely what generates bias B1 (FERP = PP B1). Note that SWTO does not depend on the procured quantity QPROC and the domesticprice PD (neglecting these two variables is precisely what generates bias B2). Note also that SWTO does not depend on the percentage of production that is marketed (neglecting this variable is precisely what generates bias B3). The subsidy calculated according to WTO rules can therefore be expressed with ß, the quantity produced QPRODUCED, the current parity price PP and B1:
SWTO = QPRODUCED [(1 + ß) PP - PP B1] (16)
Expressed as a percentage of the value of national production, the subsidy calculated according to WTO rules is given by:
sWTO = [1 + ß – B1] / [1 +ß γ] (17)
The bias in the estimation of the subsidy is defined by BS = sWTO / s. We thus obtain:
BS= [1 + ß - B1] / ß [α + (δ - α) γ] (18)
In order to capture the whole range of possible modalities for PS interventions, we chose to include a low and a high value for QPROC and PPROC. We consider that the PS buys 2% or 20% of national production and that the price paid by the PS exceeds the parity price by 10% or 50%. We thus obtain: α = 2% or 20% (α being the percentage of national production procured by the PS)
ß = 10% or 50% (ß being the price support provided to the farmers who supply the PS)
For the effect of PS interventions on the domestic price PD, we consider 3 cases: PD may i) increase by the price support provided to the farmers who supply the PS, ii) increase by half of this price support, or iii) not increase at all. We thus obtain:
γ = 100%, 50% or 0% (γ being the percentage of transmission to the domestic price of the price support provided to the farmers who supply the PS)
Regarding the percentage of national production that is marketed, we consider two values: 100% and 80%. These values may appear highly conservative since this percentage may be much lower for some country-commodity pairs (as is the case for maize in Eastern and Southern African countries, see section 3c). However, these values seem adequate for the case of wheat, which is probably the least self-consumed grain. We thus obtain:
15
With these scenarios for α, ß, γ and δ and the values for B1 estimated in section 3a (for the case of wheat), we can estimate the unbiased subsidy s (using formula 15) and the subsidy sWTO calculated according to WTO rules (using formula 17). The bias in the estimation of the subsidy provided by PS is then given by BS with BS = sWTO / s (formula 18).
4.2. Results
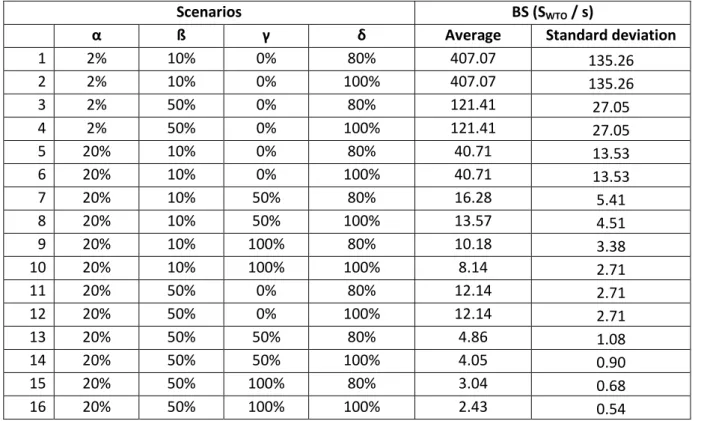
As B1 is different for each country, for a given scenario and a given definition of B1, BS is different for each country. Tables 3 and 4 below present the average and standard deviation of BS for each scenario.
The bias in the estimation of the subsidy (BS) varies widely depending on the scenario concerned. BS ranges from 2.43 to more than 407 (when B1 includes the exchange rate bias) and from 2.06 to more than 314 (when B1 does not include the exchange rate bias).
This means that in the most favourable scenarios, WTO rules overestimate the subsidy provided by PS by a factor of 2 on average (the subsidy calculated according to WTO rules is twice the unbiased estimation of the subsidy). The bias on the subsidy can be much higher: in some scenarios, the subsidy calculated according to WTO rules is more than 300 or 400 times the unbiased estimation of the subsidy.
Table 3: Bias in the estimation of the subsidy provided by PS (case where B1 includes the exchange rate bias)
Scenarios BS (SWTO / s)
α ß γ δ Average Standard deviation
1 2% 10% 0% 80% 407.07 135.26 2 2% 10% 0% 100% 407.07 135.26 3 2% 50% 0% 80% 121.41 27.05 4 2% 50% 0% 100% 121.41 27.05 5 20% 10% 0% 80% 40.71 13.53 6 20% 10% 0% 100% 40.71 13.53 7 20% 10% 50% 80% 16.28 5.41 8 20% 10% 50% 100% 13.57 4.51 9 20% 10% 100% 80% 10.18 3.38 10 20% 10% 100% 100% 8.14 2.71 11 20% 50% 0% 80% 12.14 2.71 12 20% 50% 0% 100% 12.14 2.71 13 20% 50% 50% 80% 4.86 1.08 14 20% 50% 50% 100% 4.05 0.90 15 20% 50% 100% 80% 3.04 0.68 16 20% 50% 100% 100% 2.43 0.54
16
Table 4: Bias in the estimation of the subsidy provided by PS (case where B1 does not include the exchange rate bias)
Scenarios BS (SWTO / s)
α ß γ δ Average Standard deviation
1 2% 10% 0% 80% 314.33 105.27 2 2% 10% 0% 100% 314.33 105.27 3 2% 50% 0% 80% 102.87 21.05 4 2% 50% 0% 100% 102.87 21.05 5 20% 10% 0% 80% 31.43 10.53 6 20% 10% 0% 100% 31.43 10.53 7 20% 10% 50% 80% 12.57 4.21 8 20% 10% 50% 100% 10.48 3.51 9 20% 10% 100% 80% 7.86 2.63 10 20% 10% 100% 100% 6.29 2.11 11 20% 50% 0% 80% 10.29 2.11 12 20% 50% 0% 100% 10.29 2.11 13 20% 50% 50% 80% 4.11 0.84 14 20% 50% 50% 100% 3.43 0.70 15 20% 50% 100% 80% 2.57 0.53 16 20% 50% 100% 100% 2.06 0.42
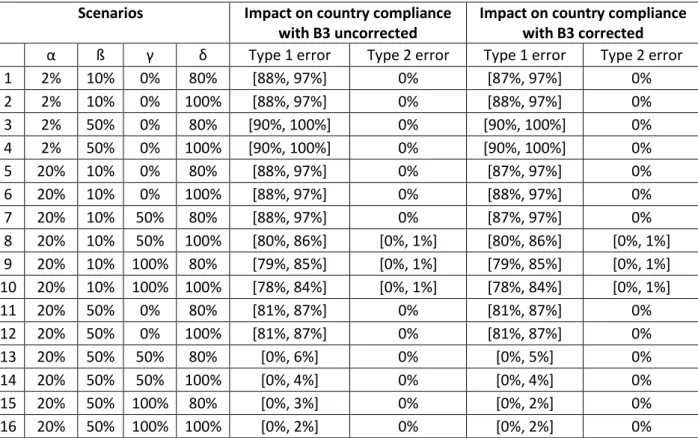
5. Estimating the effect of the biases on country compliance
5.1. Methodology
In order to estimate the impact of biases B1, B2 and B3 on country compliance, we must compare the compliance estimated i) with the unbiased estimation of the subsidy (s) and ii) with the subsidy calculated according to WTO rules (sWTO). For a specific country, a specific scenario and a specific definition of B1 (including or excluding the exchange rate bias), we have four possible situations (see table 5):
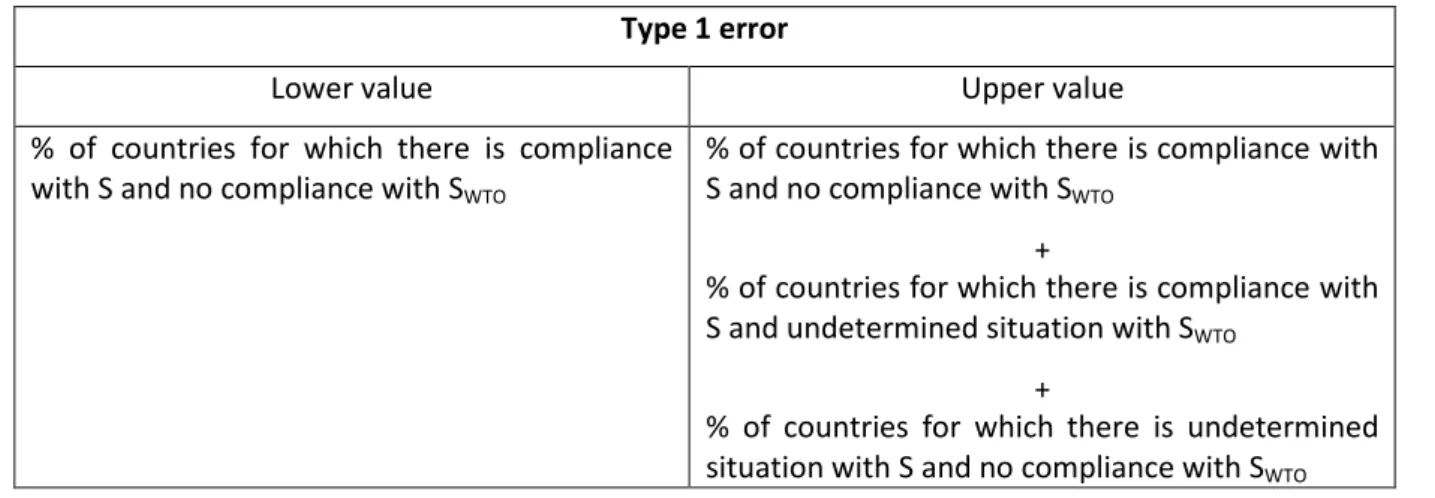
Table 5. Possible effects of biases in WTO rules on compliance: definition of the two types of error
Compliance when using S (the unbiased estimation of the subsidy)
Yes No
Compliance when using SWTO (the subsidy calculated according to WTO rules)
Yes No effect on
compliance
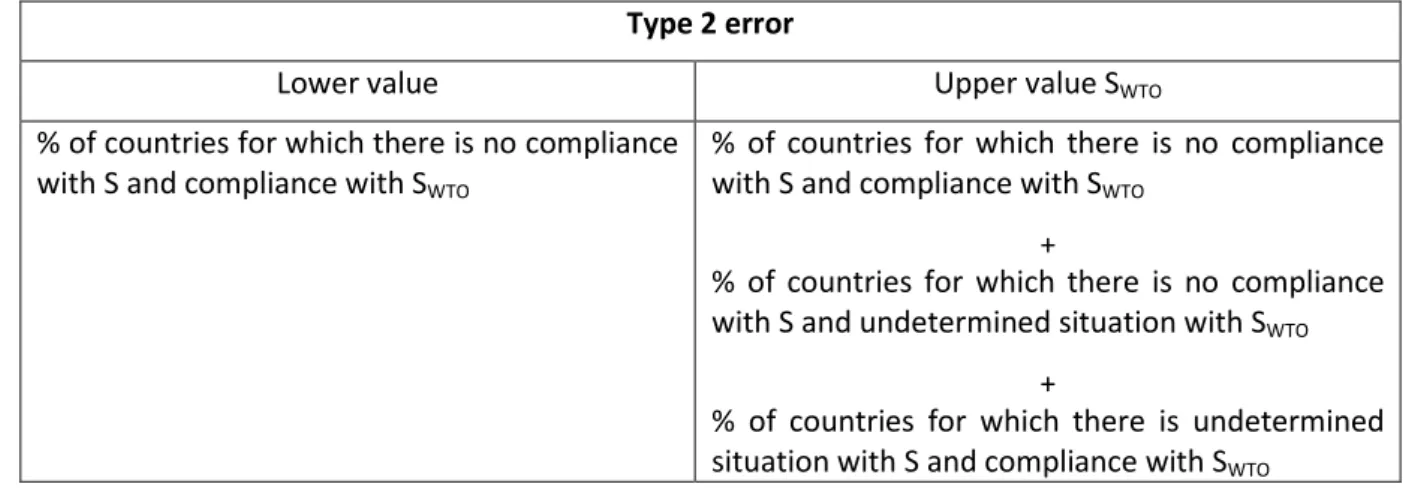
[TYPE 2 ERROR]
No [TYPE 1 ERROR] No effect on
17 We therefore have two types of error:
Type 1 error: considering that a country is not complying when it would be complying with an unbiased estimation of the subsidy
Type 2 error: considering that a country is complying when it would not be complying with an unbiased estimation of the subsidy
The compliance of a country with its domestic support commitments is determined by formula 1 presented in section 1b: the country AMS for the commodity concerned should remain below the maximum of two values: i) its de minimis for the commodity concerned, and ii) the share of its Total AMS ceiling that is allocated to the commodity concerned:
AMS(C) ≤ Max [de minimis (C); p Total AMS ceiling] (1)
In order to assess the compliance of a country that provides an estimated subsidy ES to commodity C (ES is equal to s or sWTO), we therefore define two criteria, a compliance criterion and a “no compliance” criterion:
Compliance criterion: If ES ≤ country de minimis (C), there is compliance.
No compliance criterion: If ES > max (country de minimis (C); country Total AMS ceiling), there is no compliance
For countries with a Total AMS ceiling below their de minimis for C, we will always be able to determine whether there is compliance or no compliance because the estimated subsidy will always be either ≤ or > the de minimis for C. For countries with a Total AMS ceiling higher than their de minimis for C, things are a bit more complicated because we have three possible situations: i) compliance (when ES ≤ de minimis), ii) no compliance (when ES > de minimis and ES > Total AMS ceiling), and iii) undetermined (when ES > country de minimis and ES ≤ Total AMS ceiling). In the last case, the compliance is undetermined because it depends on the (unknown) percentage of the country Total AMS ceiling that is allocated to C. We can therefore define a lower value and an upper value for the type 1 error and type 2 error (see table 6).
Table 6. Definition of a lower value and an upper value for type 1 error and type 2 error
Type 1 error
Lower value Upper value
% of countries for which there is compliance with S and no compliance with SWTO
% of countries for which there is compliance with S and no compliance with SWTO
+
% of countries for which there is compliance with S and undetermined situation with SWTO
+
% of countries for which there is undetermined situation with S and no compliance with SWTO
18 Type 2 error
Lower value Upper value SWTO
% of countries for which there is no compliance with S and compliance with SWTO
% of countries for which there is no compliance with S and compliance with SWTO
+
% of countries for which there is no compliance with S and undetermined situation with SWTO
+
% of countries for which there is undetermined situation with S and compliance with SWTO
5.2. Results
To estimate the effect of biases B1, B2 and B3 on compliance, we need data on country B1, country de minimis and country value of wheat production. The availability of these data enables us to estimate the effect on compliance for 101 countries (when B1 includes the exchange rate bias) and 105 countries (when B1 does not include the exchange rate bias) of the 133 WTO members with domestic support commitments. Of these 101 or 105 countries, 18 have a Total AMS ceiling higher than their de minimis for wheat, meaning that situations where compliance is undetermined (see section 5a) can only occur for 18 countries out of 101 or 105. The results are presented in tables 7 and 8 below.
Table 7. Impact of biases in WTO rules on country compliance (case where B1 includes the exchange rate bias)
Scenarios Compliance rates Impact on country compliance
α ß γ δ with s with sWTO Type 1 error Type 2 error
1 2% 10% 0% 80% 100% [3%, 12%] [88%, 97%] 0% 2 2% 10% 0% 100% 100% [3%, 12%] [88%, 97%] 0% 3 2% 50% 0% 80% 100% [0%, 10%] [90%, 100%] 0% 4 2% 50% 0% 100% 100% [0%, 10%] [90%, 100%] 0% 5 20% 10% 0% 80% 100% [3%, 12%] [88%, 97%] 0% 6 20% 10% 0% 100% 100% [3%, 12%] [88%, 97%] 0% 7 20% 10% 50% 80% 100% [3%, 12%] [88%, 97%] 0% 8 20% 10% 50% 100% [85%, 95%] [3%, 12%] [80%, 86%] [0%, 2%] 9 20% 10% 100% 80% [85%, 94%] [3%, 12%] [80%, 85%] [0%, 2%] 10 20% 10% 100% 100% [84%, 93%] [3%, 12%] [79%, 84%] [0%, 2%] 11 20% 50% 0% 80% [84%, 93%] [0%, 10%] [80%, 86%] 0% 12 20% 50% 0% 100% [84%, 93%] [0%, 10%] [80%, 86%] 0% 13 20% 50% 50% 80% [0%, 15%] [0%, 11%] [0%, 5%] 0% 14 20% 50% 50% 100% [0%, 13%] [0%, 11%] [0%, 3%] 0% 15 20% 50% 100% 80% [0%, 13%] [0%, 11%] [0%, 3%] 0% 16 20% 50% 100% 100% [0%, 12%] [0%, 11%] [0%, 2%] 0%
19
Table 8. Impact of biases in WTO rules on country compliance (case where B1 does not include the exchange rate bias)
Scenarios Compliance rates Impact on country compliance
α ß γ δ with s with sWTO Type 1 error Type 2 error
1 2% 10% 0% 80% 100% [3%, 12%] [88%, 97%] 0% 2 2% 10% 0% 100% 100% [3%, 12%] [88%, 97%] 0% 3 2% 50% 0% 80% 100% [0%, 10%] [90%, 100%] 0% 4 2% 50% 0% 100% 100% [0%, 10%] [90%, 100%] 0% 5 20% 10% 0% 80% 100% [3%, 12%] [88%, 97%] 0% 6 20% 10% 0% 100% 100% [3%, 12%] [88%, 97%] 0% 7 20% 10% 50% 80% 100% [3%, 12%] [88%, 97%] 0% 8 20% 10% 50% 100% [85%, 95%] [3%, 12%] [80%, 86%] [0%, 1%] 9 20% 10% 100% 80% [85%, 94%] [3%, 13%] [79%, 85%] [0%, 1%] 10 20% 10% 100% 100% [84%, 93%] [3%, 13%] [78%, 84%] [0%, 1%] 11 20% 50% 0% 80% [84%, 93%] [0%, 10%] [81%, 87%] 0% 12 20% 50% 0% 100% [84%, 93%] [0%, 10%] [81%, 87%] 0% 13 20% 50% 50% 80% [0%, 15%] [0%, 10%] [0%, 6%] 0% 14 20% 50% 50% 100% [0%, 13%] [0%, 10%] [0%, 4%] 0% 15 20% 50% 100% 80% [0%, 13%] [0%, 10%] [0%, 3%] 0% 16 20% 50% 100% 100% [0%, 12%] [0%, 10%] [0%, 2%] 0%
The frequency of type 1 errors is very high, whatever the definition of B1: they affect more than 78% of countries in 12 scenarios out of 16 (the remaining 4 scenarios correspond to situations in which the real subsidy provided by PS is huge, resulting in low compliance rates, even with the unbiased estimation of the subsidy s).
The frequency of type 2 errors is low (it ranges from 0% to 2%), even in the scenarios where the compliance rate with the real subsidy s is low.
These results challenge the widespread idea that almost all countries comply with WTO rules on PS16: even in situations with very low PS interventions, many countries may be “in the red” because of the biases in WTO rules. For instance, when the PS purchases only 2% of national production at a price only 10% higher than the current parity price, the real subsidy provided accounts for only 0.2% of the value of national production, which is far below the country de minimis (10% of the value of production for developing countries, 5% for developed countries and 8.5% for China). However, more than 88% of the countries are exposed to legal challenge if the subsidy is estimated according to WTO rules (see scenarios 1 and 2 in tables 7 and 8).
Another interesting result is that the effect of biases B1, B2 and B3 on country compliance is almost the same with the two definitions of B1 (the one with the FERP expressed in the local currency unit and the one with the FERP expressed in US dollars, compare tables 7 and 8). Therefore, the idea that allowing countries to express the FERP in US dollars would be sufficient to correct the bias on country compliance is challenged: it is true that this would help to reduce the bias on the estimated subsidy (see tables 3 and 4), but this reduction would not be enough to have a significant effect on country
20
compliance. This is a pity because it means that clarifying the rules is not enough: in order to remove the bias on country compliance, the rules need to be changed.
Is it necessary to fully correct the three biases B1, B2 and B3? Can we eliminate the effect on country compliance by modifying only some biases or by correcting them only partially? Given the difficulties experienced when attempting to change the rules, it is worth exploring this question.
5.3. The need to correct the three biases
We simulated the effect on country compliance of separately correcting biases B1, B2 and B3. As B1 and B2 proved to be the most important biases, we also simulated the effect of correcting both B1 and B2. The formulas used are presented in appendix 3 and the detailed results are given in appendixes 4, 5, 6, 7 and 8.
We first simulated the effect of partially correcting B1 by taking the current unit value (of exports for net exporting countries and of imports for net importing countries) instead of the unit value of the base period as a reference price. This means correcting B1a and B1b, but not B1c and B1d. The results show that this would eliminate type 1 errors for exporting countries in some scenarios (see tables A and B in appendix 4). However, it would not resolve the problem for either importing countries or exporting countries in the others scenarios. Moreover, it would generate a bias in favour of country compliance (type 2 errors) for some exporting countries in some scenarios.
We then simulated the effect of completely correcting B1 (which implies including i) taxes or subsidies on imports or exports, and ii) transfer and transaction costs between rural markets and the border in the calculation of the reference price). However, doing this is not enough, as type 1 errors remained unchanged in some scenarios (see appendix 5). These scenarios are mainly those in which B2 is high, demonstrating the need to correct bias B2.
Correcting B2 alone is also insufficient to eliminate the bias on country compliance: the frequency of type 1 errors remains higher than 76% for 8 scenarios out of 16 (see appendix 6).
Correcting B3 alone would not have a significant effect on country compliance (see appendix 7). Correcting both B1 and B2 would completely eliminate the biases on country compliance in most scenarios, but not all (see appendix 8). Biases on compliance remain significant in some scenarios, especially those where the real subsidy is close to the compliance threshold of many countries (this is the case for scenario 7). Moreover, it should be remembered that our scenarios for B3 (B3 = 1 or B3 = 1.25) are highly conservative: although these values may be realistic for wheat, B3 may be much higher for other grains (for maize in Eastern and Southern Africa, B3 is higher than 4.5, see section 3c). These remarks show that it is also necessary to correct bias B3.
21
6. A proposal of new rules for an unbiased estimation of the subsidy provided
by public stocks
6.1. A formula to estimate the subsidy
Formula 6 presented in section 2.1 gives an unbiased estimation of the subsidy provided by PS. However, this formula cannot be used by the WTO because it uses the parity price PP, which is only known at the end of the year (PP depends on the average unit value of imports or exports during the year). In order to enable countries to choose the parameters of PS interventions (especially PPROC) with satisfactory knowledge of the subsidy they will generate, countries need prior knowledge of the external reference price (ERP) that will be used in the calculation. The ERP therefore cannot be PP: it should be a predictor variable of PP. This predictor variable (now PP*) should be based on a combination of past unit values of imports or exports. The formula to estimate the subsidy thus becomes:
S = (PPROC – PP*) QPROC + (PD – PP*) (QMARKETED - QPROC) (19)
This formula shows that in order to estimate S, we need to know the value of the procurement price PPROC, the quantity procured QPROC, the price prevailing on the domestic market PD, the marketed share of production QMARKETED and PP*. PPROC andQPROC are theoretically public data (which should be notified by countries to the WTO). PD can be observed: it is the average producer price calculated as the annual average of the prices collected on rural markets (the main points of sale for farmers). This data is already used in country notifications to calculate the value of production (and therefore the de minimis). QMARKETED is the shareof production sold by farmers. It is usually estimated by applying a ratio δ to the estimated production (δ is estimated with household survey data). The main problem is therefore to estimate PP*.
6.2. Estimating the external reference price PP*
PP* is a predictor variable of the average price cost of imports or exports during year Y. PP* is therefore equal to a predictor variable UV* of the unit value of imports (for net importing countries) and of exports (for net exporting countries) during year Y, corrected by i) the import tax rate tM (for net importing countries) or the export subsidy rate sX (for net exporting countries), and ii) the transfer and transaction costs between country rural markets and the international market (TTC). In order to estimate PP*, we therefore need to estimate TTC and UV*.
Let us begin with TTC. Transfer costs refer to the costs incurred when moving the product from one locality to another one (transport, handling, illicit taxes on the road, etc.). Transaction costs refer to the costs incurred when transferring property rights for the product (the costs of finding potential trade partners, negotiating with them, monitoring quality, reaching agreements, enforcing contracts, etc.). Including the transfer and transaction costs in the estimation of PP* is necessary in order to convert the price received by exporters or paid by importers (for a commodity delivered at the border) into a producer price equivalent (comparable to the price received by farmers on rural markets).