HAL Id: tel-02794044
https://hal.inrae.fr/tel-02794044
Submitted on 5 Jun 2020
HAL is a multi-disciplinary open access
archive for the deposit and dissemination of sci-entific research documents, whether they are pub-lished or not. The documents may come from teaching and research institutions in France or abroad, or from public or private research centers.
L’archive ouverte pluridisciplinaire HAL, est destinée au dépôt et à la diffusion de documents scientifiques de niveau recherche, publiés ou non, émanant des établissements d’enseignement et de recherche français ou étrangers, des laboratoires publics ou privés.
analyse institutionnelle de l’économie hévéicole au sud
de la Thaïlande
Chaiya Kongmanee
To cite this version:
Chaiya Kongmanee. Dépendance au sentier et changement agraire : une analyse institutionnelle de l’économie hévéicole au sud de la Thaïlande. Sciences de l’Homme et Société. 2015. Français. �tel-02794044�
Délivré par Montpellier SupAgro
Préparée au sein de l’école doctorale d’Economie et
Gestion de Montpellier (EDEG)
Et de l’unité de recherche UMR 1110 MOISA
Laboratoire d’accueil: UPR 34 Systèmes de Pérennes
(CIRAD)
Spécialité : Sciences Economiques
Présentée par Chaiya KONGMANEE
Soutenue le 17 Décembre 2015 devant le jury composé de M. Denis. REQUIER-DESJARDINS, Professeur émérite,
Institut d'Etudes Politiques de Toulouse (Sciencespo-Toulouse)
Rapporteur
Mme. Aree WIBOONPONGSE, Professeur émérite, ChaingMai University
Rapporteur M. Pisan LAOSUWAN, Professeur, Hatyai University Examinateur M. Pasquale LUBELLO, Maitre de conférence,
Montpellier SupAgro
Examinateur M. Robin BOURGEOIS, Chercheur, CIRAD Examinateur M. Buncha SOMBOONSUKE, Professeur, Prince of
Songkla University
Co-encadrant de thèse Mme. Betty WAMPFLER, Professeur, Montpellier
SupAgro
Directeur de thèse
Dépendance au sentier et changement
agraire : une analyse institutionnelle de
l’économie hévéicole au sud de la
Tha
ïlande
[Tapez une citation prise dans le document ou la synthèse d'un passage intéressant. Vous pouvez placer la zone de texte n'importe où dans le document. Utilisez l'onglet Outils de zone de texte pour modifier la mise en forme de la zone de texte de la citation.]
Dépendance de sentier et changement agraire:
une analyse institutionnelle de l’économie hévéicole au sud de la Thaïlande Résumé :
La filière hévéa contribue de manière significative à la subsistance et au développement socio-économique de la Thaïlande avec plus de 1.17 millions de familles de planteurs produisant du caoutchouc naturel. Cette contribution de l’hévéaculture à la croissance économique et à la subsistance en milieu rural a souvent été étudiée. Pourtant, l’évolution des exploitations hévéicoles sur une longue période et ses déterminants sont peu documentés alors qu’ils affectent l’avenir de la filière.
Cette thèse a pour objectif de présenter et donner du sens aux dynamiques de changement agraire au sud de la Thaïlande où l’hévéa est une culture dominante. Elle vise à fournir des éléments aux décideurs politiques pour réfléchir aux orientations futures de l’économie hévéicole thaïlandaise. Mobilisant les concepts de trajectoire d’exploitation et de dépendance au sentier, elle utilise un cadre conceptuel basé sur l’économie institutionnelle pour analyser le changement agraire. L’hypothèse principale est que la coévolution de l’accès au foncier et des contrats de travail sont les déterminants clés du changement agraire à l’œuvre dans l’économie hévéicole.
J’ai appliqué une analyse statistique multivariée et une classification systématique pour caractériser les trajectoires de 220 exploitations hévéicoles au sud de la Thailand. J’ai également analysé l’évolution des contrats de métayage pour la saignée des hévéas à travers des entretiens individuels, des enquêtes et une revue de la littérature. Un cadre d’analyse basé sur la dépendance au sentier a ensuite été appliqué pour identifier et caractériser la manière dont les institutions et leur reproduction ont influencé les trajectoires observées et les contrats de métayage pour la saignée des hévéas.
J’ai identifié six principales trajectoires de transformation des exploitations entre 1990 et 2010. Deux trajectoires montrent un déclin de la surface des exploitations et/ou du recours à de la main d’œuvre rémunérée dans les exploitations de taille moyenne (10.5%) et dans les petites exploitations (25%). Trois trajectoires montrent un accroissement de la surface et/ou du recours à de la main d’œuvre rémunérée. Elles concernent des entreprises familiales agricoles de taille moyenne (14.5%), de grandes entreprises familiales agricoles (4.1%) et des exploitations qui évoluent vers des entreprises patronales (7.7%). Ces deux grands groupes de trajectoires opposées témoignent d’une polarisation croissante des exploitations hévéicoles. 38.2% des exploitations suivent une trajectoire de stabilité caractérisée par l’absence de changement dans la taille des exploitations et dans la structure du travail. Cependant, ce sont de petites exploitations qui risquent de suivre une trajectoire de déclin.
La disponibilité en travail et les contrats de métayage pour la saignée ont évolué au cours du temps mais le métayage est le principal, quasiment l’unique, contrat de travail pour la récolte du latex depuis que l’hévéaculture a commencé en Thaïlande. Les conventions contractuelles de travail pour la saignée sont dans une situation de verrouillage institutionnel sous la forme actuelle des contrats de métayage pratiquée du fait de mécanismes d’auto-renforcement, de fonctionnement et de légitimation. J’ai identifié un ensemble de règles qui peuvent expliquer la prédominance des contrats de métayage pour la saignée en permettant de mobiliser la force de travail disponible et en assurant une grande résilience face aux variations et incertitudes des conditions sociales et économiques.
La dépendance au sentier permet d’interpréter la polarisation des exploitations et le verrouillage institutionnel des contrats de métayage comme le résultat d’un processus d’auto renforcement conduisant à une reproduction institutionnelle. La thèse montre que la période de contrôle de la production du caoutchouc naturel entre 1934 et 1946 est un point critique à l’origine d’une expansion importante des nouvelles plantations et d’un cadre institutionnel qui a favorisé la polarisation qui s’est reproduite seule jusqu’à présent par le mécanisme d’auto renforcement. La polarisation du foncier a un effet positif sur la stabilisation des contrats de métayage pour la saignée. De plus, du fait de la polarisation, les exploitations en expansion emploient davantage de main d’œuvre rémunérée pour la saignée induisant une demande croissante alors qu’une offre croissante de saigneurs qualifiés est apportée par les petites exploitations sur le déclin. Les contrats de métayage pour la saignée actuellement mis en œuvre assurent la disponibilité de main d’œuvre rémunérée et renforce simultanément la concentration foncière.
Basés sur les résultats de l’analyse du changement agraire, trois scénarios de politique sont proposés pour mettre en évidence l’avenir possible de la filière hévéa. Ces scenarios sont: i) poursuivre la politique actuelle, ii) inverser le processus de polarisation et iii) faire face aux contraintes globales. Le scénario politique visant à inverser le processus de polarisation est mis en relief comme une option pour les décideurs compte tenu de ses conséquences sur la croissance économique, le bien-être social et la durabilité du développement agricole de la filière hévéa.
Mots clés: trajectoire d’exploitation, métayage pour la saignée, polarisation, dépendance au sentier, scénario politique, filière hévéa, Thaïlande
Path dependence of agrarian change:
an institutional economic analysis of the rubber economy in Southern Thailand Abstract:
The rubber sector significantly contributes to livelihood and socio-economic development in Thailand with over 1.17 million households depending on rubber production. Rubber sector’s contribution to economic growth and rural livelihood in Thailand has been frequently studied. Yet the evolution of rubber farms over time and its drivers are less documented, though they will affect the future of the rubber sector.
This Ph.D. work aims at exposing, and giving sense to the dynamics of agrarian change in Southern Thailand where rubber is a major crop. It intends to provide elements for decision makers to reflect on the future directions of the Thai rubber economy. Using both concepts of farm trajectory and path dependence, it intends to use a conceptual framework based on institutional economics for analyzing agrarian change. The main hypothesis is that co-evolutions of access to land and labor relationships are the key drivers of agrarian change taking place in rubber economy.
I applied a sequence of multivariate analysis and systematic clustering to characterize the trajectories of 220 rubber farms in Southern Thailand. I also analyzed the evolution of share-tapping arrangements though personal interviews, survey and literature review. A path dependence analytical framework was then applied to identify and characterize how institutional settings and institutional reproduction shaped the observed trajectories and share-tapping arrangements.
I identify six significant farm transformation trajectories between 1990 and 2010. Two trajectories show a decline in landholding and/or hired labor related to medium farms (10.5%) and small farms (25%). Three trajectories show growing landholding size and/or use of hired labor. They concern growing medium family farm enterprise (14.5%), large family farm enterprise (4.1%) and farms moving towards patronal enterprise (7.7%). These opposing trajectories witness a continuing polarization of rubber farms. 38.2% of farms follow a trajectory of stability with no change in farm size and labor structure. However, these are small farms and present a risk to follow the trajectories of farm decline.
Labor availability and share-tapping arrangements evolved over time but share-tapping remains the main, almost unique, labor contract for harvesting since the beginning of rubber cultivation in Thailand. Labor contracting arrangements are in an institutional lock-in situation under the current form of share-tapping through three self-reinforcing economic, functional and legitimating mechanisms. I identified a set of rules that could explain the prevalence of the
share-tapping arrangement in pursuing the exploitation of available labor force and ensuring high resilience to variations and uncertainty in social and economic conditions.
Path dependence explains farm polarization and the institutional lock-in of share-tapping as the results of self-reinforcement mechanisms leading to institutional reproduction. The thesis shows that the period of rubber control during 1934-1946 was a critical juncture resulting in large expansion of new plantings and an institutional setting favoring polarization that has reproduced itself through self-reinforcing mechanisms until now. Land polarization had a positive effect on the stability of share-tapping contracts. In addition, due to polarization, farms with growing landholding employ more hired labor, inducing an increasing demand while an increasing supply of skilled tappers is provided by declining small farms. The current share-tapping arrangements ensure the availability of paid labor and simultaneously reinforce land concentration.
Based on the results of this analysis of agrarian change, three alternative policy scenarios are proposed to highlight the possible future of the rubber economy. These scenarios are: continuation of present policies, reverting polarization and coping with global constraints. The policy scenario of reverting polarization is suggested as an option considering its consequences on economic growth, social welfare and sustainable agricultural development in the rubber sector.
Key words: farm trajectory, share-tapping, polarization, path dependence, policy scenario, rubber economy, Thailand
Acknowledgements
I would like to acknowledge and express my very appreciation to Professor Betty Wampfler, Dr. Robin Bourgeois, Dr. Benedicte Chambon, Assoc. Prof. Dr. Buncha Sombunsuke and Assoc. Prof. Dr. Sutonya Thongrak, my supervisors for their patient guidance, valuable suggestions, comments and reviews are extremely meaningful for this study. Without their guidance and persistent help this dissertation would not have been possible. I would like to express my deepest appreciation to Professor Betty Wampfler, Dr. Robin Bourgeois, who have shown the attitude and the substance of a genius and whom I have mainly worked with, for being committed and patience throughout the study. I would like special thanks to Dr. Benedicte Chambon, for her generous assistances and providing valuable advice during the planning and development of this study. I would also like to thank my committee member, Dr. Jean-Christophe Castella and Dr. Pierre-Marie Bosc for providing critical comments and brilliant suggestions in this dissertation.
I would like to express my special thanks to the Office of Rubber Replanting Aid Fund (ORRAF), Rubber Research Institute of Thailand (RRIT), the Office of Central Rubber Market in Songkhla, the Office of Agricultural Economics (OAE) and the National Statistic Office (NSO), Thailand, for their services and supports that enable me to access and collect data for my study. I would also like to thank CIRAD for supporting my research and a grant for travel and field trips in Thailand. I would especially like to thank Prince of Songkla University and Faculty of Economics for the financial support and allowing me to take study leave. I would also like to extend my thank to my colleague in the department of agricultural economics, faculty of economics for their support and their help in offering me the resources.
I would like to express my deepest appreciation and gratitude to my wife, Mrs Sittiphon Kongmanee for her encouragement, assistance, companionship and advice through every stage of this study. I would also like to thank my parents, Kom Kongmanee, Sa-ngiem Kongmanee, and my family for supporting me and encouraging me with their best wishes. I would like to dedicate this achievement to them.
Table of Contents
Abstract……….…………..……… ii
Acknowledgements………..……….….. vi
Table of Contents……… vii
List of Tables……….…..….……….…….. x
List of Figures………....….……… xiii
List of Abbreviations………..……….…..……….…… xv
Glossary of Terms and Definitions………..……….………….……… xvi
Chapter 1 Introduction and Methods………... 1
1.1 Introduction….……….……….. 1
1.2 Objectives of the study……….……….. 8
1.3 Hypotheses of the study……….………. 8
1.4 Study outcomes……….……….. 8
1.5 Literature reviews……….……….. 9
1.6 A conceptual framework of the study……….……… 44
1.7 Analytical framework of the study………...………….. 49
1.8 Research design and methods……….……… 52
1.8.1 The fieldwork in 2011………... 52
1) Selection of the study areas………..………….………. 52
2) Population and sample selection……….…….……….. 56
3) Tools of the field survey………..….……….. 59
4) In field survey and data collection………..…….…………... 60
5) Reviewing secondary data and documentary study………..……….…………. 63
6) Field strategies and quality control of the field survey………..……… 63
7) Leaving the field in 2011………..….…………. 64
8) Database of the study………..….………... 64
1.8.2 The fieldwork in 2012……….………... 65
1.9 Chapter outlines……….……. 68
Chapter 2 Typology and Trajectory of Farms………...……….…….… 69
2.1 Population and agricultural transformation in Thailand……….… 69
2.2 Overview of rubber production in Thailand…………::………. 74
2.3 Characteristics of the respondents……….…. 81
2.4 Methods for analyzing farm trajectories..………..……….… 86
2.5 Typology of farm trajectories….……… 92
2.5.1 Multivariate analysis for analyzing typology of farm trajectories………….…… 92
2.5.3 Patterns of clustered farm pathways, refining six farm trajectories…...………... 107
2.6 Analysis of the six farm trajectories……….……….. 110
2.6.1 Growth of large family farm enterprises……….………..…… 110
2.6.2 Growth of medium family farm enterprises……….…………... 118
2.6.3 Toward patron farms………. 124
2.6.4 High structural change of farms………...……….……… 130
2.6.5 Stability of family farms……….……... 135
2.6.6 Declining very small farms……….……... 143
2.7 Relations between farm and non-farm activities……….……... 148
2.8 Analyses of farm polarization……….…… 151
2.9 Summary: farm trajectories in the rubber economy………..….…… 158
Chapter 3 Analysis of Share-tapping Arrangements………..……..….. 159
3.1 Evolution of share-tapping and tapping labor……….…………...… 159
3.2 Characterization of the actors engaged in share-tapping contracts……… 165
3.3 Institutional analysis of the share-tapping arrangement….……….…………... 175
3.4 Economic performance of share-tapping……….……... 178
3.5 Factors determining share-tapping arrangements.………...….…….. 182
3.6 Duration of contracts and risk averse actors in share-tapping………….….…….……. 199
3.7 A set of rules for explaining share-tapping arrangements………..……….…... 201
3.8 Contractual arrangements of share-tapping………..…….…. 204
3.9 Wage contracts challenging share-tapping……….…… 209
3.10 Summary: analysis of share-tapping arrangements…...………... 211
Chapter 4 A Path-Dependent Analysis of Rubber Farm Polarization and Share-tapping in Southern Thailand……….…….... 212
4.1 Analytical framework of path dependence……….……… 212
4.2 Path dependent explanation of farm polarization and share-tapping……….……. 216
4.2.1 Outcomes: the dynamics of farm polarization and share-tapping……….……. 216
4.2.2 Initial conditions: introduction of rubber plantation……….……. 216
4.2.3 Critical juncture and contingent points………...………... 221
4.2.4 Institutional setting……….…… 223
4.2.5 Self-reinforcement……….……. 226
4.3 Summary: path dependent analysis……….…… 243
Chapter 5 Discussion and Conclusion……….. 244
5.1 Hypotheses tests: agrarian change is driven by the co-evolution of land and labor…... 244
5.1.1 Landownership polarization………... 245
5.1.2 Stability of share-tapping arrangements………..…………... 253
5.1.4 Co-evolution of access to land and labor……….... 258 5.2 Development of an analytical framework and methods for farm trajectory
and path dependent analysis………...………….……. 259
5.2.1 Combining multivariate analysis and a systematic clustering technique
for trajectory analysis……….……. 259
5.2.2 Toward development of analytical framework of path dependence………..…... 261 5.3 Policy scenarios for the future of the rubber economy in Thailand…….………….…. 270 5.3.1 Policy scenario I: Continuation of present policies………... 273 5.3.2 Policy scenario II: Reverting polarization……….… 278 5.3.3 Policy scenario III: Coping with global constraints………... 285 5.4 Implications for the future development of the rubber economy in Thailand…...……. 290
5.4 Future research………... 292
Bibliography………...………...….. 293 Annexes……… 310
Annex A: Analysis of the rubber economy in Thailand: path development and
policies……… 311
Annex B: Analysis of the world rubber economy: structure, price and market
changes……….. 435
Annex C: Results of the statistical analysis………..……….……. 502 Annex D: Questionnaires for household survey in 2011……….……... 509 Annex E: Semi-structured questionnaire guides for the field survey in 2011…….…... 522 Annex F: Semi-structure questionnaire guides for the field survey in 2012…….……. 529
List of Tables
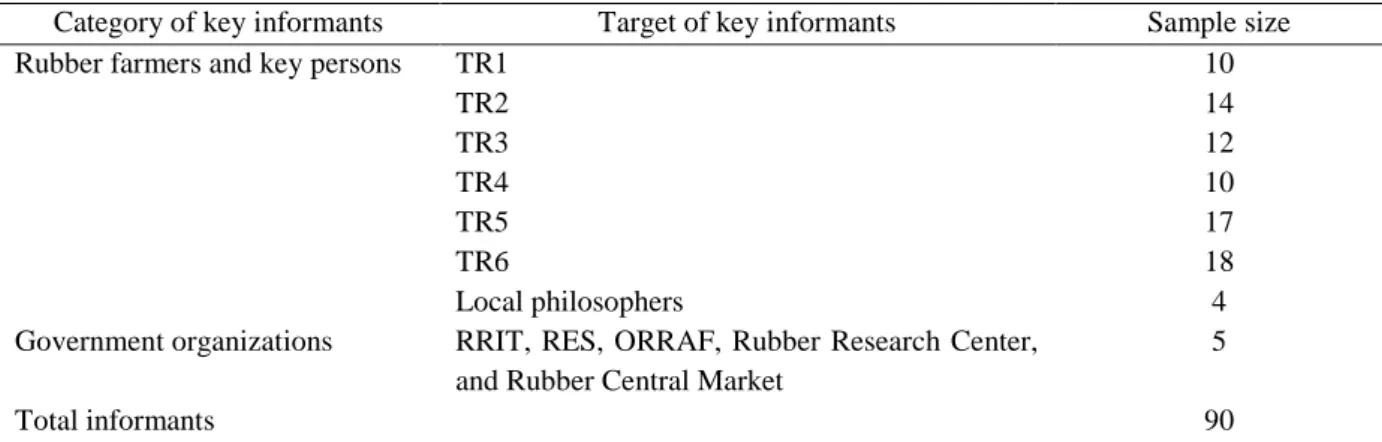
Table 1-1 Informants for informal interviews of preliminary survey in 2011……….. 53
Table 1-2 Overviews of community characteristics……….…. 56
Table 1-3 Sources of targeted key informants………..…. 57
Table 1-4 Sample size of household survey……….……. 59
Table 1-5 Actual surveyed sample………...……….…… 61
Table 1-6 Surveyed key informants in 2011………..…..….. 61
Table 1-7 Sample size according to categories of key informants in 2012……....…... 66
Table 1-8 Actual surveyed sample size according to categories of key informants in 2012... 67
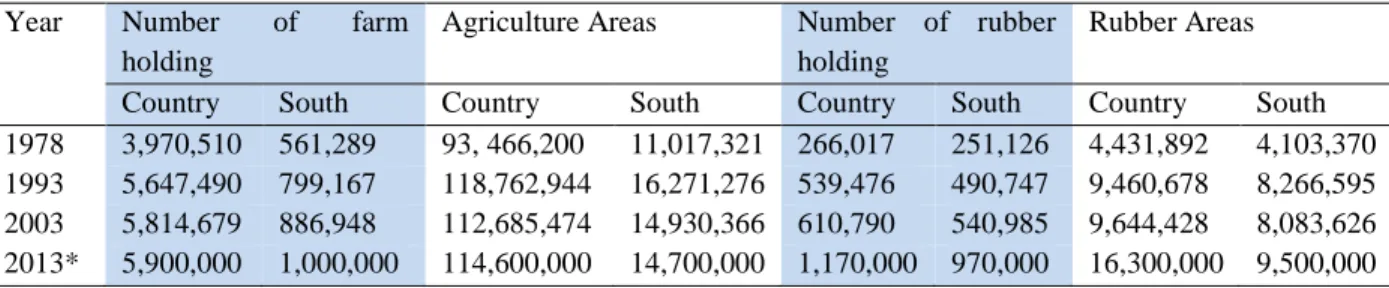
Table 2-1 Number of farm holding, number of rubber holding, agriculture areas, and rubber areas according to agricultural consensus………....……... 79
Table 2-2 Gender and age of household heads………..………..….. 81
Table 2-3 The education of household heads……….…...…… 82
Table 2-4 Family members of the respondents…..………....…... 82
Table 2-5 Family structure of household according to age group and gender…....….. 82
Table 2-6 Family structure of household according to gender, available of labors and their activities……….………...… 83
Table 2-7 The distribution of household according to landholding………....….. 83
Table 2-8 Agriculture experience of household heads………....….. 84
Table 2-9 Types of rubber based farming system………...….…. 84
Table 2-10 The distribution of household according nonfarm activities…………....…. 86
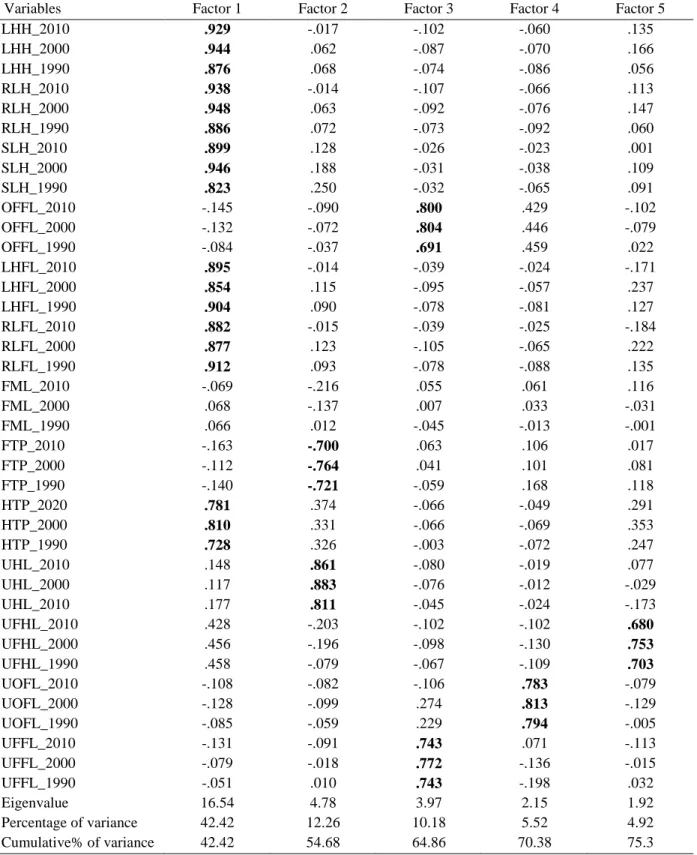
Table 2-11 Variables used in PCA………..………...….… 92
Table 2-12 Principal components of selected eigenvalue, explained and accumulated variance, and correlation coefficients of the variables with the different PC……….……….…… 94
Table 2-13 Characteristics of selected clusters of farm households and P-value of the one way analysis of variance………...……….. 97
Table 2-14 Six farm trajectory characteristics……...………....…….. 99
Table 2-15 Principal component of selected eigenvalue, explained and accumulated variance, and correlation coefficients of the variables with the different PC for the value of the variables in 2010……….. 101
Table 2-16 Characteristics of the selected clusters, mean of the variables and P-value from the ANOVA according to cluster of farms in 2010……….. 103
Table 2-17 Characteristics of the selected clusters, mean of the variables and P-value from the ANOVA according to cluster of farms in 2000…………..…..….. 104
List of Tables
Table 2-18 Characteristics of the selected clusters, mean of the variables and P-value
from the ANOVA according to cluster of farms in 1990……….. 104 Table 2-19 The 22 patterns of clustered farm pathways: each pattern is composed of a
succession of three stages, and each stage will be representing one of the 5
coded cluster numbers………...…….……... 106
Table 2-20 The 22 patterns of clustered farm pathways refined the six-farm
trajectories: each line represents a pattern of clustered farm pathway with the coded cluster number for each of the three years (1990, 2000, and
2010)………...………. 107
Table 2-21 Estimated average costs of farm maintenances according to TR1, TR2 and
TR3……… 116
Table 2-22 Estimated average costs of farm maintenances according to TR4, TR5 and
TR6……… 135
Table 2-23 The mean composition of household incomes according to the six farm
trajectories………...…….……. 156
Table 2-24 Farm strategy, productivity, capability, competitive position, and related
business for value added according to the six farm trajectories…...……... 157
Table 3-1 Farm characteristics of the rubber owners………....…… 166
Table 3-2 The distribution of share-tapping contracts according to large family farm
enterprises………...………... 167
Table 3-3 The distribution of share-tapping contracts according to medium family
farm enterprises………..………...…..…….. 167
Table 3-4 The distribution of share-tapping contracts according to patron farms....… 168 Table 3-5 Farm characteristics of share-tapper’s households………...….……. 170 Table 3-6 Farm characteristics of tapper’s households according to
share-tapping contracts………..…...….….… 171
Table 3-7 The average of working times according to tasks and forms of product….. 173 Table 3-8 The distribution of plots according to share-tapping contracts………...….. 178 Table 3-9 The estimated average economic performance to the rubber owners…... 179 Table 3-10 The estimate average income and work cost to hired tappers…...….….….. 180 Table 3-11 Return per unit and percentage of farm return according to the change of
yield………..…..…... 181
Table 3-12 The distribution of sources of hired tappers according to types of the
rubber owners………..…..…… 184
Table 3-13 The distribution of sources of hire-tappers according to share-tapping
List of Tables
Table 3-14 The distribution of farms according to tapping skill of household head…... 189 Table 3-15 The distribution of very small farms according to tapping skill and
share-tapping contracts………...……….………... 189
Table 3-16 The share-tapping arrangement changes regarding yield and tapping
years……….………. 190
Table 3-17 The distribution, frequency and cost of monitoring and supervision
according to types of the rubber owners………...……….……... 193
Table 3-18 The distribution, frequency and cost of monitoring and supervision
according to share-tapping contracts………...……….…….……… 194
Table 3-19 The distribution of working years in each plot according to types of the
rubber owners………...………..………... 200
Table 3-20 The distribution of working years according to share-tapping
contracts……….…………... 200
Table 3-21 Contractual arrangements according to main types of
share-tapping………..………..…... 205
Table 3-22 60:40, 65:35 and 70:30 share-tapping arrangements: types of
arrangements and obligations according to the rubber owner and
share-tappers….………... 207
Table 3-23 50:50 share-tapping arrangements: types of arrangements and obligations
according to the rubber owner and share-tappers………...………. 208 Table 3-24 55:45 share-tapping arrangements: types of arrangement and obligations
according to the rubber owner and share-tappers………..………...…. 208 Table 4-1 Stages of change and characteristics of period according to path
dependent analysis………...………..……… 215
Table 4-2 The new planting and rubber production in Thailand and Malaysia during
1934-1941………...…………..………. 223
Table 4-3 The estimation of number of holding and rubber areas by ethnic groups in
1949………..………..…………... 225
Table 4-4 Targets of rubber production and yield according the NESD plan during
1961-1981………...………..………. 227
Table 4-5 Targets of rubber areas, production, and yield according the NESD plan
during 1994-2001………...…….……….. 233
Table 5-1 Average landholding, landholding changes and distribution of landholding
according to the six farm trajectories………...……….… 245
List of Figures
Figure 1-1 Evolution of rubber yield in Southern Thailand………….……..………..… 2
Figure 1-2 The conceptual framework of the study……….………..…….. 48
Figure 1-3 Analytical framework of the study………..….…….. 50
Figure 1-4 Map of selection of field………...…….. 55
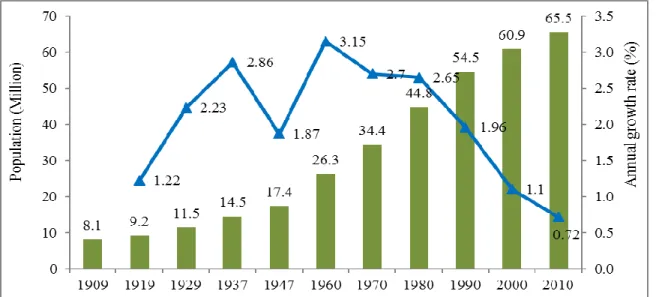
Figure 2-1 Population and the annual growth rate of population in Thailand during
1909-2010………...……… 69
Figure 2-2 Population age pyramids of Thailand in 1960-2010………..….…… 70
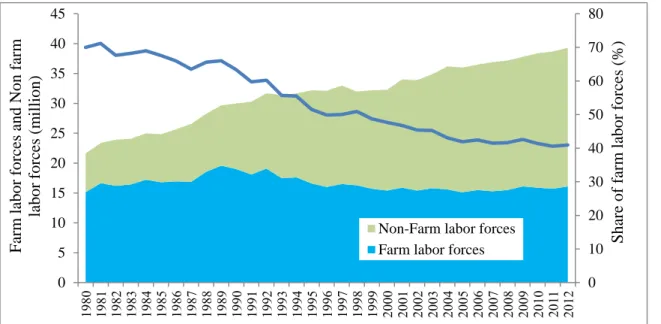
Figure 2-3 The average size of household in Thailand during 1960-2010………...…… 71 Figure 2-4 Numbers of farm and non-farm labors and the share of farm labors during
1980-2012……….….……. 72
Figure 2-5 GDP at nominal price 1988 according to farm sector, non-farm sector and
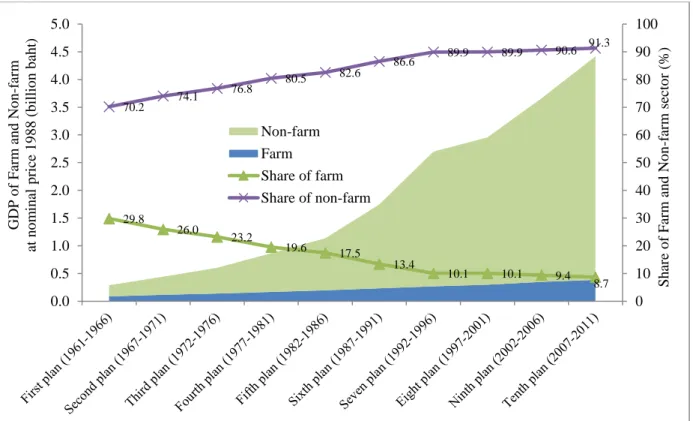
its share during 1961-2011……….……… 73
Figure 2-6 Areas of rubber plantation and tapping areas in Thailand during
1900-2012………..…….……. 76
Figure 2-7 Natural rubber production in Thailand during 1900-2012………..……...… 77 Figure 2-8 Yield of natural rubber in Thailand during 1961-2012……….….…… 78 Figure 2-9 Nominal price of natural rubber in Thailand during 1901-2012………....… 79 Figure 2-10 Market price of farmland in southern Thailand during 1950-2012……....… 80 Figure 2-11 Dendrogram resulted from clustering pattern and trajectory in a total of
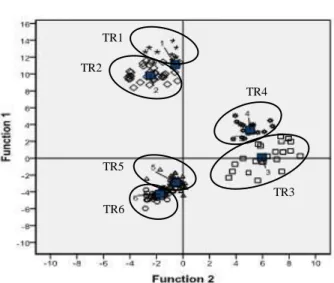
220 samples ……….………..………… 95
Figure 2-12 Canonical discrimination functions of six farm trajectories…………...…… 100 Figure 2-13 Dendrogram resulted from clustering farms according to the values of the
variables in 2010………..….….. 102
Figure 2-14 Dendrogram resulted from clustering farms according to the values of the
variables in 2000………...…….. 103
Figure 2-15 Dendrogram resulted from clustering farms according to the values of the
variables in 1990………..….….. 103
Figure 2-16 The 2 pathways for the trajectory “Growth of large family farm
enterprise”………...……… 111
Figure 2-17 Landholding changes in each farm underwent trajectory of large family
farm enterprise from 1990, 2000, and 2010 ………..…… 114
Figure 2-18 The 4 pathways for the trajectory “Growth medium family farm
enterprise”………...…… 119
Figure 2-19 Landholding changes in each farm underwent trajectory of medium family
farm enterprise from 1990, 2000, and 2010………..………. 121
List of Figures
Figure 2-21 Landholding changes in each farm underwent trajectory of toward patron
farms from 1990, 2000, and 2010……….………...……. 127
Figure 2-22 The average number of family taper (FTP) and hired tapper (HTP)
according to trajectory toward patron farms during 1990, 2000, and 2010... 128 Figure 2-23 The 8 pathways for the trajectory “High structural change of
farms”……….…….…... 130
Figure 2-24 Landholding changes in case of transferred land underwent trajectory of
high structural change of farms from 1990, 2000, and 2010…...…... 131 Figure 2-25 Landholding changes in case of the sold land underwent trajectory of high
structural change of farms from 1990, 2000, and 2010……….………....…. 133 Figure 2-26 The average landholding by the first generation and inherited land for the
next generation according to the trajectory of stable family farms.…....… 137 Figure 2-27 Landholding changes in each farm underwent trajectory of stability of
family farms from 1990, 2000, and 2010……….…..…… 138
Figure 2-28 The 3 pathways for the trajectory “Declining very small farms”…………... 144 Figure 2-29 The average landholding by the first generation and inherited land for the
next generation according to the trajectory of declining very small farms.... 146 Figure 2-30 The average number of family labors for non-farm activities by six farm
trajectories………...… 150
Figure 2-31 The average on-farm income, non-farm income, and off-farm income according to trajectories of stability of family farms and declining very
small farms………..………...……. 151
Figure 2-32 Index of landholding according to the six farm trajectories………...… 152 Figure 2-33 The pattern of clustered farm pathways for presenting compositions of the
six farm trajectories………....… 155
Figure 3-1 Conceptual framework of share-tapping contracts………..………….….…. 176 Figure 3-2 The change of farm returns according to rubber price in 2011…………..… 181 Figure 3-3 Simple model of a set of rules for explaining a set of behaviors and action
situations, and the set of contractual arrangements…..………..…… 202 Figure 4-1 Landholding, size of off-farm and proportion of very small farms in each
List of Abbreviations
ADS Air dry sheet
ALRO Agricultural land reform office
ANRPC The Association of natural rubber producing countries
CLU Cluster number
Con-latex Concentrated latex
DAE Department of agriculture extension, Thailand
DRC Dry rubber content
FAO Food and agriculture organization of the united nation
GDP Gross domestic products
IBRD International bank for reconstruction and development INRO International natural rubber organization
IRA International rubber agreement
IRRA International rubber regulation agreement
IRRDB International rubber research and development board IRSG International rubber study group
NESD Nation economic and social development, Thailand
NR Natural rubber
NSO National statistical office, Thailand
OAE Office of agricultural economics, Thailand
ORRAF Office of the rubber replanting aid fund, Thailand
PC Principal component
PCA Principal component analysis
PE Pattern of evolution
RES Rubber estate organization, Thailand
RRC Rubber research center, Thailand
RRIM Rubber research institute of Malaysia RRIT Rubber research institute of Thailand
RSS Ribbed smoked sheet rubber
SHFE Shanghai future exchange
SICOM Singapore commodity exchange
SR Synthetic rubber
STR Standard Thai rubber
TOCOM Tokyo commodity exchange
TR Trajectory
UNDP United nation development program
USS Unsmoked sheet rubber
Glossary of Terms and Definitions
Agrarian change Agrarian change is institutional change and evolutionary process of institutions embedded to order habits of thought, behaviors and actions of actors that govern and shape the agrarian structure and system De-agrarianization Process of agrarian change moving agrarian society away into
something else, in which mostly became urbanizations and/or industrialization
Family farm Family owned and operated farms by family labor Family farm
enterprise
Family owned farm enterprise which conducts and manages to the farm business
Farm polarization A process of farm orientation and its change in which is divided into two polar axial movements or opposing directions contrasting groups or sets of institutions, resources, management and objectives, etc.
Macro institutions Institutions at constitutional level in which embedded social, economic and political behaviors and activities at macro level
Meso institutions Institutions embedded social, economic and political behaviors and activities at meso level
Micro institutions Institutions embedded behaviors and actions of individual and collective actions or the operational level
Non-farm Family labors were employed to work by employers in outside of farm sectors that would pay a salary or wage, or by self-employments that they gain income from their jobs
Off-farm Family labors are hired by other farms in returns for wage
On-farm Family labors engaged to work family-owned farms
Path dependence The sequence events set in motion of pattern of change and influence subsequent events emphasizing critical juncture and contingent events to create institutions, institutional reproductions and reactive sequences governing actor behaviors and institutional patterns
Patron farms Farm owners worked non-farm activities and operated farm by only the hired labors
Self-reinforcement Mechanism process of institutional reproduction
Share-tapping Labor contracts in rubber production which paid by output sharing as a form of wage
Trajectory The farm changes moving into a particular direction in response to sequence events and the actions of a given forces, etc.
Introduction and Methods 1.1 Introduction
Natural rubber (Hevea. Brasiliensis) is one of the most important agricultural products and is a major economic crop in Thailand. The rubber economy involves more than 6 million people or about 10% of the Thailand population. Rubber production has a high value ratio in gross domestic agricultural production and accounts for about 40% of the total export value of agricultural products (RRIT, 2008). This production has greatly increased farm income, improved the standard of living of rubber farmers, and achieved the growth of the rubber industry.
Since the early 1990s, Thailand has been the world’s largest rubber producer and exporter. Rubber areas now total 3.1 million hectares with production of about 3.6 million tons (OAE, 2012). About 95% of the production comes from smallholdings (holding size below 8.0 hectares) (RRIT, 2012). The farmers produce mainly three forms of rubber products which are unsmoked sheets, fresh latex, and cup lump. Farmers sell their products to middlemen or cooperatives, and then those products are transformed into rubber smoked sheets, concentrated latex, or block rubber by the intermediate industry. Domestic consumption is approximately 15% and export about 85% of total rubber products which provide about 40% of world market share. Southern Thailand, and to a lesser extent other regions in Thailand, is the traditional area for rubber cultivation. Rubber is cultivated across the fourteen southern provinces and accounts for about 66.7% of the total land in southern Thailand. Rubber plantations covering about 1.95 million hectares constitute more than 63% of total rubber areas in Thailand and produce about 73% of national rubber production (OAE, 2012). Produced by about 1.0 million farm households, rubber is an important economic crop in terms of main income, livelihood, and a source of competitive advantage for social and economic development in this region.
In the early 1900s, rubber was first introduced in Trang province. Most farmers used simple technology with traditional cultivation practices such as seedling trees with very scarce capital, family labor, and poor farm management (Stifel, 1973). The yield of rubber plantations was lower than 400 kg per hectare. In the 1960s rubber development projects entitled “rubber re-plantation schemes” were established. The re-plantation schemes were part of the policies of the Ministry of Agriculture and Co-operatives. Two agencies were responsible, the Rubber Research Institution of Thailand (RRIT) and the Office of Rubber Replanting Aid Fund (ORRAF). New technologies from RRIT were diffused to farmers by ORRAF. ORRAF also provided grants in accordance with the rubber-replanting Act. Moreover, Rubber Estate Organization (RES) also provided and set up trials on technologies such as planting materials, agriculture tools, and other materials necessary for rubber cultivation including pilot plants of rubber processing. Under the rubber re-planting schemes, high yielding plantations (new clones, mono-specific plantation, and performing tapping
systems) were widely adopted by the farms. The technology brought by the re-plantation schemes played an important role in the growth of the rubber economy.
In particular, the replanting scheme was a critically important factor to increase the areas planted with high yielding clones, whereby 1.472 million hectares were replanted between 1960 and 2007 (ORRAF, 2010). In 1991, about 40% of total rubber areas were planted with a high yielding clone and increased to 98% in 2003. As a result, the average yield of rubber plantations in the southern region is now 1,644 kg per hectare (RRIT, 2012). Figure 1-1 presents an estimation of the rubber yield evolution in the southern region since 1960. It shows that the rubber yield had increased from less than 400 kg per hectare during the 1960s to 1980s to a maximum of about 1,800 kg per hectare in 2003, indicating one of the best levels of yield in the world by smallholdings. This achievement was enforced through technology and government intervention. However, since 2003, the study observed that yield had sharply declined to diminish pattern as in Figure 1-1.
Figure 1-1 Evolution of rubber yield in Southern Thailand
Sources: FAOSTAT, 2010; RRIT, 2010
Moreover, about 55% of total rubber farms in 1998 did not collaborate in the re-plantation scheme (NSO, 1998). They had increased to 60% in 2008 (Somboonsuke et al., 2008). These farmers also tried to adopt the new technology brought by the scheme (notably using clones) even if they adapted it in respect to their farm constrains in particular land size, labor availability, and socioeconomic conditions. Similarly, farmers involved in the schemes adapted recommended technology after the end of the scheme (sixty-six months after plantation). For example, the previous research showed that more than 58% of rubber farms in Songkhla province used a high intensity tapping system, mostly ignored fertilizer use, increasingly planted rubber on wet land, and so forth (Somboonsuke et al., 2008). RRIT (2008) also argued that rubber trees had generally low girth and heterogeneous growth in the immature period of more than 7 years. Deficient farm management during the mature period and intensive tapping systems may lead to a short productive life. These resulted in pressure on resource exploitation, tend to decline yield, and declined economic performance. The limited/selective adoption of official recommendations by the farmers when there was no (or no more) development project was not only observed by small farms in Thailand. The
0 200 400 600 800 1000 1200 1400 1600 1800 2000 1961 1963 1965 1967 1969 1971 1973 1975 1977 1979 1981 1983 1985 1987 1989 1991 1993 1995 1997 1999 2001 2003 2005 2007 2009 Yiel d ( k g /h a)
Association of Natural Rubber Producing Countries argued that the plantation technologies appropriate for the estate sectors might not necessarily be appropriate for smallholding farms. The farmers were still reluctant to take risks to adopt new or improved technologies, especially those that were complex and expensive technologies (ANRPC, 2001). Since the introduction of rubber, southern Thailand has undergone land change. Before the 1980s, the growth of the rubber economy was due to expansion of new planting in new land. This was largely explained by a large surplus of land. After that date, the expansion of new cultivation areas became limited, and so the growth of the rubber economy was due to the adoption of new technology in particular with high yield. That was the end of land frontier leading to scarce and unavailable land use and rising land constraints (Siamwalla, 1996; RRIT, 2006).
Since that time, the average size of rubber farm households continued to decline from 2.7 hectares in 1998, 2.5 hectares in 2003, and only 1.87 ha in 2007 (RRIT, 1998, 2007). Accordingly, the study also observed the changes in distribution of rubber landholdings between 1998 and 2003 in southern Thailand. The share of the small size holdings (0.3 to 6.24 hectares) decreased from about 64% to about 60% and the average size decreased from 1.8 to 1.7 hectare. Similarly, the share of big size holdings (more than 22.25 hectares) decreased from about 10 to 9% and the average size from 42.2 to 31.0 hectares. On the other side, the share of the medium size holdings (6.24 to 22.25 hectares) increased from about 26% to 31%, but the average size decreased from 6.7 to 6.3 hectares (NSO, 1998, 2003). The data indicated that distribution of landholding is changing. The preliminary survey in 2010 found that most rubber farms operated small farm size of about 1.6 hectare and widely formed land fragmentation, presenting multiple small plots and forming scatterings of landholdings, which complicated the management of the farm. Moreover, because of the reduction of farm size, farm income might decrease and force farmers to adopt new strategies at the plot and/or at the farm level to ensure family livelihood.
Other evidence from the field was that the availability of land was limited for rubber and so increased pressure on land use in the southern region. Because facing low availability of land, new plantings were expanded to either marginal areas or unsuitable land for rubber trees that could not benefit from ORRAF subsidies. In the past, farmers had avoided to plant rubber on lands that they considered less suitable for rubber production (Besson, 2002). But, from 2003 to 2010, most of the new plantings had encroached from paddy fields, flooded land, and old fruit tree areas, which were unsuitable with limited topography conditions (Somboonsuke et al., 2008). The main constraints were observed in unsuitable areas consisting of inappropriate soil, low soil fertility, unconditioned climate, and improper topography for rubber trees. Plantations planted in these conditions needed special farm management and highly adapted RRIT technology. The study knew that these plantations had lower yield and higher production cost compared with recommended areas (RRIT, 2009). Moreover, the price boom during the past decade (2010s) has increased pressure on limited available lands. The rate of re-plantation areas had declined by about 30% since 2006, although it could provide the support to maintain the rate of replanting. On the other side, new planting of owned-investment was increasing substantially (ORRAF, 2009).
From the above discussion, it is clear that land has always been an important production factor in the rubber economy. At the beginning, land was a surplus resource allowing the extension of new plantings and so it significantly contributed to high growth of the rubber economy.
Since the 1980s, land has become a scarce resource and unavailable for the rubber economy. This can be observed through the change of structures of holdings and the increasing use of marginal land. If this evolution continues, land changes in southern Thailand may threaten the future of the rubber economy. Therefore, this study will analyze the recent changes and their determinants.
Labor is another important factor for rubber cultivation. During the productive period, rubber harvesting (tapping) is labor intensive needing a large number of skilled labor without technology replacement. Since the beginning of development of the rubber economy, labor availability has been changing. These changes are complex, involving the interaction of several factors and they are much influenced by the policy of every major economic sector, social development, and farm and non-farm labor policies. For the last three decades, the demographic structure in Thailand has changed from high to low mortality and fertility leading to a continued decline of population growth rate and overall supply labor including an aging population (UNFPA, 2011). In parallel, Thailand’s rapid economic expansion increased the demand of labor for industry both skilled and unskilled and so induced migration of a large number of farm laborers to urban areas. Siamwalla (1996) predicted an absolute decline of the labor force in agriculture sometime in the 1990s. In the southern region, farm labor gradually declined from 3.2 million in 1993 to 2.1 million in 2007. The farm labor per farm household also declined from 3.52 people in 1998 to 2.58 people in 2007. There were some changes in farm holder structure with the share of young holder (<35 years) declining from 18.7% in 1993 to 16.7% in 2003 when the share of elders increased (> 65 years) from 12.6% in 1993 to 16.4% in 2003 (NSO, 2003, 2008). The decline of farm labor forces was especially dramatic for very young labor 15-24 years due to industrialization, education, and attitudes (Poapongsakorn et al., 1998). At present, the family workforce in the rubber farms is below 2 people per household. This workforce is characterized by older age (> 47.5 years), minimum education, lack of training, and lack of tapping skills (RRIT, 2007; Somboonsuke et al., 2008).
In southern Thailand, two types of tapping labor exist, these are family labor and hired labor, in this study called “share-tapper”. Labor contracts are always laid down on share-tapping. A share-tapping contract is a contract arrangement between a landowner and a tapper (hired labor) where tapping labor is a tenant and has contracted out the right to tap rubber trees for a wage in the form of output sharing. Each contract agreement specifies the output sharing, cost sharing, and level of responsible jobs contracted out by informal agreements in respect with a certain context of circumstances. These three attributes can differ from one contract to another. Sharing output and cost are determined and negotiated between owner and hired labor, which means that they are a tradeoff between benefit and cost sharing of farm maintenance. In 2008, output sharing varied from 70:30 to 50:50 i.e. 70:30
means that the owner got 70% of total output and 30% was shared with the hired laborers. The ratios 55:45 and 50:50 are the most common agreements.
Several researchers claimed that share-tapping had evolved through increasing output sharing for hired labor in respect with increasing labor constraints, and social and economic change (Keawhnoo, 1995; Somboonsuke & Junjareang, 1995; Thungwa et al., 1998; Taanthai, 2002). But this argument still has to be scientifically demonstrated. The contractual arrangements and negotiations are affected by several factors such as labor attributes, socioeconomic conditions, institutions, location, biophysics characteristics of the plantation, community attributes, supply of tapping labor, rubber price, and marketing (Somboonsuke et al., 2008). From the field survey in 2010, each contract agreement seemed to be accepted in conditions and attributions by the rubber owner and hired laborers, and this deal became the rules for tapping employment in the community. By share-tapping contracts, the average labor cost was over 65% of total production cost when it was only about 49% with family labor calculated by daily wage of Songkhla in 2007 for estimation of labor opportunities cost (Somboonsuke et al., 2008). There was the highest labor cost to compare with labor cost in other crops.
Hired laborers were commonly employed by farm businesses. Eventually smallholdings faced several constraints such as low available of family labor, low working capacity, long distance of their owned plots, and rubber being a secondary occupation leading many of them to employ share-tapping labor. Presently, there are no official statistics about numbers of hired laborers and the distribution of tapping laborers. Kosaiysavee (1999) indicated that about 48% of plantations in the southern region employed tapping labor in 1999. By the estimation of a preliminary survey, the employment of share-tapping labor was likely to be more than 65% of total farms. This labor came from various sources such as kinship, local laborers from the village and neighboring provinces, other regions, and immigrants from Burma and Laos. Rubber owners prefer kinship and local labor in the villages rather than the other options. However, the labor force was characterized by high mobility between tapping and industrial jobs regarded rubber price fluctuation and wages. In particular, the trend of increasing rubber price since 2003 has encouraged labor to come back to tapping (NESD, 2008).
For most households of share-tappers, tapping is their main source of income. They are pressured from various constraints such as small size, landlessness, fluctuation of income, hard working conditions, insecurity of employment, etc., (World Bank, 1994; Thungwa et al., 1998). Consequently, tapping jobs are not attractive or motivating jobs in particular at the period of low or high-fluctuated price. The workforce will move to alternative jobs in industrial sector and then some difficulties arise for famers to recruit tappers especially when rubber prices fall.
Other critical issues were lack of skills and quality of hired labor. Skill is an important determinant of the present and future productivity of the rubber plantations. Generally, a tapper should be apprenticed for one to four years to perform at an average skill level.
Therefore, general laborers cannot be a tapper if one has no tapping skill and experience of tapping (ANRPC, 2001). However, it is not realized in facts. And this study mentioned that the rubber farmers and tappers were getting older or have more tapping years, but they are considered unskilled labor. The reason for that is that if farmers need to train or improve tapping skills, they learn from neighbors and by working their farms. Chancharoen and Somboonsuke (1997) argued that 47.1 % of labor had no skill in rubber tapping. This problem might be increasing as seen in the results of the survey by Somboonsuke et al. (2008) which stated that about 70% of tappers in Songkhla province were unskilled and few followed training in tapping before becoming a tapper.
RRIT (2008) also mentioned this shortage of qualified tapping labor for rubber production. In southern Thailand, even if up to now, it had not been reported that rubber plantations were not tapped, which would indicate a real labor shortage, labor constraints became an increasing pressure and could reduce competitiveness at farm and national level in the future of the rubber economy. The same events had been observed in Malaysia leading to a decline of rubber production in the 1980s (IRRDB, 2001). Because of their possible consequences on the future of rubber sector in Thailand, both quantity and quality labor constraints need to be addressed by alternative policies or reform policies. Therefore, this study focuses on tapping labor and share-tapping issues that will threaten the future the rubber economy.
Moreover, rubber prices highly fluctuate, despite the high nominal price level achieved during the 2000s. FAO (2006b) stated that rubber prices depended mainly on the cyclical movement of the world economy and influenced by various short-term factors such as weather, currency movement, future market activities, market interventions and irregular demand, and then there were fluctuations along this gentle phase of the rubber cycle. Indeed, the global economic slowdown during 1980-2000 had obviously affected rubber demand greatly, resulting in a decline in rubber prices. The falling rubber price caused a price intervention periodically, attempting to bring prices to a more remunerative level, especially for smallholders. Together with falling farm size and labor constraints, farms tended to increase vulnerability of livelihoods. However, profitability was increased during the period of price boom (2003-2011). Rubber price is an important factor to determine resource allocations (land and labor) in farms and the government policies. Therefore, this study will analyze how the farms respond to the market, price, and their influences to shape government policy.
The above discussion showed that rubber played an important role in the growth of the Thailand economy and contributed highly to increase the standard of living of farmers, notably in the southern region. The model of development of the rubber economy in Thailand is usually considered as a success. For the past three decades, some changes have happened in land and farm labor in particular in southern Thailand. These evolutions may threaten the development of the rubber economy in Thailand. Therefore, this raises the broad question of what/how the rubber economy will be in the future. This development issue refers to study concerns; this study will provide a better understanding of agrarian change. By this
understanding, the study expects to be able to give some information about what the future of the rubber economy could be and advise or suggest an appropriate policy in order to modify the general current and future state of the rubber economy if policy makers need to come up with alternative policies.
As it will be shown in this work, market analysis is not sufficient to explain the current situation of the rubber economy in southern Thailand. In this approach, this study believes that the sequence of events in social and economic development are governed and shaped by historical events and prevailing institutions that have influenced deterministic patterns or set institutional arrangements for the motion of future events. The historical sequences of events establish critical juncture for institutional settings and a given institutional arrangement reproduced to structure a pathway of social and economic development in the present and the future. Institutions, which are established and set by prevailing institutions, are embedded in habits of thought, behavior, and individual and collective actions. Therefore, social and economic development should be explained in terms of the structural transformation and an evolutionary process of institutions recognizing institutional change and the evolution of institutions.
This study defines and describes agrarian change by the views of institutionalism. The definition of agrarian change adopted in this study “is institutional change and evolution of institutions embedded to order habits of thought, behavior, and individual and collective actions that govern and shape an agrarian structure and systems” (Hamilton, 1932; Hodgson, 2004a). Agrarian structure and systems in this research denote a complex relationship within the agriculture sector. These include the structure of land, labor, technology, production systems, and social and economic elements, which determine economic systems of individual farms and an agrarian economy. Institutional change plays a central role to constitute and to impose upon agrarian change from one institutional setting to another.
Accepting the role of institutions with the mechanism of reconstitutive causation, institutional change is considered as the structural transformation of social and economic elements that can cause changes in habits and behavior within individuals through endogenously generated change. It enables new habits of thought, behaviors, and individual and collective actions in an agrarian society. These are a continuum and occur over time as evolutionary processes of institutions. When the movement of institutional settings to another one occurs as a result of adaptation of habits to the changing environment, new institutions, social selection, technology, power, and external shocks, institutional changes have the capacities to mold and increase new habits of thought, behavior, expectations, and actions (Hodgson, 2004b) as Veblen’s states “The situation of today shapes the institutions of tomorrow through a selective, coercive process, by acting upon men’s habitual view of things” (Veblen, 1899). After new institutions become common habits of thought and behavior or concordant habits, regularity of human actions will lay down on an agrarian society that will lead to agrarian change.
Main study questions:
1. How did the rubber sector evolve historically?
2. What are the key determinants of this evolution in southern Thailand? 3. What are the policy implications on the future of the rubber sector? 1.2 Objectives of the study
The main objective of this study is to address the problems of the rubber economy by developing a conceptual framework of institutional economics for analyzing agrarian change. This framework will be applied to the rubber economy in southern Thailand.
Specific objectives consist of:
1) to analyze farm transformation in the rubber economy
2) to examine the evolution of land, labor use, contracts, and their determinants in the rubber economy in southern Thailand
3) to develop prospective policy analysis in order to suggest policy options and implications for policy decisions in Thailand
1.3 Hypotheses of the study Main hypothesis:
Simultaneous co-evolutions of access to land and labor relationships are key drivers of agrarian change taking place in the rubber economy
Specific hypothesis:
1) Apparently, there is no significant change in labor availability because institutional arrangements in share-tapping have never been challenged 2) There is polarization of landownership; farm size of the smallholdings is
decreasing when some owners are increasing land accumulation leading to land concentration
3) Land polarization reinforces the stability of tapping contracts 1.4 Study outcomes
The study seeks to provide good understanding of transformations in rubber based farms and to have knowledge of macro-institutions, micro-institutions, and their links influencing farm transformation. It will highlight implications for alternative policies to government intervention, rubber organization, and re-plantation schemes to increase economic welfare. It also will provide the setting of appropriate and technological services beyond supporting agricultural and economic growth.
1.5 Literature reviews
This section pays attention to a critical review of the literature about theoretical frameworks of agrarian change and institutional economics. The attention focuses on the main ideas about how they were developed, theoretical approaches, and their limitations including comparisons between schools of thought. In this study, the research approaches institutional economics, in particular the so-called “old institutional economics” for analyzing agrarian change. The study begins with a classification of main influential thoughts of agrarian studies that are fundamental in the understanding of agrarian change. Next, institutional economics are fundamentally reviewed to answer the following questions: what are institutional economic approach exits, institutional changes and path dependent theory in order to answer why institutional economics appropriately explain agrarian change in the rubber economy. Finally, methodological institutionalism is discussed.
1.5.1 Agrarian change
Agrarian change is analyzed by various theoretical approaches such as economic growth, agricultural development, political economy, and sociology. All of them have applied theoretical and methodological frameworks as aspects of courses and objectives in specific ways. However, agrarian change seems to be highly fashioned through political and economic issues and rural development, in particular the contribution of transitions to capitalism or socialism. By the researcher’s observations, agrarian studies attempt to understand constrains, problems, and prospects of social and economic change in agricultural sectors. The formation and transition to capitalism or socialism are essentially recognized together with economic growth and government policies. There are reflections on social and economic development in developed, developing and poor countries. In this section, the study attempts to present a board theme of agrarian change and agrarian movement, to classify and sketch the context of agrarian studies and to debate leading scholars of agrarian change, allowing the explanation of contemporary agrarian change.
A broad theme of agrarian change and agrarian movement has seemed to be a transition to capitalism and neo-liberalism. Agrarian transformations within and across countries have been significantly and dynamically altered during the past few decades, gearing the change in the world economy and global politics. The agrarian world has witnessed continuity and change in terms of general patterns of accumulation, appropriation, and dispossession for capitalist development as well as socialist construction (Borras, 2009).
Since the sixteenth century, the held thought of capitalist development has been the pioneering of successful agricultural change and was remarkable as a main direction of this change. In the past four decades, the era of neoliberal globalization has influenced and witnessed important changes in the nature, scope, pace, and direction of agrarian transformations within and between countries. The transnational agrarian society was a new movement of the existing agrarian scenario. This change considers intensive capitalism and high dynamics with international trade (Bernstein & Byres, 2001; Borras, 2009). Borras et al.
(2008) argued that transnational agrarian change raises the recent wave to restructure agrarian society by the impact of neo-liberalism and global political-economy that has predominantly altered the dynamic of agrarian production and exchange relations within and between countries. Consequently, national peasant and farmers’ groups are directly linked to transnational movements that have gained and confronted considerable power and political influences.
Agrarian movements are affected by, or have struggled with the global-local complex process in response to localization, privatization, and internationalization which has led to global agrarian restructuring (Borras et al., 2008). The results were complicated to evaluate but it led to de-agrarianization as in the transformation of Turkish agriculture. Aydin (2010) argued that the de-agrarianization in Turkey was actively propelled by the increased liberalization of agriculture, absolute control of transnational corporations, and state policies. Globalization has meant the restructuring of agrarian arrangements to free market economy. Agriculture is controlled and owned by large multinational corporations. They are capable of pushing small farmers out of agriculture. The destruction of agricultural production will only exacerbate Turkey’s problem (Aydin, 2010).
In this study, the researcher’s concern is with agrarian change as a phase of world agrarian movement, and wishes to deeply understand the specific process of evolution and structural transformation. The transitions from a traditional economy or backward economy to capitalism or from socialism to capitalism have occurred around the world as a main wave of the agrarian movement. Such change may move to a phase of intensive capitalism or transnational agrarian production and exchange in the coming decades. Technology has certainly driven this change as well as gearing world economy. Even though it has failed to deliver the goal of agrarian change by rising farm living standards and economic welfare in many places.
This transition coincides with the most recent wave of global political economics and agrarian reconstructing, allowing even great power to transition in terms of production and exchange to favor a large private capital, which will lead us to face even more de- agrarianization (Borras et al., 2008; Aydin, 2010). As Berstein and Byres (2001) notes, the agricultural transition to capitalism is a crucial argument of agrarian change. There is a complex interplay between land availability, technical progress, organization, social and political power, and their specific mechanism of appropriation. This statement provides a broad determinant to contribute to agrarian change. In this study, the researcher postulates that land, and labor are important factors to determine agrarian change in the rubber economy in southern Thailand.
In this research, the classification of agrarian studies proposed by Ellis (2000) and Borras (2009) were employed. Ellis (2000) emphasized the theoretical framework of agrarian studies, while Borras (2009) focused on general themes of political economy and social science studies. These schools of thought have influenced classification of agrarian studies regarding approaches of scholar papers and core background theory. Thus, agrarian studies