HAL Id: cirad-01807819
http://hal.cirad.fr/cirad-01807819
Preprint submitted on 5 Jun 2018
HAL is a multi-disciplinary open access
archive for the deposit and dissemination of sci-entific research documents, whether they are pub-lished or not. The documents may come from
L’archive ouverte pluridisciplinaire HAL, est destinée au dépôt et à la diffusion de documents scientifiques de niveau recherche, publiés ou non, émanant des établissements d’enseignement et de
Demographic parameters of ruminant livestock in the
arid and semi-areas of West and Central Africa – A
review for the conference “Confronting Drought in
Africa’s Drylands. Opportunities for Enhancing
Resilience” (Agence Française de Développement and
World Bank). http://livtools.cirad.fr/guideline
Matthieu Lesnoff, Lionel Julien
To cite this version:
Matthieu Lesnoff, Lionel Julien. Demographic parameters of ruminant livestock in the arid and semi-areas of West and Central Africa – A review for the conference “Confronting Drought in Africa’s Drylands. Opportunities for Enhancing Resilience” (Agence Française de Développement and World Bank). http://livtools.cirad.fr/guideline. 2018. �cirad-01807819�
Lesnoff, M.
(1), Julien, L.
(1), 2014. Demographic parameters of ruminant
livestock in the arid and semi-areas of West and Central Africa – A review
for the conference “Confronting Drought in Africa’s Drylands. Opportunities
for Enhancing Resilience” (Agence Française de Développement and
World Bank).
http://livtools.cirad.fr/guideline
(1) CIRAD, UMR SELMET, F-34398 Montpellier, France.
SELMET, Univ Montpellier, CIRAD, INRA, Montpellier SupAgro, Montpellier, France.
Table of contents
1. Introduction ... 2
2. Material and methods... 2
2.1.1. Collection of demographic parameters ... 2
2.1.2. Meta-analysis ... 5 3. Results ... 7 3.1. Parturition... 7 3.1.1. Cattle ... 7 3.1.2. Small ruminants... 8 3.2. Net prolificacy ... 8 3.2.1. Small ruminants... 8 3.3. Mortality ... 9 3.3.1. Cattle ... 9 3.3.2. Small ruminants... 11 3.4. Herd structure ... 12
3.4.1. Proportion of females in the herd ... 12
3.4.2. Proportion of reproductive females in the herd ... 13
4. Summary tables ... 16
5. Bibliography ... 18
6. Annex ... 19
1. Introduction
This note presents a literature review on demographic parameters of cattle and small ruminant herds in traditional husbandry systems of the dry areas of West and Central Africa. It has been realized for the conference “Confronting Drought in Africa’s Drylands. Opportunities for Enhancing Resilience”1 (Agence Française de Développement and World
Bank) and the World Bank study “Prospects for livestock-based livelihoods in Africa’s drylands”2 (2016, Chapter 5).
The objective was to provide input parameters for demographic models that were planned to be used in the study to simulate the dynamics of the livestock productions.
The literature review was limited to data reported for areas showing an aridity index (AI) ≤ 0.5, more precisely the arid (A = 0-500 mm rain or “AI1-2-3”) and the semi-arid (SA = 500-1000 mm rain or “AI4-5”) areas. A and SA of West and Central Africa areas have a monomodal rainy season (July-August or June-September).
The review focused on on-farm studies. Data reported under ranch or experimental conditions, with improved feeding and health conditions, have not been considered.
Several Excel files have been provided to the World Bank study in complement of this note, namely:
dryland_west_central_africa_demog.xlsx, which details the demographic parameters collected in the literature and which describe the context of the study for each data reported: location of the study area, type of the survey carried out, type of parameter considered, literature source, etc.
dryland_west_central_africa_weights_milk.xlsx (same as above but for live weights and milk production rates)
summary_param_dryland_west_central_africa.xlsx; which does a comprehensive summary of the average parameters values used as input for the demographic model calculating livestock productions.
A meta-analyze of the demographic parameters collected in the literature were carried out for A and SA areas. A summary of the mean values taken as reference for the parameters are downloadable at http://livtools.cirad.fr/guideline (See WB Dryland study in section Download).
2. Material and methods
2.1.1. Collection of demographic parameters
The review followed the general principles described in Lesnoff ([1]). For livestock, many demographic parameters have been described in the literature ([2]–[10]) in relation to factors such as the study objectives, the husbandry systems investigated, the levels of detail used to describe the animal life cycle or the methods used for the field survey or the statistical analyses. Before collecting data from the literature, it is important to define a conceptual model for the parameters (model-based approach) to then facilitate the meta-analysis of the data.
In this note, the definitions of the demographic parameters were based on the herd growth models that split the animal populations by sex and age class. Such “sex-and-age” models have been commonly used for tropical livestock (e.g. for description: [11], [12], [13], [14]), [15]– [18], [19]). Their main inputs are the demographic rates which measure the occurrence of the demographic events in the herd during a given period:
the “natural rates”, that refer to the natural performances of the herd, i.e. reproduction and mortality
the “management rates”, that refer to the events directly related to farmer decisions. Management rates are commonly composed of “offtake” (exits of animals from the herd due to slaughtering, sales, gifts, etc.) and “intakes” (entries of animals in the herd due to purchases, gifts, etc.). Intakes are generally integrated in the offtake to define net offtake (i.e. balance between offtake and intake).
The “state variables” of the model describe the state of the herd at a given time: the herd size (number of animals)
the sex-and-age structure (% of animals in the sex-and-age categories)
A difficulty of a literature review is the frequent mixing between the types of demographic events. For instance, in the calculations of the rates, abortions can be mixed or not with parturitions, stillbirths with the deaths of offspring born alive, and natural deaths with the emergency slaughtering. Such mixing can have large effects on the values of the rates that are reported from the studies. One way to circumscribe such problem is to define the rates from a pre-defined animal life cycle.
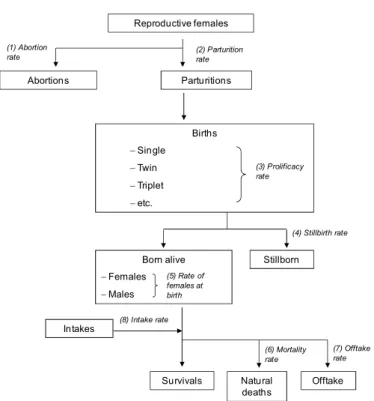
The animal life cycle used in this review is presented in Figure 1. The derived demographic rates are listed in Table 1. Secondary rates can eventually be derived from these primary rates. Some examples are given in Table 2.
For the occurrence rates, i.e. the parturition, mortality or offtake rates, it is important to distinguish between probabilities (p) and hazard rates (h) since they have different interpretations and, for the same intensity of occurrence, can be different ([9], [10]). In this note, h rates were preferred to p rates since they are more flexible for defining age classes in the demographic models ([19]).
Figure 1: Example of animal life cycle used for a sex-and-age herd growth model.
Table 1: Demographic rates derived from the animal life cycle of Figure 1. Rates are defined for any time-period and animal category represented in the herd growth model.
Natural rates
Abortion rate Probability or hazard rate for a female to have an abortiona
Parturition rate Probability or hazard rate for a female to have a parturition (delivery) Prolificacy rate Mean number of offspring (born alive + stillborn) per parturition Stillbirh rate Probability that an offspring is stillbornb
Female rate at birth Probability that an offspring born alive is a female
Mortality rate Probability or hazard rate for an animal to die from natural deathc
Management rates
Offtake rate Probability or hazard rate for an animal to exit the herd as offtake (slaughteringd, sales, loans, gifts, etc.)
Intake rate Probability or hazard rate for an animal to enter the herd as an intake (purchases, loans, gifts, etc.)
a An abortion is a gestation that is not carried out to the end, generating a non-viable offspring. b Stillbirths are not included in natural mortality.
c Natural deaths refer to all types of death except slaughtering. Emergency slaughtering, due to
accidents, diseases, etc. are considered as offtake and not as mortality.
Reproductive females Parturitions Abortions Births Single Twin Triplet etc. Born alive Females Males Stillborn Survivals Natural deaths (2) Parturition rate (1) Abortion rate (3) Prolificacy rate (4) Stillbirth rate Offtake Intakes (6) Mortality rate (7) Offtake rate (8) Intake rate (5) Rate of females at birth
Table 2: Examples of secondary demographic rates derived from the basic rates in Table 1.
Name Definition
Net prolificacy rate Average number of offspring born alive per parturition, calculated directly or by:
Prolificacy rate * (1 – Stillbirth rate)
Fecundity rate Average number of offspring (born alive or stillborn) per reproductive female a and year, calculated directly or by:
Parturition rate * Prolificacy rate
Net fecundity rate Average number of offspring born alive per reproductive female and year, calculated directly or by:
Parturition rate * Net prolificacy rate
a A female is considered as “reproductive” when it is older than a given age.
2.1.2. Meta-analysis Principle
A statistical meta-analysis was carried out on the data gathered in the Excel file dryland_west_central_africa_demog.xlsx. The objective was to estimate the averages values of the parameters and the levels of uncertainty affecting these estimates.
It is well known that the demographic parameters show large variations between years. As a simplification, between-years variations can be split to two alternative scenarios: (1) a scenario where variations are quite regular (the common “bad/medium/good” year scenario) and (2) a scenario where a major shock (e.g. a drought, an epizooty or a war) creates a strong drop in the parameters. The quantitative effects of shocks on the demographic parameters are strongly lacking in the literature ([20]) and could not be documented in this literature review. Therefore, the estimates calculated from this meta-analysis were assumed to
represent the average of the first scenario (between-years variations but no shocks). In
the World Bank study, this was referred to the “business as usual scenario” (BAU) assuming in particular the same precipitation pattern for the future (with no shock) as has occurred during the past.
The analysis focused on the natural demographic rates (reproduction and mortality) and the simplified herd structures (proportions of females and adult females in the herds). Offtake have not been considered since offtake rates data are too sparse in the literature, and generally badly reported, to be analyzed in a meta-analysis. Moreover, in the demographic projections carried out for estimating livestock productions, the offtake are often used as adjustment variables to reach an assumed annual population growth rate, given some values of natural rates and herd structure ([19]). The few data on offtake rates that have been collected in the Excel file can eventually be used a posteriori to assess the consistency between the literature and the results of the demographic simulations.
Analysis
The factors documented in the Excel file dryland_west_central_africa_demog.xlsx and accounted for in the statistical tests were
Species (variable species), for small ruminants, with two levels: CA = caprines, OV = ovines
Area (variable area), with two levels: A = arid (AI1-2-3), SA = semi-arid (AI4-5) Type of survey (variable typsurv2), with two levels: ABM3+ = longitudinal survey (in
particular animal monitoring) that have lasted at least three years, OTHER = all other types of surveys (longitudinal survey < 3 years, cross sectional retrospective surveys, etc.)
Age class (variable agecla2)
For cattle, three levels: JUV = 0 to 1 year, SAD = >1 to 4 years, ADU = > 4 years (in exact ages)
For small ruminants, two levels: JUV/SAD = 0 to 10 months, ADU = > 10 months
These variation factors and their interactions were tested with ANOVA F-tests. Since the small number of data in the sample could generate a lack of statistical power, the p-value used to consider a factor as significant was increased to 0.10 instead of the common p-value of 0.05.
For each parameter, the significant factors and eventual interactions were selected in a final ANOVA model that was used to estimate the average values. In complement to F-tests, the Akaike criterion corrected for small size samples (AICc, [21]) was used to confirm the adequacy of the final model to represent the data. Within a set of competing predictive statistical models, the model showing the lowest AICc is the best trade-off between bias and variance of the estimates. For simplification of the presentation, AICc results were not detailed in this note.
For cases where factor typsurv2 was significant, the analysis gave a priority to data ABM3+. In the literature, data ABM3+ are much sparser than data OTHER but much more reliable. For cases where factor typsurv2 was not significant, data ABM3+ were gathered to data OTHER to increase the statistical power of the tests and the accuracy of the estimations.
Based on the final selected ANOVA models, a 95% Student’s confidence interval (CI) was estimated for each parameter. In the present review, these CI were assumed to represent the uncertainty levels affecting the estimates. For a given parameter, the uncertainty percentage affecting its estimate was defined by
pct.u = 100 x (upper limit of the CI – estimate) / estimate. The uncertainty interval (UI) was defined by
UI = estimate (1 ± pct.u / 100)
The UI could then be injected in the herd growth model to estimate the uncertainties affecting the herd production outputs.
3. Results
3.1. Parturition3.1.1. Cattle
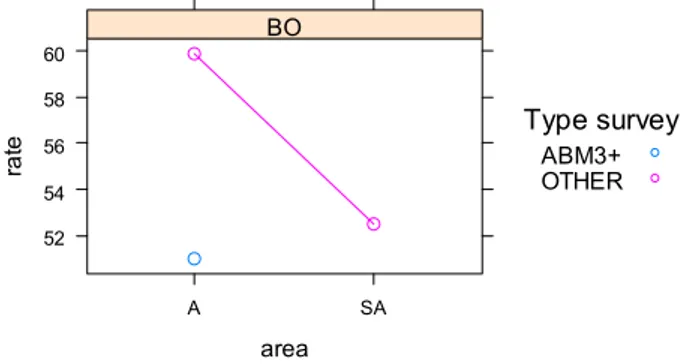
There were no data for the level-combination SA x ABM3+ (Figure 2). Therefore, models area + typsurv2 and area + typsurv2 + area:typsurv2 could not be tested directly.
Figure 2: Empirical averages of the parturition rate for cattle (/100 reproductive female-years). In a first step, the analysis focused on data from area A
u <- x[x$area == "A", ]
fm <- lm(rate ~ typsurv2, data = u) anova(fm)
Analysis of Variance Table Response: rate
Df Sum Sq Mean Sq F value Pr(>F) typsurv2 1 140.03 140.028 6.2278 0.02389 * Residuals 16 359.75 22.484
The factor typsurv2 was significant, which did not allow, in a second step, to gather data ABM3+ and OTHER to test factor area. A priority was given to data ABM3+. For area SA, the final estimate was given by
u <- x[x$typsurv2 == "ABM3+", ] fm <- lm(rate ~ 1, data = u)
res <- fpredict(fm, data = u, digits = 0) res
fit lwr upr pct.u 1 51 38 64 25
In the table above, column fit is the estimate of the rate based on the final ANOVA model, and columns lwr (for lower) and upr (for upper) are the limits of the 95% Student’s confidence interval (CI) of the estimate. Column pct.u represents the uncertainty percentage corresponding to the estimate, calculated by 100 (upr – fit) / fit (section 2.1.2).The same notations were used for this entire note.
From above, the average parturition rate for area A was estimated to h = 51/100 reproductive female-years, and the uncertainty interval was estimated to [38, 64]/100 reproductive female-years (uncertainty percentage of 25%).
The average parturition rate was not estimable for area SA (there were no data ABM3+). For this note, the SA rate was assumed equal to the rate estimated for area A. This seems
area ra te 52 54 56 58 60 A SA BO Type survey ABM3+ OTHER
consistent with the rates observed for data OTHER of this review (Figure 2), as well as with rates estimated from long-term data collected in sub-humid areas (for instance, in South Senegal, the average calving rate was estimated to 42/100 reproductive female-years over a 10-years animal based monitoring implemented by CIRAD and ISRA).
3.1.2. Small ruminants
From the empirical averages (Figure 3), the main variation factor seemed to be area. Effects of factors species and typsurv2 seemed less obvious.
Figure 3: Empirical averages of the parturition rate for small ruminants (/100 reproductive female-years).
The three factors and their 1-order interactions were tested as follows
fm <- lm(rate ~ (area + typsurv2 + species)^2, data = x) anova(fm)
Analysis of Variance Table Response: rate
Df Sum Sq Mean Sq F value Pr(>F) area 1 892.8 892.78 5.2757 0.03065 * typsurv2 1 198.2 198.17 1.1711 0.28994 species 1 360.2 360.24 2.1288 0.15752 area:typsurv2 1 294.5 294.55 1.7406 0.19952 area:species 1 34.1 34.09 0.2014 0.65760 typsurv2:species 1 2.3 2.33 0.0138 0.90760 Residuals 24 4061.4 169.22
Only factor area was significant. The final estimates were given by
fm <- lm(rate ~ area, data = x)
res <- fpredict(fm, data = x, digits = 0) res
area fit lwr upr pct.u 1 A 92 86 98 7 2 SA 103 96 111 8
3.2. Net prolificacy
3.2.1. Small ruminants
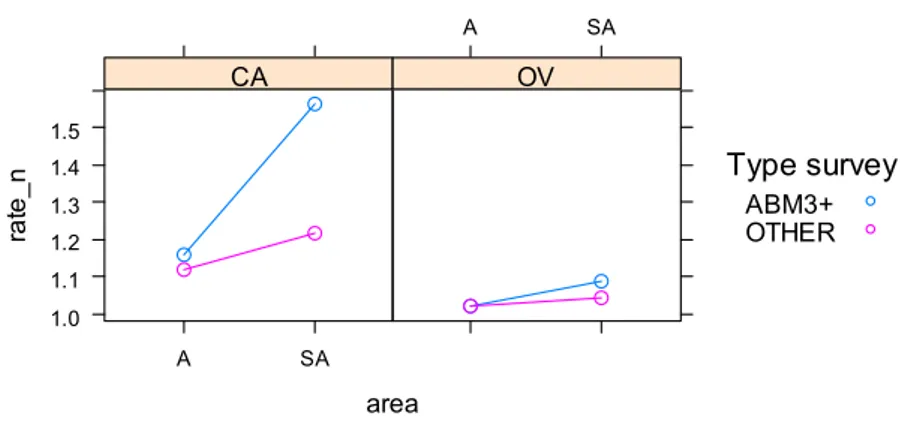
Empirical averages (Figure 4) showed large interactions between factors species, area and typsurv2. The highest differences between averages were observed between areas A and SA for data ABM3+.
area ra te 90 100 110 A SA CA A SA OV Type survey ABM3+ OTHER
Figure 4: Empirical averages of the net prolificacy rate for small ruminants. The three factors and their 1-order interactions were tested as follows
fm <- lm(rate_n ~ (area + typsurv2 + species)^2, data = x) anova(fm)
Analysis of Variance Table Response: rate_n
Df Sum Sq Mean Sq F value Pr(>F) area 1 0.104012 0.104012 20.7113 0.000110 *** typsurv2 1 0.060550 0.060550 12.0569 0.001820 ** species 1 0.226595 0.226595 45.1203 3.974e-07 *** area:typsurv2 1 0.048950 0.048950 9.7471 0.004368 ** area:species 1 0.047812 0.047812 9.5205 0.004777 ** typsurv2:species 1 0.036287 0.036287 7.2257 0.012371 * Residuals 26 0.130573 0.005022
All the interactions, in particular those involving typsurv2, were significant. After selecting data ABM3+, the tests became
u <- x[x$typsurv2 == "ABM3+", ]
fm <- lm(rate_n ~ (species + area)^2, data = u) anova(fm)
Analysis of Variance Table Response: rate_n
Df Sum Sq Mean Sq F value Pr(>F) species 1 0.155426 0.155426 20.2530 0.006398 ** area 1 0.136587 0.136587 17.7981 0.008338 ** species:area 1 0.062894 0.062894 8.1955 0.035292 * Residuals 5 0.038371 0.007674
Main effects and interactions were still significant. The final estimates were given by
fm <- lm(rate_n ~ (area + species)^2, data = u) res <- fpredict(fm, data = u, digits = 2) res
area species fit lwr upr pct.u 1 A CA 1.16 1.03 1.29 11 2 SA CA 1.56 1.40 1.72 10 3 A OV 1.02 0.87 1.18 16 4 SA OV 1.09 0.93 1.25 15 3.3. Mortality 3.3.1. Cattle
As for parturition, there are no data for the level-combinations SA x ABM3+, and interactions involving factor area (and subsequently factor area) could not be directly tested. From the
area ra te _n 1.0 1.1 1.2 1.3 1.4 1.5 A SA CA A SA OV Type survey ABM3+ OTHER
empirical averages (Figure 5), factor agecla2 seemed to have the largest effect. Other effects seemed very low.
Figure 5: Empirical averages of the mortality rate for cattle (/100 animal-years). In a first step, the analysis selected data from area A and tested factors agecla2 and typsurv2
u <- x[x$area == "A", ]
fm <- lm(h_y ~ (agecla2 + typsurv2)^2, data = u) anova(fm)
Analysis of Variance Table Response: h_y
Df Sum Sq Mean Sq F value Pr(>F) agecla2 2 2959.59 1479.79 29.1430 9.299e-08 *** typsurv2 1 0.38 0.38 0.0075 0.9315 agecla2:typsurv2 2 12.13 6.07 0.1195 0.8878 Residuals 30 1523.31 50.78
As expected from Figure 5, only factor agecla2 was significant. The non-significancy of typsurv2 enabled to gather data ABM3+ and OTHER to test factors agecla2 and area (without accounting for factor typsurv2), as follows
u <- x
fm <- lm(h_y ~ (agecla2 + area)^2, data = u) anova(fm)
Analysis of Variance Table Response: h_y
Df Sum Sq Mean Sq F value Pr(>F) agecla2 2 3168.9 1584.44 39.7350 2.062e-10 *** area 1 159.0 159.03 3.9882 0.05233 . agecla2:area 2 131.2 65.58 1.6445 0.20530 Residuals 42 1674.8 39.88
Both agecla2 and area were significant, but not their interaction. The final estimates were given by
fm <- lm(h_y ~ agecla2 + area, data = u) res <- fpredict(fm, data = u, digits = 0) res
agecla2 area fit lwr upr pct.u 1 JUV A 24 20 27 12 2 SAD A 7 4 10 43 3 ADU A 6 2 10 67 4 JUV SA 19 15 24 26 5 SAD SA 3 -2 7 133 6 ADU SA 2 -3 6 200 area h_ y 5 10 15 20 25 A SA JUV BO A SA SAD BO A SA ADU BO Type survey ABM3+ OTHER
3.3.2. Small ruminants
As for cattle, factor agecla2 seemed to be the main variation factor (Figure 6). However, a large interaction was observed from the empirical averages between factors area and typsurv2: for instance for data ABM3+, the rate increased from area A to area SA but this was the inverse for data OTHER.
Figure 6: Empirical averages of the mortality rate for small ruminants (/100 animal-years). The four factors and their 1-order interactions were tested by
fm <- lm(h_y ~ (agecla2 + species + area + typsurv2)^2, data = x) anova(fm)
Analysis of Variance Table Response: h_y
Df Sum Sq Mean Sq F value Pr(>F) agecla2 1 5874.8 5874.8 25.9253 5.412e-06 *** species 1 14.0 14.0 0.0620 0.80443 area 1 68.4 68.4 0.3017 0.58529 typsurv2 1 526.7 526.7 2.3242 0.13368 agecla2:species 1 55.0 55.0 0.2428 0.62436 agecla2:area 1 7.9 7.9 0.0349 0.85256 agecla2:typsurv2 1 182.5 182.5 0.8052 0.37384 species:area 1 70.3 70.3 0.3101 0.58009 species:typsurv2 1 3.8 3.8 0.0166 0.89791 area:typsurv2 1 1068.0 1068.0 4.7132 0.03471 * Residuals 50 11330.3 226.6
A priority was given to data ABM3+. The analysis selected data ABM3+ and re-tested factors agecla2, species and area
u <- x[x$typsurv2 == "ABM3+", ]
fm <- lm(h_y ~ (agecla2 + area + species)^2, data = u) anova(fm)
Analysis of Variance Table Response: h_y
Df Sum Sq Mean Sq F value Pr(>F) agecla2 1 1264.31 1264.31 11.4372 0.003322 ** area 1 356.53 356.53 3.2252 0.089318 . species 1 51.22 51.22 0.4633 0.504744 agecla2:area 1 56.89 56.89 0.5147 0.482329 agecla2:species 1 51.18 51.18 0.4630 0.504875 area:species 1 6.50 6.50 0.0588 0.811162 Residuals 18 1989.78 110.54 area h_ y 10 20 30 40 JUV/SAD CA A SA ADU CA A SA JUV/SAD OV 10 20 30 40 ADU OV ABM3+ OTHER
Only factors agecla2 and area were significant. The final estimates were given by
fm <- lm(h_y ~ agecla2 + area, data = u) res <- fpredict(fm, data = u, digits = 0) res
agecla2 area fit lwr upr pct.u 1 JUV/SAD A 25 19 31 24 2 ADU A 9 0 18 100 3 JUV/SAD SA 33 26 40 21 4 ADU SA 17 6 27 59
3.4. Herd structure
3.4.1. Proportion of females in the herd
Cattle
There were no data for the level-combinations SA x ABM3+. As before, interactions involving factor area (and subsequently factor area) could not be directly tested. From the empirical averages (Figure 7), factor agecla2 seemed to have the largest effect. Other effects seemed very low.
Figure 7: Empirical averages of the percentage of females in the herds (F_tot) for cattle. In a first step, the analysis selected data from area A and tested factor typsurv2
u <- x[x$area == "A", ]
fm <- lm(F_tot ~ typsurv2, data = u) anova(fm)
Analysis of Variance Table Response: F_tot
Df Sum Sq Mean Sq F value Pr(>F) typsurv2 1 2.84 2.844 0.0226 0.8841 Residuals 8 1005.56 125.694
The non-significancy of typsurv2 allowed to gather data ABM3+ and OTHER to test factor area (without accounting for factor typsurv2), as follows
u <- x
fm <- lm(F_tot ~ area, data = u) anova(fm)
Analysis of Variance Table Response: F_tot
Df Sum Sq Mean Sq F value Pr(>F) area 1 72.6 72.60 0.6562 0.4368 Residuals 10 1106.4 110.64 area F _t ot 62 64 66 68 A SA BO Type survey ABM3+ OTHER
Unlike what seemed to indicate Figure 7, factor area appeared to be non-significant (this result may be due to a lack of statistical power). The final estimates were given by
fm <- lm(F_tot ~ 1, data = u)
res <- fpredict(fm, data = u, digits = 0) res
fit lwr upr pct.u 1 68 61 74 9
Small ruminants
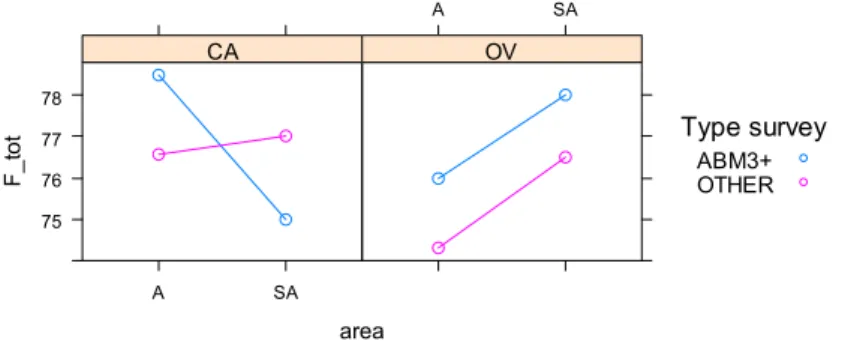
From the empirical averages (Figure 8), factors area and typsurv2 seemed to be the main variation factors, but the variations were low in absolute values (average F_tot ranged from 74% to 79%) and showed interactions. The eventual effect of factor species seemed very low.
Figure 8: Empirical averages of the percentage of females in the herds (F_tot) for small ruminants . The three factors and their 1-order interactions were tested as follows
u <- x
fm <- lm(F_tot ~ (area + species + typsurv2)^2, data = u) anova(fm)
Analysis of Variance Table Response: F_tot
Df Sum Sq Mean Sq F value Pr(>F) area 1 4.500 4.5000 0.4083 0.5313 species 1 13.376 13.3762 1.2137 0.2860 typsurv2 1 8.247 8.2470 0.7483 0.3991 area:species 1 13.207 13.2071 1.1983 0.2889 area:typsurv2 1 2.241 2.2411 0.2033 0.6577 species:typsurv2 1 0.900 0.9000 0.0817 0.7785 Residuals 17 187.362 11.0213
Interactions observed in Figure 8 appeared to be non-significant, as well all the main effects. The final estimates were given by
fm <- lm(F_tot ~ 1, data = x)
res <- fpredict(fm, data = x, digits = 0) res
fit lwr upr pct.u 1 76 75 77 1
3.4.2. Proportion of reproductive females in the herd
Cattle
As before, there are no data for the level-combinations SA x ABM3+. Empirical average F_A ranged from 35% to 39% (Figure 9).
area F _t ot 75 76 77 78 A SA CA A SA OV Type survey ABM3+ OTHER
Figure 9: Empirical averages of the percentage of reproductive females in the herds (F_A) for cattle.
In a first step, the analysis selected data from area A and tested factor typsurv2
u <- x[x$area == "A", ]
fm <- lm(F_A ~ typsurv2, data = u) anova(fm)
Analysis of Variance Table Response: F_A
Df Sum Sq Mean Sq F value Pr(>F) typsurv2 1 14 14.000 0.3818 0.5593 Residuals 6 220 36.667
The non-significancy of typsurv2 enabled to gather data ABM3+ and OTHER to test factor area (without accounting for factor typsurv2), as follows
u <- x
fm <- lm(F_A ~ area, data = u) anova(fm)
Analysis of Variance Table Response: F_A
Df Sum Sq Mean Sq F value Pr(>F) area 1 3.6 3.60 0.0941 0.7668 Residuals 8 306.0 38.25
Factor area was non-significant. The final estimates were given by
fm <- lm(F_A ~ 1, data = u)
res <- fpredict(fm, data = u, digits = 0) res
fit lwr upr pct.u 1 38 34 42 11
Small ruminants
From the empirical averages (Figure 10), the main variation factor seemed to be area. A slight interaction seemed to occur between factors area and typsurv2.
area F _A 35 36 37 38 39 A SA BO Type survey ABM3+ OTHER
Figure 10: Empirical averages of the percentage of reproductive females in the herds (F_A) for small ruminants.
The three factors and their 1-order interactions were tested by
u <- x
fm <- lm(F_A ~ (area + species + typsurv2)^2, data = u) anova(fm)
Analysis of Variance Table Response: F_A
Df Sum Sq Mean Sq F value Pr(>F) area 1 276.86 276.860 9.3940 0.009036 ** species 1 2.30 2.299 0.0780 0.784419 typsurv2 1 0.42 0.423 0.0143 0.906503 area:species 1 2.61 2.606 0.0884 0.770894 area:typsurv2 1 3.93 3.934 0.1335 0.720709 species:typsurv2 1 3.29 3.292 0.1117 0.743540 Residuals 13 383.14 29.472
Only factor area was significant. The final estimates are given by
fm <- lm(F_A ~ 1, data = x)
res <- fpredict(fm, data = x, digits = 0) res
area fit lwr upr pct.u 1 A 59 57 62 5 2 SA 51 47 55 8 area F _A 50 55 60 A SA CA A SA OV Type survey ABM3+ OTHER
4. Summary tables
Results of the estimates of the average CENV parameters and of the percentages of between-years variations are summarized in Table 3 and Erreur ! Source du renvoi introuvable. for natural rates and herd structures respectively.
Table 3: Summary of the average estimates and percentages of statistical uncertainty affecting the estimates (from literature review over areas A and SA of West- and Central Africa). (a) Natural rates, (b) Simplified herd structure.
(a)
(b)
Natural rates CENV
UI
Area Age class mean lwr upr pct.u
Parturition BO A-SA 51 38 64 25 CA-OV A 92 86 98 7 SA 103 96 111 8 Net prolificacy CA A 1.16 1.03 1.29 11 SA 1.56 1.40 1.72 10 OV A 1.02 0.87 1.18 16 SA 1.09 0.93 1.25 15 Mortality BO A JUV 24 20 27 13 SAD 7 4 10 43 ADU 6 2 10 67 SA JUV 19 15 24 26 SAD 3 0 7 133 ADU 2 0 6 200 CA-OV A JUV/SAD 25 19 31 24 ADU 9 0 18 100 SA JUV/SAD 33 26 40 21 ADU 17 6 27 59
Simplified herd structure CENV UI
Area Age class mean lwr upr pct.u
Proportion of females
BO A-SA 68 61 74 9
CA-OV A-SA 76 75 77 1
Proportion of reproductive females
BO A-SA 38 34 42 11
CA-OV A 59 57 62 5
5. Bibliography
[1] M. Lesnoff, “Finding demographic parameters of tropical livestock herds from the literature – A quick guideline,” CIRAD (French Agricultural Research Centre for International Development), Montpellier, France, 2013.
[2] CIRAD-IEMVT, “Définition des paramètres zootechniques concernant la reproduction, l’économie des troupeaux, l’économie du bétail de boucherie en élevage bovin, ovin, caprin,” CIRAD-IEMVT (Centre de Coopération Internationale en Recherche Agronomique pour le Développement, Institut d’Elevage et de Médecine Vétérinaire des pays Tropicaux), Maisons-Alfort, France, 1972.
[3] SEDES, Etude de la structure et de la dynamique des troupeaux bovins : méthodologie
pratique. Paris, France: Ministère de la Coopération, 1975.
[4] E. Landais and M. M. Sissokho, “Bases méthodologiques du contrôle des performances animales pour l’analyse zootechnique et démographique : collecte des données et choix des variables,” in Méthodes pour la recherche sur les systèmes d’élevage en Afrique
intertropicale. Etudes et synthèses no. 20, Maisons-Alfort, France: CIRAD-IEMVT (Centre
de Coopération Internationale en Recherche Agronomique pour le Développement, Institut d’Elevage et de Médecine Vétérinaire des pays Tropicaux), 1986, pp. 433–485. [5] R. T. Wilson, “Systèmes de production des petits ruminants en Afrique,” in Méthodes pour
la recherche sur les sytèmes d’élevage en Afrique intertropicale. Etudes et synthèses de l’IEMVT, 20, Maisons Alfort, France: IEMVT (Institut d’Elevage et de Médecine
Vétérinaire pour les pays Tropicaux), 1986, pp. 61–98.
[6] E. Mukasa-Mugerwa, A review of reproductive performance of female Bos Indicus (zebu)
cattle. Addis Ababa, Ethiopia: ILCA monograph no. 6, International Livestock Centre for
Africa, 1989.
[7] ILCA, Livestock systems research manual. Working Paper 1, Vol. 1. Addis Ababa, Ethiopia: ILCA (International Livestock Centre for Africa), 1990.
[8] P. Lhoste, V. Dollé, J. Rousseau, and D. Soltner, Manuel de zootechnie des régions chaudes -
Les systèmes d’élevage. Paris, France: Ministère de la Coopération, Collection Précis
d’Elevage, 1993.
[9] M. Lesnoff, R. Lancelot, and C. H. Moulin, Calcul des taux démographiques dans les cheptels
de ruminants domestiques tropicaux : approche en temps discret. Montpellier, France:
CIRAD (Centre de coopération internationale de recherche agronomique pour le développement), ILRI (International livestock research institute). Editions Quae, http://www.quae.com, 2007.
[10] M. Lesnoff, R. Lancelot, C.-H. Moulin, S. Messad, X. Juanès, and C. Sahut, Calculation of
demographic parameters in tropical livestock herds – A discrete time approach with LASER animal-based monitoring data. Montpellier, France: Editions Quae, http://www.quae.com, 2011.
[11] G. Tacher, “Notes sur la démographie bovine au Sahel : I. Représentation et projection théorique du troupeau par un modèle mathématique,” Rev. Elev. Med. vet. Trop., vol. 28, no. 4, pp. 547–569, 1975.
[12] E. Landais, “Un exemple d’utilisation d’une projection démographique pour l’analyse technico-économique d’un essai en milieu paysan : évaluation des pertes dues à la trypanosomose bovine dans la région de Khorogo (Côte d’Ivoire) et comparaison de 2
France: CIRAD-IEMVT (Centre de Coopération Internationale en Recherche Agronomique pour le Développement, Institut d’Elevage et de Médecine Vétérinaire des pays Tropicaux), 1986, pp. 487–496.
[13] M. Upton, “Livestock productivity assessment and herd growth models,” Agric. Syst., vol. 29, pp. 149–164, 1989.
[14] M. Upton, “Livestock productivity assessment and modelling,” Agric. Syst., vol. 43, no. 4, pp. 459–472, 1993.
[15] M. Lesnoff, “Dynamics of a sheep population in a Sahelian area (Ndiagne district in Senegal): A periodic matrix model,” Agric. Syst., vol. 61, pp. 207–221, 1999.
[16] M. Lesnoff, R. Lancelot, E. Tillard, and I. R. Dohoo, “A steady-state approach of benefit-cost analysis with a periodic Leslie-matrix model. Presentation and application to the evaluation of a sheep-diseases preventive scheme in Kolda, Senegal,” Prev. Vet. Med., vol. 46, no. 2, pp. 113–128, 2000.
[17] M. Lesnoff, R. Lancelot, E. Tillard, and B. Faye, “Analyse comparative de la productivité des cheptels de petits ruminants en élevage extensif tropical : une nouvelle approche par les modèles matriciels en temps discret,” Rev. Elev. Méd. vét. Trop., vol. 54, no. 1, pp. 69– 80, 2001.
[18] M. Lesnoff, DYNMOD: A spreadsheet interface for demographic projections of tropical
livestock populations - User’s Manual - v3. Montpellier, France: CIRAD (French
Agricultural Research Centre for International Development), ILRI (International Livestock Research Institute). http://livtools.cirad.fr, 2013.
[19] M. Lesnoff, Simulating dynamics and productions of tropical livestock populations –
mmage: A R package for discrete time matrix models. Montpellier, France: CIRAD (French
Agricultural Research Centre for International Development). http://livtools.cirad.fr, 2013.
[20] M. Lesnoff, C. Corniaux, and P. Hiernaux, “Sensitivity analysis of the recovery dynamics of a cattle population following drought in the Sahel region,” Ecol. Model., vol. 232, pp. 28– 39, 2012.
[21] K. P. Burnham and D. R. Anderson, Model selection and multi-model inference: a practical
information-theoretic approach. New York: Springer, 2002.
[22] R Development Core Team, R: A Language and Environment for Statistical Computing. Vienna, Austria, 2013.
6. Annex
6.1. Sources used for the literature review (meta-analysis)
Ba, A., 2011. Exploitation du cheptel bovin dans la zone cotonnière au Mali-Sud (Thèse de Doctorat). Montpellier SupAgro, Montpellier, France.
Ba, A., Lesnoff, M., Moulin, C.H., 2011. Demographic dynamics and off-take of cattle herds in south Mali. Trop. Anim. Health Prod. 43, 1101–1109. doi:10.1007/s11250-011-9808-2
Ba Diao, M., Fall, A.A., Sall, C., Diaw, O.T., 2006. Influence de la complémentation alimentaire et du déparasitage interne sur le développement économique de la production laitière des vaches Gobra en zone sahélienne du Sénégal. Tropicultura 24, 51–57.
Béchir, A., Grimaud, P., Kaboré-Zoungrana, C., 2010. Facteurs de variation du poids vif et de l’état corporel du zébu Arabe en zone soudanienne du Tchad. Sciences & Nature 7. doi:10.4314/scinat.v7i2.59955
Bonfoh, B., Sall, A., Diabaté, M., Diarra, A., Netoyo, L., Yade, M., Alfaroukh, O.I., Farah, Z., Zinsstag, J., 2003. Viabilité du système extensif de production et de collecte de lait dans la ceinture laitière de Bamako. Presented at the Séminaire sous-régional “Lait sain pour le Sahel - Production, approvisionnement, hygiène et qualité du lait et des produits laitiers au Sahel,” LCV Mali et Institut Tropical Suisse, Bamako, Mali, pp. 20–20.
Bonfoh, B., Fokou, G., Ould Taleb, M., Fané, A., Woirin, D., Laimaibao, N., Zinsstag, J., 2007. Dynamiques des systèmes de production laitière, risques et transformations socio-économiques au Mali. Revue d’Elevage et de Médecine vétérinaire des Pays Tropicaux 60, 67– 76.
Breman, H., Diallo, A., Traore, G., Djiteye, M.M., 1978. The ecology of the annual migrations of cattle in the Sahel. Presented at the First international rangeland congress, pp. 592–595. CIPEA/IER, 1978. Evaluation des productivités des races bovines maures et peul à la station du Sahel, Niono. Monographie no. 1. CIPEA (Centre International Pour l’Elevage en Afrique) (Addis Abeba, Ethiopie), IER (Institut d’Economie Rurale du Mali) (Niono, Mali).
Coulibaly, M., Nialibouly, O., 1998. Effect of suckling regime on calf growth, milk production and offtake of zebu cattle in Mali. Trop. Anim. Health Prod. 30, 179–189. doi:10.1023/A:1005063720733
Chartier, P., Laoualy, A., Planchenault, D., 1982. Estimation des différents paramètres génétiques de la croissance pondérale chez le zébu Azaouak. Rev. Elev. Méd. vét. Trop. 35, 413–420.
De Leeuw, P.N., Wilson, R.T., 1987. Comparative productivity of indigenous cattle under traditional management in sub-saharan Africa. Quart. J. Int. Agric. 26, 377–390.
Denis, J.P., Valenza, J., 1970. Comportement pondéral des femelles adultes de race Gobra (zébu peuhl sénégalais). Comparaison avec les animaux importés pakistanais et guzerat. Rev. Elev. Méd. vét. Trop. 23, 229–241.
Denis, J.P., 1971. L’intervalle entre les vêlages chez le zébu Cobra (Peuhl sénégalais). Revue d’Elevage et de Médecine vétérinaire des Pays Tropicaux 31, 635–647.
Denis, J.P., 1973. Extériorisation des potentialités du zébu Gobra. Synthèse des résultats. Revue d’Elevage et de Médecine vétérinaire des Pays Tropicaux Volume Spécial, 229–232. Diop, P.E.H., 1997. Production laitière en Afrique sub-saharienne : problématiques et stratégies. Cahiers Agricultures 6, 213–224.
Edima, H., 2014. Dairy Farm Breeding Practices and Milk Production in the Sudano Guinean and Sudano Sahelian Zones of Cameroon. Journal of Scientific Research and Reports 3, 1656– 1664. doi:10.9734/JSRR/2014/9800
Gallais, J., 1967. Le delta intérieur du Niger : étude de géographie régionale. IFAN, Dakar, Sénégal.
Hiernaux, P., Turner, M.D., Fernandez-Rivera, S., 2006. Influence of the farm type and the propriety status of the animals on the herd composition and reproductive performances of cattle, sheep and goats. Unpublished manuscript. ICRISAT/ILRI.
Jorat, T., 2011. Simulations de dynamiques de cheptels bovins après une sécheresse au Sahel en fonction des types d’exploitations pastorales : cas du Ferlo au Sénégal. Mémoire de master
Kudi, A.C., Umoh, J.U., Eduvie, L.O., Gefu, J., 1998. Relative survival of calves in 16 traditionally managed herds in Bauchi, Nigeria. Preventive Veterinary Medicine 36, 307–312. doi:10.1016/S0167-5877(98)00083-X
Lacrouts, M., Sarniguet, J., Tyc, J., 1965. Exploitation du cheptel bovin au Mali. Ministère du Développement.
Lesnoff, M., Saley, M., Adamou, K., N’Djaffa, H., 2007. Enquête démographique 2006 sur le cheptel domestique au Niger : sites du Fakara, de Gabi et de Zermou. Rapport préliminaire. Projet “Amélioration des conditions de vie des producteurs sahéliens à travers la mise en œuvre d’outils bioéconomiques d’aide à la décision” (PAD), ICRISAT-Niamey, DGCD-Belgique. ILRI (International Livestock Research Institute).
Lesnoff, M., 2015. Uncertainty analysis of the productivity of cattle populations in tropical drylands. animal 1–9. doi:10.1017/S175173111500124X
Millogo, V., Ouedraogo, G.A., Agenauml, S., A, S., Svennersten-Sjaunja, K., 2008. Survey on dairy cattle milk production and milk quality problems in peri-urban areas in Burkina Faso. AJAR 3, 215–224.
Mukasa-Mugerwa, E., 1989. A review of reproductive performance of female Bos Indicus (zebu) cattle. ILCA monograph no. 6, International Livestock Centre for Africa, Addis Ababa, Ethiopia.
Ndambi, O.A., Hemme, T., Latacz-Lohmann, U., 2007. Dairying in Africa - Status and recent developments. Livestock Research for Rural Development 19.
Ndione, F.C., Agbangba, E.C., Ndiaye, O., Sane, I., Diouf, A., Diop, A.T., 2014. Effects of protein and mineral supplementation on the performance of lactating dairy cows gobra and crossbreed guzerat during the dry season in senegal. Open Journal of Animal Sciences 04, 18– 22. doi:10.4236/ojas.2014.41003
Nuru, S., Dennis, S.M., 1976. Abortion and reproductive performance of cattle in Northern Nigeria: A questionnaire survey. Tropical Animal Health and Production 8, 213–219.
OMBEVI, 1978. Etude du troupeau de la région de Mopti (ODEM). Division statistique.
OMBEVI/IER, 1974. Enquête sur les effets de la sécheresse au Mali. Manuscript non publié. IER (Institut d’Economie Rurale du Mali) (Niono, Mali).
Otte, M.J., Chilonda, P., 2002. Cattle and small Ruminant production systems in sub-Saharan Africa - A systematic review. FAO, Rome, Italia.
Pradère, J.F., 2007. Performances et contraintes de l’élevage au Mali. Projet d’Appui à l’Agriculture Africaine (P3A) au Mali. MAE (Ministère des Affaires Etrangères), Paris, France. Pradère, J.F., Sidibe, S., 1989. Etude du cheptel bovin malien. Evolution, structure des troupeaux, productivité. Projet d’Appui à l’Agriculture Africaine (P3A) au Mali. Cellule de suivi-évaluation, Direction Nationale de l’Elevage, Bamako, Mali.
Sall, A., 2002. Evaluation de la viabilité des systèmes de production et de collecte de lait de vache dans la ceinture laitière de Bamako. Mémoire de Zootechnie. IPR/IFRA, Bamako, Mali. Sangaré, 1983. Phase exploratoire d’une étude des systèmes de production animale dans le Gourma malien : données de base sur le cheptel bovin. Document de programe No. AZ92d. ILCA (International Livestock Centre for AFrica), Bamako, Mali.
Sarniguet, J., de Mieulle, J.E., Blanc, P., Tyc, J., 1975. Approvisionnement en viandes de l’Afrique de l’ouest. Tomes I-IV. SEDES, Paris, France.
Shapiro, K.H., 1979. The livestock economys in Africa: an overview, in: Livestock Production and Marketing in the Entente States of West Africa. Summary Report. University of Michigan, USA.
SEDES, 1972. Projet de développement de l’élevage dans la région de Mopti. Rapport de synthèse.
SEDES, 1975a. Approvisionnement en viandes de l’Afrique de l’ouest. Tome I-IV.
SEDES, 1975b. Etude de la structure et de la dynamique des troupeaux bovins : méthodologie pratique. Ministère de la Coopération, Paris, France.
Seydou, B., 1981. Contribution à l’étude de la production laitière du zébu azawak au Niger. Université de Dakar, Dakar, Sénégal.
Sidibé-Anago, A.G., Ouedraogo, G.A., Ledin, I., 2008. Effect of season and supplementation during late pregnancy and early lactation on the performance of Zebu cows and calves. African Journal of Agricultural Research 3, 640–646.
Sow, R.Z., Denis, J.P., Trail, J.C.M., Thiongane, P.I., Mbaye, M., Diallo, I., 1988. Productivité du Zébu Gobra au centre de Recherche Zootechnique de Dahra (Sénégal). Etude et document (No. Vol. 1. N° 2). CRZ, Dakar, Sénégal.
Tacher, G., 1975a. Notes sur la démographie bovine au Sahel : I. Représentation et projection théorique du troupeau par un modèle mathématique. Rev. Elev. Med. vet. Trop. 28, 547–569. Tacher, G., 1975b. Notes sur la démographie bovine au Sahel : II. Représentation et projection théoriques du troupeau par un modèle mathématique après une catastrophe. Rev. Elev. Méd. vét. Trop. 28, 571–595.
Thiongane, A.J., Denis, J.P., 1974. Le programme de sélection du zebu Gobra au Sénégal. Résultats acquis. Presented at the 1er Congrés mondial de génétique appliqué à l’élevage, Madrid, 7-11 oct. 1974, p. 14.
Tourrand, J.F., 2000. L’élevage dans la révolution agricole au Waalo, delta du fleuve Sénégal. CIRAD (Centre de Coopération Internationale en Recherche Agronomique pour le Développement), Montpellier, France.
Traoré, A., Wilson, R.T., 1988. Livestock production in Central Mali: environmental and pathological factors affecting morbidity and mortality of ruminants in the agro-pastoral system. Prev. Vet. Med. 6, 63–75.
Turner, M.D., 1999. Merging local and regional analyses of land-use change: the case of livestock in the Sahel. Annals of the Association of American Geographers 89, 191–219.
Van de Putte, J., 1977. Production, consommation et exportation de viande bovine et ovine/caprine au Mai et projections, 1974-1990. Document no. 96. FAO/PNUD/OMBEVI. Van Raay, H.G.T., 1975. Rural planning in a savanna region. Rotterdam University Press. Vias Franck, S.G., Bonfoh, B., Diarra, A., Diabaté, M., Naferi, A., Faye, B., 2003. Les élevages laitiers bovins dans la communauté urbaine de Niamey : Caractéristiques, production, commercialisation et qualité du lait. Presented at the Séminaire sous-régional “Lait sain pour le Sahel - Production, approvisionnement, hygiène et qualité du lait et des produits laitiers au Sahel,” LCV Mali et Institut Tropical Suisse, Bamako, Mali, pp. 29–29.
Voh jr . A.A., Otchere, E.O., 1989. Reproductive performance of Zebu cattle under traditional agropastoral management in northern Nigeria. Animal Reproduction Science 19, 191–203. doi:10.1016/0378-4320(89)90092-4
Wagenaar, K.T., Diallo, A., Sayers, A.R., 1986. Productivity of transhumant Fulani cattle in the inner Niger delta of Mali. ILCA Research Report no. 13. ILCA (International Livestock Centre for Africa), Addis Ababa, Ethiopia.
Wilson, R., 1985. Livestock production in central Mali: Reproductive aspects of sedentary cows. Animal Reproduction Science 9, 1–9.
Wilson, R.T., 1983a. Production animale dans le système agro-pastoral, in: Wilson, R.T., de Leeuw, P.N., de Haan, C. (Eds.), Recherches Sur Les Systèmes Des Zones Arides Du Mali : Résultats Préliminaires. CIPEA Rapport de Recherche No. 5. CIPEA (Centre International pour l’Elevage en Afrique), Addis Abeba, Ethiopie, pp. 63–94.
Wilson, R.T., 1983b. Studies on the livestock of Southern Darfur, Sudan. VIII. A comparison of productivity indices for goats and sheep. Tropical Animal Health and Production 15, 63–68. Wilson, R.T., 1986a. Livestock production in central Mali: long-term studies on cattle and small ruminants in the agropastoral system. ILCA Research Report no. 14. ILCA (International Livestock Centre for Africa), Addis Ababa, Ethiopia.
Wilson, R. T, 1989. Livestock production in central Mali: economic characters and productivity indices for Sudanese Fulani cattle in the agro-pastoral system. Trop. Agric. (Trinidad) 66, 49– 53.
Wilson, R.T., de Leeuw, P.N., de Haan, C. (Eds.), 1983. Recherches sur les systèmes des zones arides du Mali : résultats préliminaires. CIPEA Rapport de recherche no. 5. CIPEA (Centre International pour l’Elevage en Afrique), Addis Abeba, Ethiopie.
Wilson, R.T., Wagenaar, K.T. (Eds.), 1983. An introductory survey of livestock population demography and reproductive performance in the area of the Niger Range and Livestock Project. Arid Zone Programme Document No. AZ 80. ILCA (International Livestock Centre for Africa), Bamako, Mali.
Wundersee, W.Y., 1971. Voies visant à l’amélioration des races bovines locales en République du Mali. Sotuba.
Wymann, M.N., Bonfoh, B., Schelling, E., Bengaly, S., Tembely, S., Tanner, M., Zinsstag, J., 2006. Calf mortality rate and causes of death under different herd management systems in peri-urban Bamako, Mali. Livestock Science 100, 169–178. doi:10.1016/j.livprodsci.2005.08.010