Porous Filter Optimization to Improve the Safety
of the Medium-Voltage Electrical Installations
During an Internal Arc Fault
David Rochette, Stéphane Clain, William Bussiére, Pascal André, and Charles Besnard
Abstract—Electrical power distribution equipment, such as medium-voltage (MV) switchgear, must be designed to withstand the pressures and temperatures of gases resulting from an internal arcing fault. An original way to limit the external effects of the arc consists in channeling downward the gas flow across a filter composed of a granular porous medium in order to absorb the abrupt pressure wave and to cool the hot gas flow. In this paper, we propose an optimization of the MV switchgear configuration to enhance the porous filter efficiency where we manage to strongly reduce the external manifestations of the arc fault. On one hand, we employ the numerical simulation tool lying on a physical model where the major events are taken into account. On the other hand, real experimental tests have been performed according to the IEC standards and pressure and temperature histories obtained by numerical simulation are compared with the experimental measurements.
Index Terms—Finite volumes, internal arc fault, medium-voltage (MV) cubicle, nonconservative system, porous filter, sim-ulation.
I. INTRODUCTION
A. Safety of Electrical Equipment
D
ESPITE the continuous optimization effort to increase safety of electrical switchgear, critical electrical accidents occur during operations. Although the occurrence of an arcing fault inside medium-voltage (MV) switchgear leading to per-sonal injury or material damaging is extremely rare, it cannot be completely disregarded. Associations, such as the International Electrotechnical Commission (IEC) are specifying the require-ments for new safety features in switchgear in order to minimize the arcing fault effects. These specifications or testing proce-dures, summarized in a common set of guidelines of the IECManuscript received November 21, 2008; revised March 26, 2010. Date of publication August 23, 2010; date of current version September 22, 2010. Paper no. TPWRD-00874-2008.
D. Rochette and P. André are with the Laboratoire Arc Electrique et Plasmas Thermiques, Clermont Université, Université Blaise Pascal, Clermont-Ferrand F-63000, France.
S. Clain is with the Institut de Mathématiques, CNRS UMR 5219, Université Paul Sabatier Toulouse 3, Toulouse 31062, France.
W. Bussíere is with the Laboratoire Arc Electrique et Plasmas Thermiques, Clermont Université, Université d’Auvergne, Clermont-Ferrand F-63000, France.
C. Besnard is with the Schneider Electric (Direction de l’innovation), Grenoble 38050, France.
Color versions of one or more of the figures in this paper are available online at http://ieeexplore.ieee.org.
Digital Object Identifier 10.1109/TPWRD.2010.2050606
standard [1], provide a number of criteria aimed at the assess-ment ability of an installation to limit the risk of personal injury in the event of an internal arc fault. Electrical power distribution equipment has to be designed to withstand the pressures and temperatures of gases associated with an internal arcing fault.
B. Arc Fault
Arc faults within MV switchgear usually start as a phase-to-ground fault and very quickly a three-phase fault occurs. This electrical accident can be provoked by a large number of factors, including:
• defective or aging insulating materials; • poor bus or cable connections; • poor maintenance;
• human error;
• presence of moisture, dust, or vermin; • improper bus joints;
• incorrect protective/safety devices.
An internal arcing fault in switchgear is developed in a few mil-liseconds and a huge amount of energy blows up (several mega-joules over the typical 1-s test duration). The total energy dissi-pated by the arc is proportional to the square of the short-circuit current and the arc duration , hence proportional to , and the resulting damage mainly depends on the two characteristics parameters.
Electrical experience with gas-insulated switchgears shows that a wide panel of physical processes occurs when an arc fault occurs in this equipment, and a short description of the explo-sion history is as follows.
• Stage 1 is the compression phase which begins at the initial time 0 s when the arc is initiated.
• The air surrounding the arc is thereby heated up to tem-peratures of several thousand Kelvins while the pressure increases to a maximum internal pressure controlled by a gauged safety valve.
• Stage 2 is the expansion phase which begins when the maximum pressure has been reached and the safety valve bursts, causing the sudden gas ejection outside the sealed container. A strong shock wave is generated and propa-gates toward the filter in a few milliseconds.
• Stage 3 is the emission phase. The hot gas flow generated by the arc goes outside the metal tank, producing particles and dust. This phase typically lasts from 50 to 100 ms fol-lowing cubicle dimensions.
• Stage 4 is the thermal phase in the explosion process and goes on until the arc is extinguished. An increasing part
of the energy is consumed by heating, melting, as well as evaporating electrodes and cladding material. Toxic com-ponents (from insulation and other materials) and vapor-ized metal particles may be present in the ejected gas. Since the high-temperatures range is between 10 000 K and 20 000 K in the plasma core, a portion of the en-ergy is employed in dissociation and ionization of the gas molecules while another part contributes to the thermal ra-diation, heating the surrounding material.
C. Models
Internal arc testing of MV switchgear requires great exper-imental, technical, and financial efforts which motivate lower costly investigations tools based on numerical simulations. In the past, investigations on the MV switchgear focused on the internal arc pressure assessment using an analytical calculation method [2]–[4]. Older methods were based on a simplified en-ergy balance of the arc fault where the authors assume that only a few parts of the electrical energy dissipated by the arc column generate the overpressure. These methods are too poor and cannot be generalized for various geometries of equipment. More recently, theoretical methods based on computational fluid dynamics (CFD) methods have been worked out to de-scribe the pressure wave and the gas flow, taking into account more complex parameters, such as the exact switchgear geom-etry [5]–[11]. The CFD modeling has been updated in recent studies where the thermal transfer as radiation [9], [10] and the vaporization of the electrodes [12] have been investigated, enabling the determination of gas temperature distribution and a good assessment of the internal pressure everywhere in the device.
New concepts have been introduced to improve the switchgear safety. A porous filter located at the bottom of the MV switchgear [13] has been tested to satisfy the IEC re-quirements. Numerical simulation tools based on the gas-flow model in porous media have been carried out in [14] and [15] to evaluate the filter impact on the gas temperature (cooling) and the pressure wave (reducing the gas velocity). The simulation was set up with a simplified arc model where the lighting arc is represented with source terms: electrical power and mass are injected in a small volume fraction of the cubicle where the electric arc is supposed to expand.
In this paper, we present experimental and numerical inves-tigations on internal arcs where the MV switchgear integrates a porous filter. The filter has been designed with numerical tools in order to limit the external manifestations of the internal arc fault. We employ a numerical method based on a fractional step technique where we use a specific finite volume solver for gas flow in porous media [16]. The organization of this paper is as follows. In Section II, we present the MV switchgear and the computational domain used in simulations and we present in Section III the experimental measurements. Section IV is de-voted to the presentation of the governing equations to model the arc fault and the gas flow in porous medium. We briefly recall the numerical method we employ to obtain an approximation of the nonconservative system solution. Section V deals with the
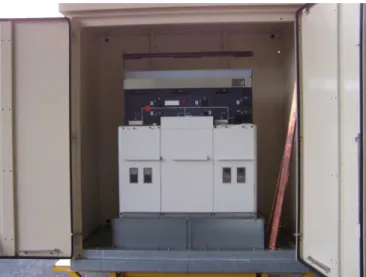
Fig. 1. MV cubicle photo from a test setup.
comparisons between experimental data and numerical simula-tions results.
II. GEOMETRY OF THEMV CUBICLE
Fig. 1 shows the front view of the tested MV switchgear. The test setup is consists of an enclosed cubicle, which con-tains the electrical apparatus, filling at the atmospheric pressure of an insulating gas. According to IEC recommendations, air is employed during the test whereas the commercial apparatus is filled with to increase the dielectric coefficient.
Fig. 2 shows a schematic sectional view of the MV cubicle geometry. The switchgear is divided in five compartments as follows.
1) The sealed metal tank, containing the current interruption device, is the location where an internal arc fault may be initiated.
2) The buffer area separates the metal tank equipped with a safety valve gauged at a limit pressure. The bursting of the valve limits the overpressure and avoids the cubicle destruction.
3) The porous filter, composed of a deformable granular medium fixed by metallic grids. The porosity is about 0.6 with 8-mm mean diameter particles. The porous medium characteristics are chosen so that the filter limits the over-pressure below and drastically cools the hot gases. 4) The connection compartment contains the cables feeding
the current to the equipment. It communicates with the filter (no separation between both compartments). 5) The exhaust duct where the hot gases are ejected to the
exterior (uncritical regions).
In addition, we indicate in Fig. 2 the position of the sensors we employ in the experimental setup: (tank pressure), (buffer pressure), (buffer temperature), cm, cm (temperature of the porous filter with 5- and 10-cm depths) and (exhaust temperature). Of course, history curves coming from numerical simulations are extracted at the same location points. In addition, we indicate two numerical sensors (arc temperature) and (valve temperature).
Fig. 2. Sectional view of MV switchgear with compartment dimensions and locations of the pressure and temperature sensors.
III. EXPERIMENTALTESTS FOR THEMV SWITCHGEAR
A. Electrical Setup
The internal arc tests are carried out following the specifica-tions of the IEC standards [1]. The arc fault was performed with 20-kA current over 1 s (the nominal operating current is 630 A for such an apparatus). It stands for a short-circuit current value 30 times higher than the nominal current.
The arc is ignited in the metal tank by a thin copper wire between the active parts of the short-circuited CB device. As soon as the high current is flowing through, the wire is instan-taneously melted and an arc comes out between phases and re-mains as long as the current is maintained (i.e., 1 s in the test).
The arc plasma is essentially resistive where a voltage drop of 300 V takes place between the short-circuited phases. The elec-trical power, induced by the high current value and the arc resis-tance, reaches huge values (more than 10 MW). This high power can only be provided over 1 s by the power station laboratory.
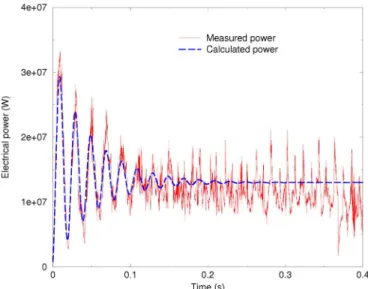
Fig. 3 shows the phase current and voltage recordings. The current root mean square (rms) value has to be maintained to 20 kA during the entire test. Consequently, the current peak value on the asymmetric phase of the three phases system reaches 50 kA. No phase difference between the voltage and current curves confirms the predominant resistive behavior of the electric arc. Adding the three phases, the total electrical power is given in Fig. 4 and time integration over the test duration provides an injected energy amount around 15 megajoules.
B. Pressure and Temperature Recordings
Pressure rise was measured at different locations (metal tank, buffer, and connection compartment) on the tested cubicle with transducers. Pressure indications are useful to obatin informa-tions on the mechanical stress undertaken by the compartments of the cubicle, especially during the very beginning of the test (stages 1-2-3). According to the IEC standards, the apparatus has to withstand the internal pressure load, and the switchgear structure must be preserved and mechanical deformations limited.
Another requirement is to control the hot gas flow during the arc fault in order to avoid any personal injury around the
ap-Fig. 3. Phase current (dashed line) and voltage (solid line) recorded in the test.
Fig. 4. Electrical power obtained by measurement and by interpolation.
paratus. Thermal indicators are placed at locations defined by the standard to validate these criteria. Moreover, we set up in this test an extra measurement of temperature of the gas, using fast K-type thermocouples whose time responses are between 5 and 20 ms, quite adapted to the evolution of the thermal rise. The thermocouples are located far enough from the arc location to measure temperature in their nominal functional range (be-tween 300 and 1500 K). In this experiment, they were placed in the buffer, in the exhaust duct, and inside the filter.
IV. MATHEMATICALMODELING ANDNUMERICALMETHOD
A mathematical model for a gas flow generated by arc faults in MV switchgears has been developed in [14] in the 1-D frame-work and its extension for 2-D geometries has been proposed in [15]. We briefly recall the set of equations used to describe the process. The model is based on the compressible gas equations where the porosity function is integrated in the model as a new variable, allowing us to treat the gas and the porous medium areas with the same model structure (i.e., the air is seen as a porous medium of porosity equal to one). Specific source terms,
such as heat or mechanical transfers, are added in the areas where the porosity is lower than one while energy and mass in-jection are prescribed in the plasma zone. In the 2-D situation, the governing equations write
(1) with the notations
where represents the vector of the conservative variables, and are the flux vectors with respect to space vari-ables and , represents the nonconservative term taking the porosity variation into account, and rep-resents the source terms (mechanical and thermal transfers, en-ergy and mass injected).
The notation is classical: is the gas density, the velocity components, is the pressure, is the porosity, and is the total energy per unit volume given by
with being the specific internal energy and
being the norm velocity field. In addition, to close the system, we use the ideal gas equation of state where
denotes the ratio of specific heats, and the gas temperature is obtained by a function , taking into account the dissociation and the ionization of the gas.
We now present the source term we use in the model. We refer to [14] and [15] for a detailed description of the source term expressions and their impact on the flow.
• The internal arc effects are modelled with a volume heat source and a volume mass source prescribed in the electric arc zone where the electric arc power is directly deduced from the measured electrical power while is the volume where the arc is assumed to ex-pand. In fact, only an energy fractional part (called the thermal transfer coefficient) contributes to the air heating and represents the fraction of the electric power we prescribe in the energy equation where coefficient is de-duced from the experimental test. On the other hand, the mass source term representing the vaporized material is as-sumed to be directly proportional to electric energy and we
set where is the vaporized
mass coefficient per Joule.
• The mechanical interactions between the gas flow and the porous medium are modelled with the Darcy force (linear load loss) and Forchheimer force (singular load loss). • The thermal transfer in the porous filter is evaluated in
function of the differential between the gas temperature and the porous medium temperature with an expression of the form where the coefficient mainly depends on the flow velocity.
• The radiation losses are evaluated by the net emissive co-efficient technique where we assume that the plasma is a homogeneous ball or cylinder.
To deal with the numerical approximation, we provide a short description of the finite volume method we use to solve the non-conservative Euler system. We consider a conforming unstruc-tured mesh of the 2-D domain , composed of triangles (or
cells) , . We denote by the index set
of the neighbouring triangles which share a common edge with the cell and by the external unit normal vector from cell .
Let be a uniform subdivision of the time interval that we aim to compute a constant piecewise approximation of the solution on each cell . To this end, represents an approximation of the average of on at time and we solve the nonconservative system without source terms (i.e., without ) by using the general finite-volume scheme (2)
where is a numerical flux proposed in [16] specifically de-signed for nonconservative problems.
Finally, the global algorithm reads: assume that we know an approximation for all at time :
• we compute a new approximation at time with (2);
• we integrate the source term with a Runge–utta method to evaluate the solution at time ; for example, the simple forward Euler scheme gives
V. COMPARISONBETWEENNUMERICALSIMULATIONS AND
EXPERIMENTALDATA
A. Optimized Cell
We have carried out several series of numerical simulations in order to design an optimal porous filter which respects tech-nical and economical constraints. The first issue we have ad-dressed consists in testing three porous filter geometries where we have modified the height following the -direction (see Fig. 2): namely, 120, 180, and 260 mm. We have observed that the filter size has no impact on the metal tank pressure but the gas temperature and velocity at the exhaust level are two three times more important with the 120-mm-high filter than the 260-mm-high filter. Moreover, the incident shock wave generated by the safety valve bursting reaches the side wall situated under the
porous media after crossing the 120-mm filter and generates a reflected wave. This phenomenon is not observed with the other filters.
The second series of numerical tests concerns the grain di-ameter since it has a strong impact on the permeability and the porosity of the filter. The 8-, 15-, and 30-mm grain size filters have been numerically simulated where the porosity, the Darcy, and Forchheimer coefficients have been evaluated in function of the particle size. With the finest grain configuration, the heat transfer is more efficient since the gas velocity is lower and the fluid remains in contact with the cold medium for a longer time. The major drawback of fine porous media is the heavy reflected pressure wave resulting from the valve opening (sometime twice the incident pressure wave). Such a reflected wave can damage the tank enclosure and leads to the apparatus explosion. We have also performed simulations with two porous media layers with different porosity (the higher porous one is above) and we suc-ceed to both reduce the reflected wave and improve the heat transfer.
At last, we have paid attention to the geometrical configura-tion of the buffer. Indeed, numerical simulaconfigura-tions point out that the major part of the gas crosses the porous media on the left top side of the filter corresponding to the least resistant path for the flow. The result is that most of the filter volume does not have an effect on the flow. To improve the cooling, we force the flow to go through a larger part of the filter by increasing the left and right edges of the filter support, and numerical simulations prove that the ejected gas temperature is drastically reduced.
In conclusion, based on the numerical simulations, we have designed the following optimized porous filter with the char-acteristics: size 180 mm, particle diameter 8 mm, porosity 0.6, edge size 8 mm, and we shall present in the following text the comparisons between the new experimental cell and the numer-ical simulations.
B. Experimental and Numerical Conditions
The 2-D computational domain is composed of the metal tank, the safety valve, the buffer, the porous filter, the connec-tion compartment, and the exhaust duct (see Fig. 2) and compu-tations have been performed with a mesh of 7000 triangle ele-ments. At the initial time 0 s, the MV cubicle is filled with air at atmospheric pressure, at ambient temperature, and the gas is at rest. The internal arc fault zone is represented by a disk area inside the metal tank. We prescribe a reflection boundary con-dition on the walls by using the ghost-cell technique [16] and a transmission condition at the exhaust duct. To simulate the valve bursting when the critical pressure in the metal tank is reached, we first impose a reflection condition at the valve boundaries, then we cancel the condition at the very moment when the crit-ical pressure is reached in the valve vicinity (i.e.,
Pa).
We have simulated an internal arc fault on the first 400 ms to investigate the thermal phase. As mentioned in the previous section, the electrical arc is modelled by a local energy source
term linked to the electrical power determined from an ex-perimental test. We have obtained the following formulation:
where is the average power term, is the frequency, is the relaxation time, and is the time of rise.
In the interpolate power curve, only a fraction of the arc power is injected in the plasma zone because the energy consumed for heating, melting, and vaporization of electrodes is not modelled. As for a given experimental arrangement, the thermal transfer coefficient has to be estimated and mainly depends on several parameters, such as the insulating gas, elec-trode material, and gas density. In [2], the authors summed up the evaluations used in former research works. The -values differ in function regarding calculation methods and the com-plexity degree of the model (i.e., radiation losses, convection, and conduction). In practice, coefficient spaces out between 0.2 to 1 and we have evaluated 0.7 for this specific config-uration.
To evaluate the mass source term, we assume that the va-porized mass rate is directly proportional to the input electrical power
Experimental tests show that the valve bursts out at 83 ms and to numerically obtain the same opening time, compu-tations have to be performed with the value g J. The time step for the numerical simulations is prescribed around 3 to satisfy the restrictive Courant–Friedrichs–Levy (CFL) condition for stability purposes [16].
C. Results and Comparisons
Fig. 5 shows the measured pressure together with the calcu-lated pressure in the metal tank. After ignition of the electric arc, the pressure increases due to the heating of gas and the va-porized material coming from electrodes. In the test, the safety valve was gauged at 2.6 Pa and as soon as the pressure reaches the critical value, the valve bursts, generating a shock wave and the pressure release. In the experiment and the sim-ulation, the bursting valve enables reducing the pressure in the metal tank and avoids the mechanical rupture. The sudden pres-sure wave, propagating in the buffer area, is clearly visible on the pressure evolution as illustrated by Fig. 6. The pressure wave then interacts with the porous filter, inducing a vast number of reflected waves in the buffer and transmitted waves in the filter whose proportions depend on the filter porosity and the particle diameter.
The pressure histories in the buffer located under the metal tank are given in Fig. 6. The two curves (measurement and sim-ulation) are different profiles and we obtain a calculated pressure greater than the measured one. Since we only consider one gas in the mathematical model, the vaporized material is not condens-able in the simulation so density and pressure are overestimated. Indeed, the fluid is cooled by the porous medium and we observe the condensation of the metallic vapors coming from electrodes
Fig. 5. Pressure histories in the metal tank obtained by the measurement (solid line) and simulation (dashed line) recorded by the sensorP .
Fig. 6. Pressure histories in the buffer obtained by the measurement (solid line) and simulation (dashed line) recorded by the sensorP .
which are responsible for the pressure loss. Moreover, during the experimental tests, a gas leak in the buffer has been detected in the back of the buffer at the filter–buffer junction.
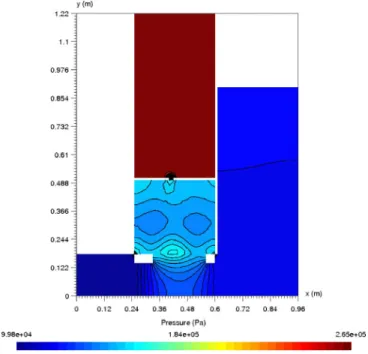
Fig. 7 gives the 2-D pressure field in the MV cell just after the bursting of the safety valve. The pressure in the metal tank is uniform and the shock wave generated by the valve opening hits the filter, inducing gas compression in the front of the porous media. The wave pressure is damped by the porous filter and propagates toward the connection compartment and the exhaust duct.
The numerical simulation gives the temperature map in the whole switchgear and we present the histories of the electric arc temperature in Fig. 8, the gas temperature in the metal tank,
Fig. 7. Pressure distribution in the medium voltage cell just after the bursting of the safety valve.
Fig. 8. Arc plasma temperature (solid line) recorded by the sensorT , gas temperature in the metal tank (dashed line) recorded by the sensorT close to the valve, and in the buffer (dotted line) recorded by the sensorT obtained by calculation.
and the gas temperature just after the safety valve. We obtain a plasma temperature around of 14 000 K while the ejected gas temperature, when the valve opens, ranges between 2500 and 3500 K.
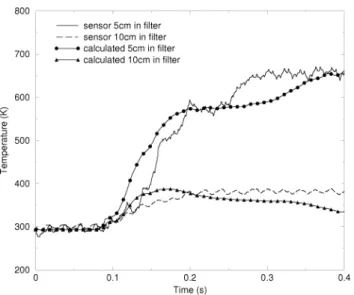
In order to evaluate the porous filter efficiency, two measure-ments of the gas temperature with thermocouples have been car-ried out, respectively, at 5 and 10 cm of depth inside the filter. Measurement and simulation results are presented in Fig. 9. We observe that the hot gas cooling is efficient since the gas temper-ature is cut by two after crossing 5 cm of the filter. Measurement and simulation provide very similar results and the heat-transfer modeling performs realistic temperatures.
In Fig. 10, we show the gas temperature histories in the ex-haust duct after the gas has crossed the filter. This information is the most important for security reasons. The result is that in
Fig. 9. Gas temperature in 5 and 10 cm deep in the porous filter recorded by sensorsT andT obtained by measurement (solid and dashed lines) and simulation (symbol).
Fig. 10. Gas temperature at the exhaust duct recorded by the sensorT ob-tained by measurement (solid line) and simulation (dashed line).
the experiment and the simulation, the gas temperature is low enough to be safely ejected outside the MV cubicle.
VI. CONCLUSION
In order to limit the external manifestations of internal arc faults in MV switchgears, a porous filter located at the bottom of the apparatus is a satisfying solution to guarantee low ma-terial damage and personal safety. Experiments and numerical simulations have demonstrated the filter efficiency to cool hot gas ejected from the metal tank and to absorb the pressure wave generated by the internal arc fault.
Despite using a simplified plasma model based on source terms, we manage to carry out representative simulations which allow optimizing the filter, modifying parameters, such as porosity, grain diameter, filter dimensions, and switchgear geometry to meet IEC requirements.
REFERENCES
[1] IEC TC 17C, AC metal-enclosed switchgear and control gear for rated
voltages above 1 kV and up to an including 52 kV, IEC 62271-200
High Voltage Switchgear and Control gear-Part 200, Int. Electrotech. Comm., 2003, 1st.
[2] F. Lutz and G. Pietsch, “The calculation of overpressure in metal-en-closed switchgear due to internal arcing,” IEEE Trans. Power App.
Syst., vol. PAS-101, no. 11, pp. 4230–4236, Nov. 1982.
[3] H. Kuwahara, K. Yoshinaga, S. Sakuma, T. Yamauchi, and T. Miyamoto, “Fundamental investigation on internal arcs in SF6 gas-filled enclosure,” IEEE Trans. Power App. Syst., vol. PAS-101, no. 10, pp. 3977–3987, Oct. 1982.
[4] A. Dasbach and G. J. Pietsch, “Calculation of pressure waves in sub-station buildings due to arcing faults,” IEEE Trans. Power Del., vol. 5, no. 4, pp. 1760–1765, Oct. 1990.
[5] G. Friberg and G. J. Pietsch, “Calculation of pressure rise due to arcing faults,” IEEE Trans. Power Del., vol. 14, no. 2, pp. 365–370, Apr. 1999. [6] T. R. Bjortuft, O. Granhaug, S. T. Hagen, J. H. Kuhlefelt, G. Salge, P. K. Skryten, and S. Stangherlin, “Internal arc fault testing of gas insu-lated metal enclosed MV switchgear,” presented at the 18th Int. Conf. Electricity Distribution, Turin, Italy, 2005.
[7] A. B. Wahle and R. F. Summer, “Internal arc testing of medium voltage switchgear – Experiences with IEC 62271-200,” presented at the 19th Int. Conf. Electricity Distribution, Vienna, Austria, May 21–24, 2007. [8] C. Besnard, “La simulation numérique pour la conception de cellules sécurisées en cas d’arc interne,” presented at the Conf. sur les Matériels de Postes HT et MT, Lyon, France, 2007.
[9] P. Chevrier, “Etude de l’interaction arc/matériaux lors d’un défaut d’arc interne dans une cellule moyenne tension,” presented at the Conf. sur les Matériels de Postes HT et MT, Lyon, France, 1999.
[10] X. Zhang, J. Zhang, and E. Gockenbach, “Calculation of pressure and temperature in medium-voltage electrical installations due to fault arcs,” J. Phys. D: Appl. Phys., vol. 41, pp. 1–11, 2008.
[11] A. François, “Prise en compte des risques résiduels provenant des effets d’arc interne, pour le matériel sous enveloppe installé en local intégré en immeuble,” presented at the Conf. Sur Les Matériels de Postes HT et MT, Lyon, France, 2007.
[12] N. Teera-achariyakul and J. Hokierti, “Internal arc pressure assessment of outdoor compact substation,” presented at the 7th Int. Power Eng. Conf., Singapore, 2005.
[13] F. Gentils, D. Serve, and P. Chevallier, “Un filtre innovant pour la pro-tection contre les effets de l’arc interne dans les cellules moyenne ten-sion,” presented at the Conf. Eur. Sur Les Matériels de Postes HT et MT, Lyon, France, 2003D. Rochette, S. Clain, and F. Gentils, “Numer-ical investigations on the pressure wave absorption and the gas cooling interacting in porous filter, during an internal arc fault in a medium voltage cell,” IEEE Trans. Power Del., vol. 23, no. 1, pp. 203–212, Jan. 2008.
[14] D. Rochette, S. Clain, P. André, W. Bussière, and F. Gentils, “Two-dimensional modelling of internal arc effects in an enclosed MV cell provided with a protection porous filter,” J. Phys. D: Appl. Phys., vol. 40, no. 10, pp. 3137–3144, 2007.
[15] D. Rochette and S. Clain, “Two-dimensional computation of gas flow in a porous bed characterized by a porosity jump,” J. Comput. Phys., vol. 219, no. 1, pp. 104–119, 2006.
[16] E. F. Toro, “A practical Introduction,” in Riemann Solvers and
Nu-merical Methods for Fluid Dynamics, 2nd ed. Berlin, Germany: Springer-Verlag, 1999.
David Rochette received the Ph.D degree in plasma physics from the Blaise Pascal University, Clermont-Ferrand, France, in 2002.
Currently, he is Associate Professor at the Technology University Institut of the Blaise Pascal University. His research interests include modeling electric arc discharges in circuit breakers, inductive coupling plasma modeling, and gas flow in porous media.
Stéphane Clain is Full Professor at the Mathematical Institute, Paul Sabatier University, Toulouse, France. He is a specialist in numerical analysis and com-putational sciences. His main research interests are nonconservative scheme de-sign and high-order techniques for finite volume methods.
William Bussiére received the Ph.D. degree in plasma physics in 2000. He is an Associate Professor at Auvergne University, Clemont-Ferrand, France. His current areas of interest are in medium-voltage fuse, low- and high-voltage circuit breakers, and interaction between plasma and insulators experiments at the Laboratory of Electric Arc and Thermal Plasmas, Blaise Pascal University, Clermont-Ferrand.
Pascal André is Professor at the Blaise Pascal University, Clemont-Ferrand, France, .and Director of the Electric Arc and Thermal Plasma Laboratory. His research topics concern the thermodynamic properties and transport coefficients of thermal plasma applied to the circuit breakers and atmospheric re-entry.
Charles Besnard is Innovation Engineer at Schneider Electric, Grenoble, France. He specializes in modeling arcs and current interruption, and led a project to develop new tools and methods on an internal arc fault. His missions are now anticipation and expertise in medium-voltage distribution.
![[PDF] Introduction au POO en C formation generale - Cours langage c](data:image/gif;base64,R0lGODlhAQABAIAAAP///wAAACH5BAEAAAAALAAAAAABAAEAAAICRAEAOw==)