HAL Id: hal-02876990
https://hal-pjse.archives-ouvertes.fr/hal-02876990
Preprint submitted on 21 Jun 2020
HAL is a multi-disciplinary open access archive for the deposit and dissemination of sci-entific research documents, whether they are pub-lished or not. The documents may come from teaching and research institutions in France or abroad, or from public or private research centers.
L’archive ouverte pluridisciplinaire HAL, est destinée au dépôt et à la diffusion de documents scientifiques de niveau recherche, publiés ou non, émanant des établissements d’enseignement et de recherche français ou étrangers, des laboratoires publics ou privés.
From workers to capitalists in less than two generations:
A study of Chinese urban elite transformation between
1988 and 2013
Li Yang, Filip Novokmet, Branko Milanovic
To cite this version:
Li Yang, Filip Novokmet, Branko Milanovic. From workers to capitalists in less than two generations: A study of Chinese urban elite transformation between 1988 and 2013. 2019. �hal-02876990�
World Inequality Lab Working papers n°2019/10
"From workers to capitalists in less than two generations: A study of Chinese
urban elite transformation between 1988 and 2013"
Li Yang, Filip Novokmet, Branko Milanovic
Keywords : China; elites; income share; class; top incomes
1
July 2019
From workers to capitalists in less than two generations:
A study of Chinese urban elite transformation between 1988 and 2013
Li Yang, Filip Novokmet and Branko Milanovic1
ABSTRACT
Economic and social transformation of China during the past 40 years is without precedent in human history. While the economic transformation was extensively studied, social transformation was not. In this paper, we use for the first time harmonized household surveys covering the period 1988-2013 to study the changes in the characteristics the richest 5 percent of China’s urban population. We find that the elite changed from being composed of high government officials, clerical staff, and workers in 1988 to professionals and small and large business owners in 2013. The educational level of the elite increased substantially. Membership in CCP has a positive (albeit small) effect on one’s income but is particularly valuable to large business owners.
1 Respectively, Paris School of Economics (li.yang@psemail.eu), University of Bonn (filip.novokmet@uni-bonn.de)
and Graduate Center City University of New York (bmilanovic@gc.cuny,edu). Yang acknowledges financial support from the European Commission under H2020-MSCA-IF-2018 Grant Agreement No. 799444.
2 Section I. The objectives of the paper
The transformation of China from a poor and egalitarian country to an upper middle-income country with the level of middle-income inequality greater than in the United States has been the subject of innumerable publications. The Chinese transformation is a unique event in world economic history: never have so many people over such a relatively short period of time
increased their income so much. China’s GDP per capita in 1978, at the time of the initiation of rural reforms, was about $1,500; by 2015, it was more than $12,000 (both in constant PPP dollars).2 For comparison, UK GDP per capita was (expressed in the same units) around $12,000
in 1953, while its GDP per capita at the beginning of the Industrial Revolution is estimated at more than $3,000. 3 Thus it took UK about a century-and-half to increase its GDP per capita by
half as much as China did in less than 40 years. Differently, it took the United States 240 years from approximately year 1700 (when its GDP per capita was estimated to have been $1200-$1300) to 1941 to reach $12,000 and thus to do what China accomplished in forty years.4
Such transformations, in terms of average income and distribution of that income, is only superficially captured by synthetic indicators like GDP per capita or the Gini coefficient or the share of the top 1%. The experienced social changes were much deeper (changement en
profondeur) and affected all social classes. Clearly, the England of 1953 was, socially speaking
an altogether different country than the England of the Napoleonic wars. So is today’s China compared to the China of 1978. For social researchers, the advantage of the Chinese experience is that the change has taken place so fast, in the span of less than two generations, so that it
2 Data from the 2018 update of the Maddison Project Database.
3 To find the date when the UK GDP per capita was only $1,200 would require going back into the later Middle
Ages for which the data are quite uncertain. Maddison’s numbers for the Great Britain for year 1000 give $1100; the next value is for the year 1700: $2200. If the UK had reached the level of $1,200 by (say) approximately 13th
century, it would have taken the country six centuries to traverse the path that China traversed in some 40 years.
4 Maddison Project Database 2018 update. Available at
3
can be more easily apprehended, and that the data to assess it empirically exist today while they were lacking during the similar episodes in Western economic history.
The objective of this paper is to describe and analyze the change in the Chinese economic elite between (approximately) the years of early reforms and the attainment by China of the status of the largest economy in the world (in PPP terms). We are interested in how the composition and characteristics of the top income group in the urban area have changed during that period. A common view is that the Chinese society in the late 1970s-early 1980s was poor but very egalitarian: income differences between different segments of the population (workers vs. cooperative farmers; town-dwellers vs. villagers; Eastern provinces vs the Central and Western areas) were relatively small. A number of studies documents low levels of income or wealth inequality across any of these criteria (Kanbur and Zhang, 2018; Zhuang and Shi 2016; Ding and He, 2018; Wu and Perloff 2008).
When we focus on the pre-reform elite we might distinguish, within the picture of an overwhelming equality of income and condition, only a very narrow sliver of top government and party officials whose incomes5 and standard of living were much higher than that of the
rest of the population. But the Maoist elite was very small to make a serious dent in any picture of overall equality which, by definition, takes into account the sum of all income differences between all members of a community (the Chinese nation in this case).
Moreover, the period of Dengist reforms when the transformation of the country began, was preceded by probably the most egalitarian movement in Communist, and possibly in world, history. The Cultural Revolution that is conventionally dated from 1966 to 1974 not only aimed to reduce the privileges of the top Party cadres (“bombard the headquarters [of the Party]” according to Mao Zedong), to proceed to an overwhelming replacement of the elite, to “exile” many intellectuals to the countryside and submit them to the manual labor, but implemented an extreme version of “the affirmative action” that openly and hugely favored, in terms of access to education and better jobs, children of poor farmers and workers. Thus the usually
5 But not necessarily wealth—since very little of amenities they enjoyed could be transferred to the next family
4
egalitarian character of socialism was additionally exacerbated by this most radical experiment in social leveling.
It is against this background of egalitarianism, and of an elite that was probably composed of a small number of top party and government officials, who themselves were subject to fast rotation as their fortunes during the Cultural Revolutions and afterwards quickly altered, that we ought to evaluate the transformation that has occurred in China. Section II reviews two types of literature relevant for our paper: the one on social classes and their transformation, and the other on elites.
The household survey data that we use cover the period from 1988 to 2013. We have four waves of household surveys (Chinese Household Income Project, CHIP) conducted in 1988, 1995, 2002, and 2013. We have standardized them so that they are almost fully comparable (see Section III).
As mentioned, the objective is to study the change in the composition and
characteristics of the Chinese elite. We define the elite as the top 5% of the urban population in terms of their per capita disposable (after-tax) income. We include only individuals aged 20 years or more. We decided to focus primarily on the top 5% rather than on the top 1% because the latter is too narrow a group. It is also unlikely to include the very richest members (say, the top 0.1%), whether they are top party officials or capitalist entrepreneurs. This is not only because the participation rate of the richest households may be low but also because their numbers are relatively small to be captured by random surveys (that is, short of surveys trying to oversample the rich).6 The term “elite” unless further clarified will be used for the top 5%
only. At times, when relevant, we study the top decile and the top 1% as well. Our description and the analysis of the elite is presented in Section IV.
6 This is one of the reasons why American Current Population Survey in the past used to proceed to top-coding of
income so that sudden inclusion of very rich people may not lead to misleading ascription of excessively high inequality to the year when they were included in the survey. An alternative, initiated recently, is to try to oversample the rich.
5
An important feature of Chinese developments is a significant, and perhaps increasing, split between the more advanced and richer Eastern (Pacific Rim) provinces and those in the Center and the West. The survey data allow us to include the regional component in the study. The regional component is especially important in a study of the elite because one may expect that the composition of the elite had evolved differently in different parts of the country: richer and more advanced parts might have developed a more capitalist-entrepreneurial elite than the less advanced and poorer regions. We explore this aspect in Section IV as well.
The Chinese household survey data are unique in that they also include a personal political variable, namely membership in the Chinese Communist Party (CCP).7 Since CCP was
the ruling and de facto the only political party in China throughout the period of our study, and its members might be thought to have enjoyed, both in the past and more recently, special economic advantages, we study empirically the role of party membership in Section V. Section VI presents our conclusions.
Section II. Related literature
This paper is related to several strands of literature. Our first contribution is to chart the changes in the social structure during the ‘great transformation of China’ in the last several decades. Obviously, we are not the first to look at this process. There is a large literature both in China and abroad that explores the ongoing social trends and implications of the rapid economic development in China (see Bian 1996, 2002; Brandt et al. 2008; Lin and Wu 2010). More specifically in this broader area of research, we see our work as a natural extension of the literature looking at the relationship between the (changing) social structure and income inequality.
This allows us to place the recent social transformation in China in the historical perspective and to draw comparisons, principally with Western countries. While this
7 Several surveys conducted in former socialist countries in Eastern Europe included a personal political variable on
the membership in the Communist party (for example, the Czechoslovak Social Structure Surveys). But, to the best of our knowledge, this dimension has never been systematically investigated.
6
comparison is not the object of the current paper, the data and the analysis provided here make such comparisons an obvious topic of future work. The Chinese transformation seems to have exhibited similar tensions between economic and social demands typically attributed to the western industrialization (e.g. Polanyi 1944). But it was compressed in time due to the extraordinary high rate of growth of the economy. To illustrate. According to social tables for England and Wales reworked by Allen (2017), it took British capitalists 180 years, from Gregory King’s 1688 social table to Baxter’s social table in 1867, to increase their share in the population from 3.4 percent to 7.8 percent. For urban China, however, we find that small and large
capitalists (including the self-employed) increased from less than 1 percent of the population in 1988 to 12.3 percent 25 years later.
The relationship between social classes (both by their size and income) has figured prominently in analyses which has looked at how social relations of production—typically of asset ownership and authority—influence income inequality (Dahrendorf 1959, Wright 1979, Wodtke 2016, etc.). There are compelling reasons why this framework is especially pertinent to analyze the great transformation in China. Officially, “class” labels were introduced during the Mao’s era with the clear intention to predetermine social prospects of individuals. The labels were intended to reflect pre-1949 class relations. There were “five bad elements”, landlords, rich peasants, counter-revolutionaries, bad elements (in general) and rightists, and “five red categories”: workers, peasants, cadres, descendants of revolutionary martyrs and revolutionary intellectuals (see Goodman 2014). In a form of extreme affirmative action, the “five bad
elements” and their progeny were to be discriminated against, and the “five good elements” and their progeny to be discriminated in favor. While such labels are no longer used, and do not openly lead to advantages and disadvantages, social classes and social structure matter in China, both officially (this is why a statistical count of classes is maintained) and in terms of what society the modern China is.
China saw at the same time a rapid transformation of the class structure and a substantial increase in income inequality (see Lin and Wu 2010; Lu 2002, 2004, 2010 etc.). Hence it is legitimate to ask whether these developments are related and to what extent the social class is a determinant of income inequality (e.g. see Wodtke 2016 for a related analysis
7
for the US), and vice versa, to what extent has rising inequality been an important determinant of the class identification (Goodman 2014).
The global shift of the industrial production to China in recent decades has entailed a thorough modification of the social relations of production in the country, both along
dimensions of ownership and control over productive assets.8There has been, on the one hand,
a dramatic change within the working class, with the massive rural-urban migrations and rapid proletarianization amid dissolutions and privatizations of the state-owned enterprises. On the other hand, altogether new classes emerged, most notably that of private, often big, owners (see Lin 2007, 2008; Liu 2007; Lin and Wu 2010). Similarly, the importance of professionals, working either in state or private sectors, increased.
Therefore, the social class analysis—by considering some unique features of the contemporary Chinese society—provides a more comprehensive approach to study the distributional implications of China’s movement toward capitalism. The approach is thus complementary to the more frequently studied functional distribution of income between capital and labor, which has traditionally been a concern of economists.910In addition, the
class-based framework implicitly stresses the antagonistic interests of different classes, an aspect frequently missing from the mainstream economic analysis.11
Another strand of literature to which this paper is related is the vast literature in political science and sociology on the elite theory. From the seminal contributions of the classical elite theorists, such as Mosca, Pareto, Michels or Weber, to the more recent work of Dahl, Putnam, Giddens or Higley, there has been an astute awareness that complex
8 Note that productive assets may be more broadly defined, beyond the often-used narrow definition focused on
physical or financial capital. For example, in the neo-Marxists framework productive assets also include labor power, organizations, and skills (Wright 1985; Lin and Wu 2010).
9 See Piketty and al. (2017) for evidence of the rising capital share in national income in China.
10 In cases like this, a potentially useful approach is to analyze social classes defined in terms of authority relations
(Dahrendorf 1959). This is however beyond the scope of this paper.
11 There is a large literature, largely in the Marxist tradition, which has insisted on the exploitation of the working
8
requirements of organizing and administrating the modern society and the rising
bureaucratization entail that the limited number of individuals wield a disproportionate power in the society.12
Starting with Trotsky (1936) and Djilas (1956), this framework was extended to the socialist countries (e.g. Brzezinski 1962, Matthews 1978, Voslensky 1984, etc.).Following the marketization reforms in Eastern Europe, the focus centered on the elite competition and the changing power balance within the tripartite elite structure consisting of political elites
(nomenklatura), managers-technocrats, and intelligentsia (Konrad and Szelényi 1978; Milanovic 1989). This line of research saw an especially strong impetus during the late communism and its fall as well as during the transition process in Eastern Europe in the 1990s. The literature
investigated the elites’ differential (between countries) role in bringing about the change from communism to capitalism, and related this, to the markedly different post-communist political and institutional trajectories (Szelényi et al. 1998, Roland 2017).
Our paper contributes to this literature by looking at the change among the Chinese elite (defined as the top 5% of the urban population) in the recent decades. The rapid market transition in China has been to a large extent a process steered by the Communist-linked elites which were never entirely homogeneous (that’s why we speak of the Communist elites in plural). It is a unique feature of the Chinese transformation that it has been carried out under the authoritative aegis of the Chinese Communist Party (CCP), which has retained its political monopoly against the background of market reforms and economic decentralization. While CCP has acted as a “designer and supervisor” of the reform, the process has led to the profound transformation of the elites (Naughton 2007). The CCP needed to adapt itself to the rapidly evolving social and economic environment in order to preserve its political power, or to ensure its survival. This adaptability is clearly evidenced by the striking change in the elite composition which we document here (Section IV), as well by the change in the social structure of CCP itself and its elite, that is, the CCP members who are also part of the top 5 percent (Section V). The CCP opened itself to individuals with higher education and professional expertise and quickly
12 According to Higley (2018, p. 27): “Elites can be defined as individuals and small, relatively cohesive and stable
9
lost its peasant and low-urban layout. The late 1980s and especially the 1990s saw a darting rise of technocrats in the CCP (Li 2016, 2018). We shall indeed see that professionals currently represent the largest social group among the elite.
However, it is not clear that this process mechanically signified a drift towards strictly meritocratic elite recruitment. As mentioned, peculiarities of China’s transition to capitalism gave rise to a large body of research in political sociology which has studied the character of the elite recruitment in post-Maoist China.13 Walder (1995) and Walder, Li, and Treisman (2000)
have put forward a “dual career path” hypothesis, according to which elite recruitment in China occurs along two distinct paths—one professional and the other political—for which education and political loyalty are assessed differently and which, in consequence, results in a sharp differentiation of the political and professional elite (Walder 1995, p. 311).14 Therefore, there is,
according to these authors, no homogenization of the elite into one higher-educated
professional group.15 Two distinct roads into the elite continue to exist.16 On the other hand,
ongoing social transformation in the 2000s, as discussed below, has prompted other authors to see the two elites merging into one single politico-entrepreneurial elite (despite the difference in the mode of recruitment). Our empirical analysis does not allow us to pass a judgment on
13 See Kaeble (1981) for the general overview on business and political elite recruitment in western countries
during their industrialization.
Specifically, on the patterns of bureaucratic promotion in China see Jia et al. (2015), Persson and Zhuravskaya (2016), Fisman et al. (2019), etc.
14 Landry (2008, p. 257) quotes Deng Xiaoping’s assumed remark during the “southern inspection tour”: “We must
pay attention to training people, selecting and promoting to positions of leadership persons who have both ability and political integrity, in accordance with the principle that they should be revolutionary, young, well-educated and professionally competent. This is of vital importance to ensure that the Party’s basic line is followed for a hundred years and to maintain long-term peace and stability. It is crucial for the future of China”.
15 Already Moore (1944), in his analysis of the Soviet elites in the 1920-30s, had discerned an increased weight
given to political loyalty in elite recruitment (for example, between 1923 and 1936, the percentage of company directors in the Party rose from 29 to 97 per cent (p.269)), yet predicted that concurrent demands for loyalty and competence would bring about tensions in the post-Stalinist period. Ineklas (1960) believed that this tension would lead to eventual ‘professionalization’ of socialist elites (a view later shared by Konrad and Szelényi 1979), a view sometimes labelled as the “modernization theory”.
10
this issue, but provides the basis needed for a more useful discussion of the nature of the Chinese elite.
Most remarkably, as said, further marketization of China opened the doors for the new group, the entrepreneurs and capitalists. Ideologically, the process of CCP social transformation was reflected in Jiang Zemin, then the President of the CCP and President of China, concept of “The Three Represents” which opened the Party membership more widely to technocrats and even to capitalists. In a well-known proclamation in 2001, Jiang Zemin encouraged the
admission of private businesspeople into the party ranks, grounding it on the theory of ‘Three represents’, according to which “the CCP should now represent society’s advanced material, ideological and cultural forces” (Dickson 2003, 2007; Goodman 2014). It should be noted however that, in principle, Chinese Communist Party was never entirely closed to the
membership of the “well-meaning” national bourgeoisie: even China’s coat of arms with five stars, where the largest one stands for the Communist party, includes national bourgeoisie together with three other classes of workers, peasants, and urban bourgeoisie, as country’s component parts. This is a far more flexible attitude than that of the Soviet Union and other Communist countries.
Ever since, the entrepreneurs have been the focal point of numerous conjectures on the future of the political system in China, frequently perceived—due to their growing economic strength17—as potential agents of the political change towards democratization of China (as in
the modernization theories such as Barrington Moore’s summarized by the famous quip of “no bourgeoisie, no democracy”; see overviews in Dickson 2003, Goodman 2014).
However, these predictions turned out wrong, or at least premature. In a sort of the Chinese variant of the concordia ordinum, the CCP has been rather successful in holding the tight grip on the economy and there are no indications of a lurking conflict between the party and entrepreneurs.18It seems that the “modernization” narratives greatly downgrade how
18 In fact, Chen and Dickson (2010) argue that their relationship is better described as that of “allies”. Also, see
11
thoroughly the Party and the private business are interwoven in China today, and, more generally, overemphasize the disconnection of the economy from the political realm.
The party nomenklatura and private business cultivate strong links both at the
institutional and personal level. Numbers of party members have changed a career to become successful entrepreneurs (the so-called xiahai entrepreneurs) and many thriving entrepreneurs have been co-opted into the party ranks (Dickson 2003, p. 5; Chen and Dickson 2010). This close interdependence magnifies the importance of political connections in the China’s economy today (Fan et al. 2007, Li et al. 2008, Calomiris et al. 2010, Nee and Opper 2010, Guo et al. 2014, Kung and Ma 2016, Chen and Kung 2018, etc.). In all likelihood, this symbiosis contributes to stronger cohesion of Chines elites. One could even go as far to suggest that it is a critical feature of the Chinese political capitalism (Milanovic 2019): a symbiosis where the political elite
maintains its supremacy and autonomy while allowing the private sector elite to prosper as long as it is does not question the political order.19
19 One hypothesis to explain why economic transformation in China will not necessarily leads to political
transformation is that during the transition the people who benefitted the most are those who are “in the system” (members of the CCP, government, or state-owned companies). Thus, these new elites are unlikely to fight against the system.
12 Section III. The data
Our analysis relies on the nationally representative household income surveys – China Household Income Project (CHIP) – which were drawn from a much larger sample of Urban Household Survey (UHS) conducted annually by the National Bureau of Statistics (NBS).20More
precisely, we use urban samples of four CHIP waves in 1988, 1995, 2002, and 2013.21The
richness of the survey information in CHIP allows us to analyze various characteristics of the elites (the urban top 5% income group), and the evolution of these characteristics over time and across regions. The characteristics of interest analyzed here are social class, source of income, education, profession, type ownership (state, private, foreign etc.), and CCP membership.
Despite detailed survey information provided by CHIP, the major challenge is that the surveys are not conducted in the exactly consistent manner across the four waves. For instance, the survey questions vary across different waves. Even when the questions remain the same, the answer options might vary22. Thus, harmonization of the survey data is required before
conducting any analysis, to ensure that the comparison of statistics across waves is meaningful. We shall explain below the harmonizing process conducted for several key variables. We provide more complete details of data in the online appendix.
Income. The income concept we use is adult disposable income, which is defined as the
sum of wage income, business income, property income, and net transfer income (pensions
plus other social benefits plus private transfers minus direct taxes and minus social security
contributions). Wages include money wages plus wages in kind composed of fringe benefits, imputed value of subsidized goods received, and imputed value of state housing (above the
20 For instance, CHIP 2013 which we use here is a sample drawn from the annual integration household survey
carried by the National Bureau of Statistics in 2013. The latter contains 160 thousand households in 31 provinces.
21 CHIP surveys were also conducted in 2008, however the weight variable of CHIP 2008 has not been released so
far and the estimation based on unweighted CHIP 2008 would not provide nationally (or regionally) representative results. Thus, we exclude this survey from our research. For more details, see Sherry Tao Kong (2010).
22 For instance, for the same question regarding the education level, there were 8 options in CHIP 1995 and 9
options in CHIP 2002. For the people with college education level or above, CHIP 1995 includes them in the same category while CHIP 2002 separates them into two categories: college/university and graduate.
13
nominal rent). Wages in kind were much more important in 1988 than in later surveys. For wage income and business income, CHIP provides individual-level information in all four waves of the survey. For property income and transfer income, individual-level information is provided in CHIP 1995 and 2002, while CHIP 1988 and 2013 provide only household-level information. Thus, in the case of CHIP 1988 and 2013, we equal-split property and transfer income among all adults in the household.
Profession. The remarkable social transformation of China in recent decades is, in our
opinion, best manifested in the changing professional composition of the population. As mentioned above, the CHIP survey allows us to chart the professional structure of the elite as China moved from the still predominantly command economy of the 1980s, with only timid attempts at reforms, towards more comprehensive marketization of the country observed today. Motivated by our research agenda and at the same time dictated by the specificity of the data, we settle on the following six professional categories: 1) owner (manager) of private business, 2) owner of individual business, 3) professional, 4) higher-level official in the
government or state-owned enterprise (SOE), 5) clerical or office staff, and 6) worker. In what follows, we explain in more detail the professional categories of interest and describe how we have harmonized them across waves.
Owner (manager) of private business vs. Owner of individual business. According to NBS
classification on company registration type, private enterprises refer to profit-making economic units founded and owned by natural persons, or controlled by natural persons using hired labor. Included in this category are private limited liability corporations, private share-holding corporations, private partnership enterprises, and private-funded enterprises. Individually (owned) business, as the name suggests, is a company form in which the company is owned by only one individual. It is the simplest form of company registration in China, and mostly used for the self-employed, who in some cases and at irregular intervals might employ additional workers. As Huang (2008), citing the official definition, writes, “individual businesses in
industry and commerce (geti gongshang hu)… are essentially self-employment proprietorships, although some also [have] outside employees. Under Chinese law, those businesses that employ less than seven workers are considered self-employment businesses.” Owners of
14
private business firms, known as siying qiye “differ from the self-employment businesses in that they are much larger and typically employ seven or more workers per firm” (Huang, p. 2008, p. 107).23 Basically, the term “private” should be understood to imply that there are hired workers
whereas the term “individual” implies either self-employment or small or irregular use of hired labor. In the rest of the paper, we shall use the terms “private business owner”, and the “self-employed” (or “individual business”) for the two groups.
The professional classification changed considerably in the 2013 wave24 and we had to
harmonize data in order to ensure consistency with the previous survey waves (the
classification of professions in the questionnaire has remained practically unchanged between the 1988 and 2002 waves). Thus in the 2013 wave there is no direct or clear distinction
between “Owner (Manager) of Private Business” and “Owner of Individual Business”. Thus, we used auxiliary survey information to classify individuals according to six benchmark categories. More precisely, we identify respondent’s profession as owner of private business in 2013 under two scenarios: (i) if (s)he is the employer or self-employed and working in private enterprises; (ii) if his/her occupation is the principal of an enterprise and (s)he is working in a private enterprise (see appendix for a detailed technical exposition). The identification method for owner of individual business is similar as for Owner (manager) of private business, except that these are people who work in individual enterprises instead of private enterprises.
Professionals. According to the official classification and codes of occupation, this
category includes all the professional and technical personnel working in science-related
23 Goodman (2014, p. 38) explains: “In 1984, market reforms were extended to urban China, although initially
development was slow, with some reluctance to take initiatives on the part of potential private business people, and some hesitation from the Party-state. Marx had argued in Das Kapital that employing more than eight people led to exploitation. Accordingly, the CCP decided to permit the development of small-scale individual household businesses (getihu, 个 体 户) of up to eight employees. Later, in 1988, somewhat larger private businesses (siying
qiye, 私 营 企 业) were recognized but these were seen as adjuncts to the state sector, stepping in where the
latter was less able to act. Most private business remained small throughout the 1980s.”
24 This is due largely to the adoption of new classification and codes of occupation issued in 2009 (GB/T 6565-2009)
15
sectors (e.g., science, engineering, agriculture, medical care) and social science-related sector (e.g., economics, finance, law, education, press and publication, religion).25
Higher-level officials in the government or SOE. As the name suggests, this category includes all the principals in (i) the CCP, government, or state-owned institutions; (ii) other parties or social organizations; (iii) public enterprises.
Clericals and office staff. According to the official classification and codes of occupation,
this category includes all administrative clerks, security and fire control staffs, post and telecommunications staffs, and other clerical staffs and affiliates. It basically includes (what used to be called) “white-collar workers”. 26
Workers includes all unskilled and skilled employees in all industrial sectors.
Provinces and Regions. To classify the economic development of different provinces in
China, the National Bureau of Statistics divides China into three economic regions. The coastal eastern region is comprised of 11 provinces and municipalities: Beijing, Tianjin, Hebei, Liaoning, Shanghai, Jiangsu, Zhejiang, Fujian, Shandong, Guangdong and Hainan. The central zone is comprised of 8 provinces including Heilongjiang, Jilin, Shanxi, Anhui, Jiangxi, Henan, Hubei and Hunan. The third economic region is Western China which includes the 12 provinces: Inner Mongolia, Guangxi, Chongqing, Sichuan, Guizhou, Yunnan, Tibet, Shaanxi, Gansu, Qinghai, Ningxia, Xinjiang (see the map below).27 We adopt the same regional classification to conduct
the regional analysis.
25 For more details, we refer to classification and codes of occupation, GB/T 6565-1999 and GB/T 6565-2009.
26 For more details, we refer to classification and codes of occupation, GB/T 6565-1999 and GB/T 6565-2009. 27 In 2011 the National Bureau of Statistics (NBS) updated the economic region classification by dividing the
country into four major economic regions: the eastern region, which includes Beijing, Tianjin, Hebei, Shanghai, Jiangsu, Zhejiang, Fujian, Shandong, Guangdong and Hainan; the northeast region, which includes Liaoning, Jilin and Heilongjiang; the central region, which includes Shanxi, Anhui, Jiangxi, Henan, Hubei and Hunan; and the western region, which includes Inner Mongolia, Guangxi, Chongqing, Sichuan, Guizhou, Yunnan, Tibet, Shanxi, Gansu, Qinghai, Ningxia and Xinjiang. (See National Bureau of Statistics of China. Available online:
http://www.stats.gov.cn/ztjc/zthd/sjtjr/dejtjkfr/tjkp/201106/t20110613_71947.htm (accessed on 22 March 2019)). Since our sample covers the period from 1988 to 2013, we adopt the pre-2011 regional classification.
16
The geographic coverage of CHIP has also been changing through the four waves. However the CHIP sample was selected by systematic sampling method in three layers of east, center and west (see Li Shi et al., 2008) to make sure the survey is regional representative.28 To
be more precise, compared to CHIP 1988, CHIP 1995 adjusted the sample in the Central and Western regions by replacing Shanxi (in Central) and Yunnan (in Western) with respectively Hunan and Heilongjiang (in Central) and Guizhou (in Western region). The coverage of Central and Western regions remained practically unchanged after 1995. The coverage of the Eastern region that includes, among others, Beijing, Guangdong, and Shanghai, has been increasing gradually since CHIP 1995. Overall, the urban population of the included provinces accounts for approximately 50 percent of total China’s urban population, with the coverage the highest in the Central region and the lowest in the West. Table 1 gives the details of the evolving regional coverage.
28 Also see Introduction of CHIP 2013. Available online: http://www.ciidbnu.org/chip/chips.asp?year=2013
17
Table 1. The Geographic Coverage of CHIP
Year of the survey 1988 1995 2002 2013
East
Beijing Beijing Beijing Beijing
Liaoning Liaoning Liaoning Liaoning
Jiangsu Jiangsu Jiangsu Jiangsu
Guangdong Guangdong Guangdong Guangdong
Shandong Shandong
Shanghai
Total population included (in m) 44.8 64.5 80 170.4
Percent of total urban population 51 53 50 48
Central
Anhui Anhui Anhui Anhui
Henan Henan Henan Henan
Hubei Hubei Hubei Hubei
Hunan Hunan Hunan
Heilongjiang Heilongjiang Heilongjiang
Shanxi Shanxi
Total population included (in m) 32 63.1 79.8 174.9
Percent of total urban population 48 72 72 83
West
Guansu Guansu Guansu Guansu
Guizhou Guizhou Guizhou
Yunnan
Total population included (in m) 6.8 8.4 11.1 23.6
Percent of total urban population 14 14 14 14
All urban China
Total population included (in m) 83.6 136 170.9 368.9
18
19 Section IV. Changing characteristics of the elite 1. The elite’s share of total income
Similar to other studies of income inequality in China (Xie and Zhou, 2014, Zhuang and Shi, 2016; Piketty, Yang and Zucman, 2018; Wu and Perloff, 2005; Ding and He, 2018), the standardized CHIP surveys show a steady increase in inequality. As explained in Section III, inequality is measured by the distribution of after-tax after-transfer (i.e., disposable) income among the adults aged at least 20 years. Individual income (wage, social transfers etc.) is assigned to individuals who have received them while capital income is divided equally among the household members (aged 20+).
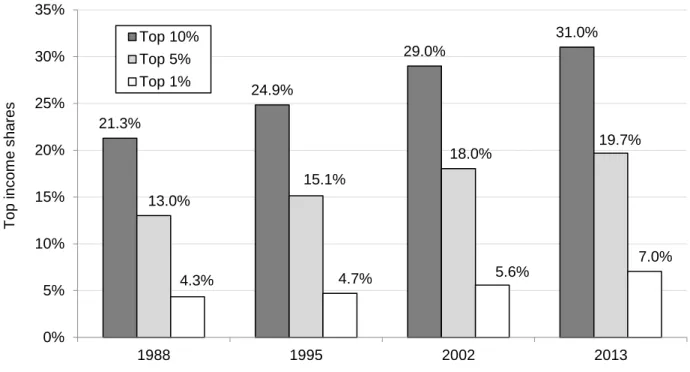
Income share of the three top groups we consider here (Figure 1) has steadily gone up. The top 1% share went up from 4.3% in 1988 to 7% in 2013; the share of the elite (top 5%) increased from 13% to almost 20%, and the share of the top decile increased from about 21% to 31%. Measured by the Gini coefficient (calculated across all adults) inequality went up from 0.27 to 0.45.
We thus establish the first, rather unsurprising result, of steadily higher inequality in urban China. For our work, however, the important fact is that the share of total income on which we shall focus (the share of the elite) went up from 13 percent to 20 percent. The Chinese urban elite is probably currently (at the time of this writing, in 2019) receiving around 1/5th of China’s total urban income. Another way of giving the order of magnitude of the flows
with which we are concerned here is to note that since urban China’s total income is estimated at about 1/7th of world total income,29 the people we consider here are receiving about 3% of
world income—not an inconsiderable amount.
29 According to the World Bank data (World Development Indicators), China’s total GDP in PPP terms was in 2017
equal to 20 percent of world GDP. Chinese urban GDP is estimated at some 70% of all-China GDP (calculated from household survey). .
20
Figure 1. Income share of the top 1%, top 5% and top 10%
2. Income composition of the elite
We have seen that the urban top 5 percent of China’s adults increased their share in total income from 13% in 1988 to almost 20% in 2013. What types of income do they mostly receive and has that composition changed? The data are shown in Table 2. Wages, both
monetary and in-kind, remain by far the most important source accounting for between 77 and 84 percent of total elite income in 1988-2002. (In 2013, however, the classification does not allow us to separate wages and business income: the two together make 86 percent of total elite income.) Business and property income (together) are between 5 and 6 percent, and the share of transfers declines from 17 percent in 1988 to 11 percent in 2002.
Is the elite’s income composition different from the overall income composition in urban China? The answer is not very much. In 1988-2002 surveys, wages accounted for around 80 percent of total urban Chinese incomes, which is the same as their importance in elite income. The difference (in relative terms) is more substantial when it comes to business and
21.3% 24.9% 29.0% 31.0% 13.0% 15.1% 18.0% 19.7% 4.3% 4.7% 5.6% 7.0% 0% 5% 10% 15% 20% 25% 30% 35% 1988 1995 2002 2013 T op i nc om e s ha res Top 10% Top 5% Top 1%
21
property incomes: in urban China, these two sources accounted for only 2% in 1988 and 1995 (vs. 5-6% among the elite) and in 2002 their shares among both the population and the elite were the same. Transfer income is, unsurprisingly, more important for the total population than for the elite. Overall, we can conclude that the elite depends more on business and property income that does the urban China as a whole, but the shares of these two types of elite income remain (or at least, they did remain until 2002) relatively small. Another way to see this is to note that for each yuan received from business or property, the elite receives more than 15 yuans from labor. With the rising share of owners and entrepreneurs among the elite in 2013 (see below), the relationship has probably moved in favor of business and property incomes.
Table 2. Composition of income, by Income source, for all urban population and the top 5% (in percent)
All population Top 5 percent (the elite)
1988 1995 2002 2013 1988 1995 2002 2013 Wages (incl. wages in kind) 83 80 78 76 77 81 84 86 Business income 1 1 4 5 1 4 Transfers 15 18 18 24 17 14 11 14 Property income 1 1 1 1 4 1 Total 100 100 100 100 100 100 100 100
Note: In 2013, wages and business income (as well as transfers and property income) are shown together.
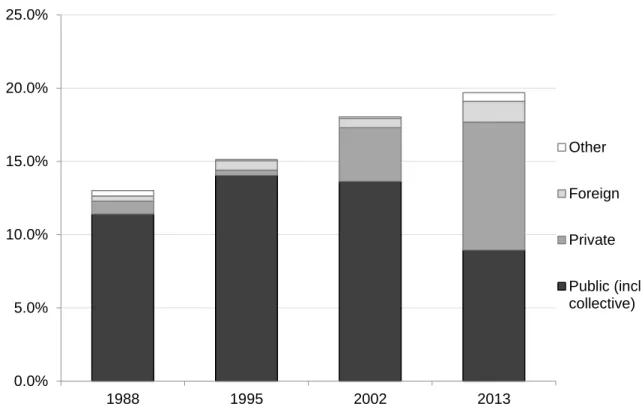
The elite income used to come predominantly from the state sector. In 1988, almost four-fifth of elite income was derived from state and collective sectors (the two combined accounted for more than 10% of all China’s urban incomes; see Figure 2). The role of private sector was minimal (6% of elite income). While the situation remained the same in 1995, by 2002, we already see significant changes with private sector income accounting for 17% of elite income, and public and collective sectors shrinking equivalently. In 2013, the private sector overtakes the state sector as the dominant sector from which the elite draws its income. Over the entire period the growth of elite private sector income is nothing short of extraordinary: in
22
1988, the private sector income received by the elite amounted to only 0.8% of all urban incomes in China; in 2013, it was tenfold greater: more than 8% of all urban incomes.
Figure 2. Income sources, by sector of ownership, of the top 5% (in percent of total all-China urban income)
3. Social composition of the elite
Our data on the social composition of the elite are available for all four years. They allow us to see what is only hinted at when we look at elite income sources, namely a major shift toward owners and the self-employed (individual business owners) among the top 5% (Figures 3 and 4). Owners of large private enterprises and the self-employed accounted for only 3% of elite members in 1988. Their share doubled to about 6% by 2002, a significant but not a dramatic expansion (corroborated, as we have seen, by the data on the increased importance of business and propriety income). It then “exploded” in the next decade, increasing more than three-fold to reach almost 20% in 2013.
0.0% 5.0% 10.0% 15.0% 20.0% 25.0% 1988 1995 2002 2013 Other Foreign Private Public (incl. collective)
23
Figure 3. Social composition of the top 5% (percentage of individuals)
Figure 4. Social composition of the top 5% (percentage of total elite income)
0%3% 1%0% 2% 5% 4% 15% 20% 30% 36% 33% 12% 25% 22% 6% 27% 21% 21% 20% 37% 24% 15% 21% 0% 10% 20% 30% 40% 50% 60% 70% 80% 90% 100% 1988 1995 2002 2013 Worker Clerical Government Professionals Indiv.Business Owners 0% 0% 2% 7% 5% 2% 4% 20% 18% 29% 36% 32% 12% 25% 22% 6% 27% 21% 21% 18% 37% 23% 14% 17% 0% 10% 20% 30% 40% 50% 60% 70% 80% 90% 100% 1988 1995 2002 2013 Worker Clerical Government Professionals Indiv.Business Owners
24
The elite which before the important urban reforms in the early 1990s was
overwhelmingly composed of workers, clerical staff and government officials—the three classes accounting for 76% of the people in the top 5% in 1988—has by 2013 become an elite where professionals and business owners are in the majority (Figure 3). In fact, the 2013 survey shows that 53% of the elite is composed of professionals and owners of private and individual
businesses.30 Professionals have become the largest social group among the elite. China has
thus, over the period under study, transformed itself from a society where workers and
employees, most of whom linked to the state, accounted for ¾ of the elite to a situation where private-sector business people and professionals are the majority of the new elite.
A different way of looking at the social change among the elite consists in looking at the share of elite income received by different classes (Figure 4). In 1988, 76 percent of elite
income was received by workers, clerical employees and government officials. (This was exactly equal to the percentage of people from these three classes who were part of the elite). At that time owners of large and individual businesses received only 5 percent of total elite income, slightly in excess of their then share of 3 percent in total number of elite individuals. Finally, professionals received 18 percent.
This has dramatically changed since. By 2013, workers, employees, and government officials earned only 41 percent of elite total income (while, as we have seen, representing 46 percent in terms of the people among the elite) while business owners (of the two kinds) received 27 percent of total elite income, and professionals 32 percent. Therefore, the domination of professionals and business owners among the new elite is even stronger when measured in terms of elite income than in terms of number of people among the elite. This is due to the fact that owners tend to have higher incomes that other members of the elite. In 2013, private-sector and individual business owners, “the homo novi” of the Chinese transition, got 27 percent of all elite income while representing 20 percent of elite members. Thus their income was, on the average, 35 percent higher than the average elite income. Accordingly,
30 We use interchangeably the terms individual business owner and entrepreneur. “Owners” are (as explained in
25
business owners’ importance among the top 1% is even greater than among the top 5%: they account for a third of the people in the top 1% and receive (in 2013) a whopping 46 percent of all top 1% incomes (see Table 3).
There are, of course, obvious issues of classification to which we alluded in Section III. Lumping professionals with business owners may not be fully appropriate since many
professionals may be employed by state-owned companies or by the government. But there too, as Figure 5 illustrates, there has been a movement in favor of the private sector. In 1988, almost all professionals were employed by the state and collective sectors; in 2013, only two-thirds were. The other third worked in the private and foreign-owned companies. Thus, the percentage of people among the elite whose incomes are private-sector related increased from 5% in 1988 (when all professionals were employed by the public sector) to almost 40% in 2013.31 The increase in social classes whose livelihood is not related to the state among the
elite is perhaps the most dramatic reflection of the deep changes underwent by the urban China in the past thirty years.
31 The latter number is obtained as the sum of income by private and individual business owners (27%) plus
26
Figure 5: Distribution of the members of the elite who are professionals by sector of ownership
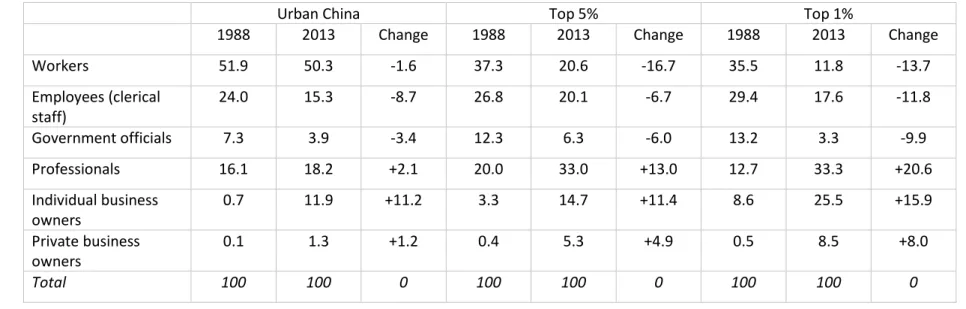
Finally, a third way to look at the change in the elite composition is to compare the social structure of the elite with that of all Chinese urban population. Here, in effect, we ask the question: to what extent is the rising share of the business owners among the elite a product of the generally rising importance of business owners in China? We note from Table 3 that while the increase in the share of individual (small) business owners among the population matches almost perfectly its rise among the elite (both rose by a little over 11 percentage points), the number of private (big) business owners among the elite rose more sharply than its numbers among the Chinese urban population (almost 5 percentage points vs. 1.2 percentage points). The likelihood of private business owners to be among the elite has remained about 4 to 5 times greater than that of the other categories combined. In conclusion, the rising importance of private and individual business owners among the elite seems to be a reflection of an overall increase in the numbers of entrepreneurs and capitalists, who also tend to be much richer than the average person, rather than the product of an exceptional enrichment of business owners as such. 0% 10% 20% 30% 40% 50% 60% 70% 80% 90% 100% 1988 1995 2002 2013 Other Foreign Private Public (incl. collective)
27
The conclusion however is different when it comes to workers. Their share among the entire urban population has hardly changed between 1988 and 2013 (minus 1.3 percentage points), but their importance among the elite collapsed by almost 17 percentage points. Thus, while in 1988, a worker’s chances to be among the five percent richest urban adults was about 0.7 (compared to the average of all social groups=1), it decreased to only 0.4.
28
Table 3. Social composition of the top 5% and top 1% of adults in urban China in 1988 and 2013 (in percentage of adults members of the top 5% and top 1%)
Urban China Top 5% Top 1%
1988 2013 Change 1988 2013 Change 1988 2013 Change
Workers 51.9 50.3 -1.6 37.3 20.6 -16.7 35.5 11.8 -13.7 Employees (clerical staff) 24.0 15.3 -8.7 26.8 20.1 -6.7 29.4 17.6 -11.8 Government officials 7.3 3.9 -3.4 12.3 6.3 -6.0 13.2 3.3 -9.9 Professionals 16.1 18.2 +2.1 20.0 33.0 +13.0 12.7 33.3 +20.6 Individual business owners 0.7 11.9 +11.2 3.3 14.7 +11.4 8.6 25.5 +15.9 Private business owners 0.1 1.3 +1.2 0.4 5.3 +4.9 0.5 8.5 +8.0 Total 100 100 0 100 100 0 100 100 0
29 4. Educational level of the elite
The top 5% have become much more educated between 1988 and 2013 with those with university education, rather than those with lower middle school, being the most important group (Table 4), and a much greater share of the total top 5% income is received by the highly educated (Table 5). At the beginning of the period, only 12 percent of the total elite income went to the university-educated members and 15 percent was received by these with only primary education. By the end of the period, the proportions were 44 and 1 percent.
Figure 6 illustrates the steady nature of the shift toward a more educated elite. The increase in the share of the university- and polytechnic-educated members was constant throughout the years studied here.
Is the increase in the share of the top 5% income received by the highly-educated simply the result of an overall increase in the education level in urban China, or greater recruitment (or higher average income level) of the university-educated who are members of the elite? As Tables 4 and 5 show, both effects matters, but the latter seems to have been stronger. In urban China overall, the share of income earned by the university-educated increased by 17
percentage points while among the elite it grew by almost twice as much (32 percentage points). For the middle educational categories, the changes in urban China overall and in the elite were about the same—and of course for the bottom education categories, their drop in the elite income was sharper than in the urban China overall. In conclusion, the urban elite became more educated with its education level increasing faster than in the urban China overall, and a much larger part of elite income was earned by those with university education.32
32 Note that the quasi equivalence of the shares of educational categories by numbers and by total income among
the top 5% (Tables 2 and 3) implies that incomes of members of different educational groups, once they are part of the top 5%, do not differ much. Thus the mean income of university-educated members of the top 5% is equal to the mean income of all members of the top 5% (their shares in total numbers and in total income is the same: 44 percent). This was, by the way, the case in 1988 too when both shares were also equal, at much lower level of 12 percent. We shall find the same result below (Section VI): conditional on being in the elite, returns to education are close to zero.
30
Table 4. Educational attainment in all urban China and the elite in 1988 and 2013 (in percent)
Education Urban China Top 5%
1988 2013 Change 1988 2013 Change University 6 15 +9 12 44 +32 Polytechnic 6 15 +9 7 22 +15 Vocational 10 10 0 9 8 -1 Upper middle 22 18 -4 20 14 -6 Lower middle 38 29 -9 33 10 -23 Primary 14 11 -3 15 1 -14 No primary 6 3 -3 0 0 0 Total 100 100 0 100 100 0
Table 5. Distribution of total and elite income among different educational categories in 1988 and 2013 (in percent)
Education Urban China Top 5%
1988 2013 Change 1988 2013 Change University 7 24 +17 12 44 +32 Polytechnic 7 19 +12 7 20 +13 Vocational 11 11 0 9 10 +1 Upper Middle 21 17 -4 22 14 -8 Lower Middle 36 22 -14 35 11 -24 Primary 13 6 -7 15 1 -14 No Primary 5 1 -4 2 0 -2 Total 100 100 0 100 100 0
31
Figure 6. Distribution of the top 5% income share among people of different educational attainment (in percent)
Note: The graph shows the distribution of the total income received by the top 5% between different educational categories. 12% 17% 27% 44% 7% 22% 30% 20% 9% 17% 13% 10% 22% 19% 20% 14% 35% 22% 9% 11% 15% 4% 2% 1% 0% 10% 20% 30% 40% 50% 60% 70% 80% 90% 100% 1988 1995 2002 2013 Primary LowMiddle UpMiddle Professional Polytech. University
32 5. Regional distribution of the Chinese urban elite
It is well-known that China is regionally diverse and unequal: Eastern provinces are much richer and grew at a higher rate than the rest of China (see Table 6). Although these differences are even greater when we combine rural and urban areas (because of the greater importance of generally poorer rural areas in Western and Central China) they are still large even when we consider urban areas alone. In 2013, Eastern urban region had an income level some 40 percent higher than the Center and the West and that gap was greater than it was at the beginning of the period under study here. The Eastern region is also more unequal than the other two, whether measured by the Gini or by the top 5% share. Not surprisingly, between 1988 and 2013 inequality increased in all three regions quite dramatically, with the elite income share in the East going from 13.6 percent of total (Eastern) urban income to more than a fifth. The change was only slightly less dramatic in the other two regions.
Consequently, the East was and remains the richest and the most unequal region. It is therefore not surprising that the lion’s share of all-China urban elite’s income is earned in the Eastern provinces (see Figure 7). The share of the East has even slightly increased (from 69 to 73 percent) while the shares of the other two regions have correspondingly declined by 1 and 2 percentage points between 1988 and 2013. What the figures highlight however is the
remarkable stability in the regional distribution of the elite: while the composition of elite income, its social structure, and education have all changed in a remarkable fashion, its geographical concentration has not been much affected. One may conclude that whether the urban Chinese elite tends to be composed of social classes who are more, or less, linked with the state, or are more entrepreneurial or less, their geographical location does not seem to vary.
33
Table 6. Income level and inequality in Eastern, Central and Western China (urban areas)
Note: Real income expressed in 2010 yuans (CPI from World Development Indicators 2018).
Figure 7. The shares of the three regions in total urban China’s elite income
19% 8% 7% 18% 69% 82% 85% 73% 12% 10% 8% 10% 0% 10% 20% 30% 40% 50% 60% 70% 80% 90% 100% 1988 1995 2002 2013 West East Center
Average nominal Income level (current yuan per
adult)
Average real income level
(2010 yuan per adult) Gini Top 5% share
1988 2013 Average change (% p.a.) 1988 2013 Average change (% p.a.) 1988 2013 Change (% points) 1988 2013 Change (% points) Eastern region 2114 38221 12.3 5541 34384 7.6 28 45 +17 13.6 20.4 +6.8 Central region 1716 27226 11.7 4496 24493 7.0 26 45 +19 11.7 18.3 +6.6 Western region 1880 27121 11.3 4928 24399 6.6 27 41 +14 11.7 16.4 +4.7 Ratio: East/West 1.1 1.4 1.1 1.4
34
The next question we ask is whether the social composition of the elite—namely, the gradual movement toward a private-sector elite which is the most salient feature of elite change in this period—has played differently in the three regions. Table 7 shows the evolution of the class structure among the top 5% in the three regions, where, in order to highlight the role of the private sector we have merged the six principal social groups into three: (a) private business owners and the self-employed, (b) professionals, and (c) workers, government officials, and clerical staff. In all regions, the first two groups have expanded and the third has shrunk. For example, in the Central region (where the share of the private sector group among the elite is the greatest), its share has gone up from 6 percent of population in 1988 to 36 percent in 2013. The professionals’ share in the Central provinces has increased from 22 percent to 28 percent. Consequently, the importance of government-connected elite has literally halved: from 72 percent to 36 percent. The evolution in the other two regions has been very similar. Just to highlight the magnitude of the change, note that the private business people’s share in the elite ranged between 3 and 6 percent (in the three regions) in 1988 while 25 years later it was between 16 and 36 percent.
The results thus strikingly illustrate the overturning social (or class) composition of China’s urban elite across all regions. They show that the all-China results are not driven by one or another region only: they are present in all geographical areas. Obviously, some regions (e.g. the West) may have a greater share of government-linked individuals in the elite, but the key finding, and the key similarity, is the one relating to the direction of change: in all regions, the past 25 years have brought the rising dominance of private sector-linked groups and
professionals among the elite. Although the direction of the change was uniform, the extent of change differed between the regions. The most dramatic changes occurred in the Center where private-sector-related elites increased the most. The East experienced the most significant rise of professionals, while the West experienced a slightly more modest rise in the importance of the private-sector classes and professionals.
35
Table 7. Shares of the private business-linked, professionals, and government-linked elites in the top 5% (regional-distribution; in percent)
Center East West
1988 2013 Change (% p.a.) 1988 2013 Change 1988 2013 Change Owners and the self-employed 6 36 +30 3 16 +13 4 18 +14 Professionals 22 28 +6 20 35 +15 20 27 +7 Government and workers 72 36 -36 77 48 -29 76 55 -21 Total 100 100 0 100 100 0 100 100 0
Note: The universe is composed of the top 5% adults in all China, and the table shows their regional and social distribution. (In other words, this is not the top 5% elite specific to each individual region). 100 for each region sums all members of the all-China top 5% elite that are located in a specific region.
36 Section V. The role of the CCP membership
1. The representation of CCP members in top income groups and their relative income
The share of CCP members among the elite (both the top 5% and the top 1%) increased continuously between 1988 and 2002, and then dropped rather precipitously between 2002 and 2013. By 2013, the share was lower than at the beginning of the period. Both the levels and the evolution of the share are very similar for the top 5% and the top 1%. As Figure 8 illustrates, at its peaks, CCP membership in both elite groups exceeded one-half, and among the top 1% it reached almost 60 percent. But by 2013, CCP members were only one-third of the top 5% and slightly under one-quarter of the top 1%.
Figure 8. The share of CPP members among the elite
0% 10% 20% 30% 40% 50% 60% 70% 80% 90% 100% 19 88 19 95 20 02 2 0 1 3 19 88 19 95 20 02 20 13 CCP members Other Top1% Top 5%
37
However, CCP members in the top 1% became relatively richer, compared to the average income of the rest in the top 1%. In all years prior to 2013, the relative income of CCP members was about the same as the relative income of other members of the elite whether among the group that comprises percentiles 91-95, percentiles 96-99, or the top 1%. But In 2013, we note a significant increase in their relative income in the highest income group where CCP members have, on average, an income 20 percent above the mean of the group (or 25 percent above the income of non-members; see Figure 9). One can therefore conclude that CCP members who are very rich are now fewer in numbers (their participation in the elite groups is less) but they are, at the very top, relative to their non-Party peers, richer than in the past. The divergence of the CCP members who are in the top 1% from the rest of CCP membership, and obviously from the population at large is a topic to which we shall return.
Figure 9. Income of CCP members of the elite groups compared to the average income of all elite members
Note: The graph shows the average income of CCP members who are part of percentiles 91 to 95 (left), percentiles 96 to 99 (middle) and the top percentile (right) relative to the mean income of that group. Value of 1 indicates that average income of CCP members is the same as the average income of the group (and hence also to the average income of non-Party members).
0.8 0.9 1.0 1.1 1.2 1.3 1988 1995 2002 2013 1988 1995 2002 2013 1988 1995 2002 2013
38 2. CCP membership and social class
Table 8 shows the social structure of CCP membership overall and of CCP members who are part of the top 5% in the beginning and at the end of the period (for the entire period see Figures 10 and 11). We note that in 1988 the two social structures (overall and the elite) were practically the same: the percentage of workers or government officials in total CCP
membership was very closely reflected in the share of such social groups among the top 5%. Thus, for example, the most numerous social group in CCP membership in 1988, employees (clerical workers), accounted for 39 percent of all CCP members and 34 percent of CCP
members in the top 5%; similarly, government officials were 23 percent of all members and 26 percent of CCP members in the elite. The implication of this finding is that belonging to one versus another large social group—once one is a CCP member—was not a factor that mattered for one’s income level. In other words, CCP members who were government officials were just slightly more likely (26/23=1.1) to be members of the elite than CCP employees (34/39=0.9) or even CCP workers (12/16=0.75). This means that the within-social-group income distributions of CCP members were quite similar.
Table 8. Distribution of CCP members among different social classes in 1988 and 2013 (in percent)
Social class All CCP members CCP members in the top 5%
1988 2013 Change 1988 2013 Change Workers 16 30 +14 12 15 +3 Employees (clerical staff) 39 32 -7 34 33 -1 Government officials 23 8 -15 26 9 -17 Professionals 23 26 +3 28 38 +10 Individual entrepreneurs 0 3 +3 0 3 +3 Larger business owners 0 1 +1 0 2 +2 Total 100 100 0 100 100 0
Note: The table shows the distribution by social class of all CCP members and of CCP members who are part of the top 5%.
39
But in 2013, not only has the social composition of membership changed, bringing in private sector businessmen and increasing significantly the participation of workers and
professionals, but belonging to different social groups affected one’s likelihood of being part of the elite. Not unexpectedly, the share of private businessmen who are CCP members in the elite is greater than their share in the overall CCP membership (that is, private businessmen members of CCP have a more top-heavy distribution than say, workers who are members of CCP). The likelihood of workers CCP members being part of the elite diminished: it is only ½ of the average (15 percent of CCP members in the elite are workers vs. 30 percent of all CCP membership who are workers), while the likelihood of professionals CCP members being part of the elite increased (38/26=1.5). Thus, professionals who are CCP members are now three times as likely to be part of the moneyed elite than workers who are also CCP members. The last finding means that professionals who are CCP members are over-represented among the rich, and workers under-represented. In other words, the within-social-group income distributions of CCP members are no longer similar. This has implications as to how we regard the social composition of the Chinese Communist Party. If we look at the overall membership, it is
apparent that seven out of each ten members are part of the “older”, in the past strongly state-dependent, categories such as workers, clerical staff and government officials. But if we look at the rich (elite) Party members, the breakdown is 57 to 43 percent between the “old” and the “new” classes. In other words, while the Party overall has still a majority membership of the “old” social groups, its top is increasingly dominated by the “new” social groups.
40
Figure 10. Social composition of CCP membership (percentage of people)
Figure 11. Social composition of CCP members, who are part of the elite (top 5%) (percentage of people) 0%0% 0%0% 1%1% 1%3% 23% 24% 24% 26% 23% 36% 27% 8% 39% 23% 27% 32% 16% 17% 20% 30% 0% 10% 20% 30% 40% 50% 60% 70% 80% 90% 100% 1988 1995 2002 2013 Worker Clerical Government Professionals Indiv.Business Owners 0%0% 0%1% 1%1% 3%2% 28% 30% 36% 38% 26% 40% 35% 9% 34% 19% 20% 33% 12% 11% 6% 15% 0% 10% 20% 30% 40% 50% 60% 70% 80% 90% 100% 1988 1995 2002 2013 Worker Clerical Government Professionals Indiv.Business Owners