Abundances in Electron Capture Dissociation
of Amphipathic Peptides and Proteins
Hisham Ben Hamidane,
aHuan He,
b,cOleg Yu. Tsybin,
dMark R. Emmett,
b,cChristopher L. Hendrickson,
b,cAlan G. Marshall,
b,cand Yury O. Tsybin
aaBiomolecular Mass Spectrometry Laboratory, Ecole Polytechnique Fédérale de Lausanne, Lausanne, Switzerland bIon Cyclotron Resonance Program, National High Magnetic Field Laboratory, Florida State University, Tallahassee, Florida, USA
cDepartment of Chemistry and Biochemistry, Florida State University, Tallahassee, Florida, USA dIon Physics Laboratory, Radiophysics Faculty, State Polytechnical University, Saint-Petersburg, Russia
The rules for product ion formation in electron capture dissociation (ECD) mass spectrometry of peptides and proteins remain unclear. Random backbone cleavage probability and the nonspecific nature of ECD toward amino acid sequence have been reported, contrary to preferential channels of fragmentation in slow heating-based tandem mass spectrometry. Here we demonstrate that for amphipathic peptides and proteins, modulation of ECD product ion abundance (PIA) along the sequence is pronounced. Moreover, because of the specific primary (and presumably secondary) structure of amphipathic peptides, PIA in ECD demonstrates a clear and reproducible periodic sequence distribution. On the one hand, the period of ECD PIA corresponds to periodic distribution of spatially separated hydrophobic and hydrophilic domains within the peptide primary sequence. On the other hand, the same period correlates with secondary structure units, such as ␣-helical turns, known for solution-phase structure. Based on a number of examples, we formulate a set of characteristic features for ECD of amphipathic peptides and proteins: (1) periodic distribution of PIA is observed and is reproducible in a wide range of ECD parameters and on different experimental platforms; (2) local maxima of PIA are not necessarily located near the charged site; (3) ion activation before ECD not only extends product ion sequence coverage but also preserves ion yield modulation; (4) the most efficient cleavage (e.g. global maximum of ECD PIA distribution) can be remote from the charged site; (5) the number and location of PIA maxima correlate with amino acid hydrophobicity maxima generally to within a single amino acid displacement; and (6) preferential cleavage sites follow a selected hydrogen spine in an ␣-helical peptide segment. Presently proposed novel insights into ECD behavior are important for advancing understand-ing of the ECD mechanism, particularly the role of peptide sequence on PIA. An improved ECD model could facilitate protein sequencing and improve identification of unknown proteins in proteomics technologies. In structural biology, the periodic/preferential product ion yield in ECD of␣-helical structures potentially opens the way toward de novo site-specific secondary structure determination of peptides and proteins in the gas phase and its correlation with solution-phase structure. (J Am Soc Mass Spectrom 2009, 20, 1182–1192) © 2009 Published by Elsevier Inc. on behalf of American Society for Mass Spectrometry
B
iomolecular fragmentation in the gas phase by electron capture dissociation (ECD) [1–3] andelectron-transfer dissociation (ETD)[4, 5]is
par-ticularly attractive for mass spectrometry (MS)– based peptide and protein structural analysis. In ECD/ETD, interaction of a multiply charged peptide or protein ion
with an electron/anion results in cleavage of NOC␣
bonds along the peptide backbone, including
charge-site-remote backbone cleavages [2]. ECD is useful for
peptide sequence tag generation on a chromatographic timescale for protein identification in bottom-up mass
spectrometry [6], de novo peptide sequencing [7],
recognition of amino acid chirality [8], location and
structural determination of single and multiple
post-translational modifications (PTMs) in peptides[9, 10],
sequencing and PTM analysis of large proteins (up to
50 – 60 kDa) [11], and providing insight into protein
secondary and tertiary structures in the gas phase [12,
13]. ETD has already demonstrated high potential in
several ECD application areas and continues to gain attention in peptide and protein structural analysis,
especially in (phospho)proteomics[5, 14, 15].
Address reprint requests to Prof. Dr. Yury O. Tsybin, Ecole Polytechnique Fédérale de Lausanne (EPFL), Biomolecular Mass Spectrometry Laboratory, Institute of Chemistry and Chemical Engineering, BCH 4307, 1015 Lau-sanne, Switzerland. E-mail:[email protected]
Published online February 13, 2009 © 2009 Published by Elsevier Inc. on behalf of American Society for Mass Spectrometry. Received December 6, 2008
1044-0305/09/$32.00 Revised January 14, 2009
Revealing the influence of amino acid distribution and other precursor ion properties, such as number and location of charges, on ECD product ion formation has improved the fundamental understanding of ion– elec-tron and ion–ion reactions[13, 16 –18]and demonstrates
potential toward practical utility [19, 20]. ECD is
gen-erally less specific than collision-induced dissociation (CID) and is reported not to have a significant preference
toward any, except SOS, bond cleavage. As a result,
fragmentation of a number of peptides studied since first ECD implementation in 1998 has not revealed a structured pattern or a direct correlation with single amino acid
properties[16, 20]. Nevertheless, product ion abundance
(PIA) distribution in ECD of peptides is believed to depend on peptide secondary structure in the gas phase
[13]. Recent experimental and theoretical progress
con-firms the important role of hydrogen bonds in the
back-bone cleavage mechanism[21], allows better prediction of
ECD product ion distribution [22–24], and establishes
correlation with gas-phase peptide and protein structures [12, 25, 26]. However, the high structural complexity of peptides and proteins limits computational capabilities
[21]and complicates analysis of the experimental results.
Advances in ECD/ETD applications have been accompa-nied by development of an array of other MS-based techniques and methods to address specific peptide and protein conformation-induced effects. In particular, ion mobility mass spectrometry (IM MS) has been used for targeted and high-throughput
characteriza-tion of ␣-helical peptide properties in the gas phase
[27–29]. The combination of mass spectrometry with gas-phase ultraviolet/infrared (UV/IR) spectroscopy has provided evidence for helical structure in gaseous
protein ions [30] and poly-Ala peptides [31].
Colli-sion-induced dissociation of peptide cations in the gas phase has been linked to peptide structure
stabil-ity and secondary structure elements[32, 33].
Understanding of peptide sequence and structure effects on fragmentation in tandem mass spectrometry (MS/MS) can be facilitated by selection of a class of biomolecules of interest with well-defined structural properties. In general, amino acids have strong
position-dependent probabilities of appearance in ␣-helical or
-strand peptides and proteins[34]. Amphipathic
pep-tides are those that exhibit a periodic (typically every 3 to 4 residues) distribution of hydrophobic and
hydro-philic amino acids along the peptide backbone[35]. The
characteristic amino acid distribution in amphipathic peptides results in formation of two opposite faces: hydrophobic and hydrophilic. Among a variety of different secondary structures formed by spatially segregated hydrophobic and hydrophilic regions
upon peptide folding, amphipathic ␣-helices occur
most frequently. Therefore, we selected the class of amphipathic peptides and proteins to probe ECD char-acteristics, to improve both fundamental and practical aspects of ECD in MS/MS. Projection of ECD Fourier transform ion cyclotron resonance (FT-ICR) MS results to ETD in ion trap MS is considered as a second step
and will require estimation of ion cooling at the higher
pressure of ETD experiments[36].
As discussed in the following text, ECD FT-ICR MS applied to amphipathic peptides and proteins demon-strates a striking periodic sequence variation in ECD PIA. We first describe periodic ECD PIA extending over
several turns of an ␣-helical transmembrane domain
(M2 transmembrane peptide [TMP]), of the influenza virus A membrane protein M2. We then extend inves-tigation of periodic sequence distribution of ECD PIA for various amphipathic peptides and proteins. As a summary, we compile a set of general rules for ECD of amphipathic peptides and proteins. Finally, we briefly elaborate on the possible influence of peptide primary and secondary structures on ECD PIA.
Experimental
Sample Preparation
Standard peptides and proteins were obtained from Sigma–Aldrich (St. Louis, MO, USA), American Peptide Company, or synthesized by fluorenylmethyloxycar-bonyl (Fmoc) solid-phase peptide synthesis (Peptide and Protein Synthesis Facility, University of Lausanne, Switzerland) and used without further purification. Peptides were dissolved in water and acetonitrile (50: 50, vol/vol) with addition of 0.1% formic acid. A myoglobin digest was performed with trypsin and
Asp-N following a standard procedure [37]. Tryptic
digestion was performed with 50L containing 1 nM
myoglobin and⬃35.5 pM trypsin in 50 mM (NH4)2CO3
buffer (pH 8.0) at 1:20 enzyme:protein ratio by weight.
Asp-N digestion was performed with 50L containing
1 nM myoglobin and ⬃12.5 pM Asp-N in 50 mM
sodium phosphate buffer (pH 8.0) at 1:50 enzyme: protein ratio by weight. Formic acid was added to acidify the solution and stop digestion after sample
incubation at about 37 °C overnight [37]. Mixtures of
enzymatic peptides were HPLC purified before sample preparation for electrospray ionization. The wild-type transmembrane domain M2 TMP samples were ob-tained in collaboration with the NMR Program, Na-tional High Magnetic Field Laboratory, Tallahassee, FL (Dr. T. A. Cross). Antimicrobial peptides, piscidin 1 and piscidin 3, in amide and free acid forms were obtained through collaboration with Dr. Myriam L. Cotten (Pa-cific Lutheran University, Tacoma, WA).
Tandem Mass Spectrometry
Electron capture dissociation (ECD) and activated ion (AI)-ECD experiments were performed with a
previ-ously described 9.4 T FT-ICR mass spectrometer [38 –
40]and a recently installed hybrid 12 T LTQ FT-ICR MS
(Thermo Fisher Scientific, Bremen, Germany). Either Nanomate or TriVersa electrospray ion source inter-faces (Advion Biosciences, Ithaca, NY, USA) were used
nL/min. The 9.4 T FT-ICR MS was operated as follows. After 1 to 2 s accumulation and precursor ion selection in the external octopole ion trap, ions were transported by a radiofrequency octopole ion guide into an open-ended cylindrical ICR trap[17]. Gated ion trapping was used without cooling gas. For ECD experiments, a variable delay period (typically 50 ms at 10 V trapping voltage) was used to optimize ion magnetron motion
phase[41]; a 3-mm-diameter electron beam (1–100 ms)
was then injected into the ICR trap, followed by an
electron clean-up event (100 ms) [40, 42]. The cathode
potential during electron injection was⫺5 V and kept at
⫹10 V otherwise. Accelerating grid voltage was at ⫹5 V
during electron injection and at ⫺200 V otherwise. A
multiple-pass electron injection regime was used
(trans-fer octopole DC offset ⫺60 V) [40, 42]. For AI-ECD
experiments, precursor ions were activated by CO2IR
laser irradiation (50 –100 ms at⬃25 W continuous-wave
laser output power; the laser was equipped with a 2.5⫻
beam expander to improve overlap with the ion cloud)
before electron injection[39]. ECD with post-activation
of charge-reduced species was achieved with IR laser irradiation introduced after ECD and electron clean-up
events[39]. Product ions were allowed to cool before
frequency-sweep excitation followed by broadband de-tection. The time-domain transient signal was baseline corrected, Hanning apodized, zero-filled, and Fourier transformed to produce a magnitude-mode frequency spectrum that was converted to a mass-to-charge ratio
spectrum by the quadrupolar approximation [43, 44].
Data acquisition was performed by use of a Predator
data station [45] and data analysis with MIDAS 3.21
software. Experiments with the 12 T LTQ FT-ICR MS were done following standard ECD/AI-ECD technol-ogy described for similar instruments equipped with 7
and 12 T superconducting magnets[46, 47]. Raw
tran-sient time-domain data were recorded in addition to Fourier-transformed data to allow subsequent data analysis with both Xcalibur (Thermo Fisher Scientific) and MIDAS 3.21 software.
ECD PIA Analysis
The results are presented as ECD PIA of (corresponding to the most abundant isotopomer in each product ion isotopic cluster, which may include both radical and
prime components) as a function of NOC␣ bond or
amino acid residue number. The number of the NOC␣
bond corresponds to the number of the amino acid in a
peptide sequence. Therefore, rupture of NOC␣ bond
number “n” in peptide with “m” amino acids may lead
to formation of c-ions with number “n⫺ 1” and z-ions
with number “m ⫺ n ⫹ 1.” The abundance of
C-terminal (z-type) ions is labeled according to the
corre-sponding ruptured NOC␣ bond number (counting
from the N-terminus) and not in the order of standard z-ion numbering (counting from the C-terminus). In that way, the complementary pair of c- and z-ions that
correspond to a particular NOC␣bond cleavage may be
overlaid for more direct comparison. The listed PIA for ECD ions is relative to the most abundant product ion in the corresponding c- or z-ion series. Abundances of multiply charged product ions were divided by the corresponding number of charges to comply with the induced current method of ion detection in FT-ICR MS. The amino acid hydrophobicity scale used through-out the study was originally devised to describe trans-membrane domains in integral trans-membrane proteins by
Hessa et al. [48]. According to Hessa’s hydrophobicity
scale, hydrophobic amino acids have negative values and isoleucine is the most hydrophobic amino acid with
an assigned apparent free energy⌬Gapp value of ⫺0.6
kcal/mol [48]. Polar (hydrophilic) amino acids are
as-signed positive values. The most polar amino acid is
aspartic acid with⌬Gapp ⫽ 3.49 kcal/mol[48]. Several
other amino acid hydrophobicity scales—such as
Cor-nette[35], Kyte–Doolitle[49], transmembrane tendency
scale[50]— differ slightly from the Hessa scale.
Analy-sis of the major hydrophobicity scales confirms their applicability to describe a general trend of periodic distribution of hydrophobic and hydrophilic amino acids in amphipathic peptides and proteins.
Results and Discussion
ECD of Triply Charged Amphipathic Peptides
Wild-type M2 TMP (Ser-Ser-Asp-Pro-Leu-Val-Val-Ala- Ala-Ser-Ile-Ile-Gly-Ile-Leu-His-Leu-Ile-Leu-Trp-Ile-Leu-Asp-Arg-Leu) is a transmembrane domain of the
mem-brane protein M2 from influenza virus A[51].
Solution-phase and solid-state nuclear magnetic resonance
(NMR) data strongly suggest an ␣-helical structure
(⬃3.6 amino acids per turn, 5 turns in total, Protein Data
Bank or PDB [52]entry 1NYJ) for M2 TMP, which is a
fully functional proton channel[51]. ECD FT-ICR MS of
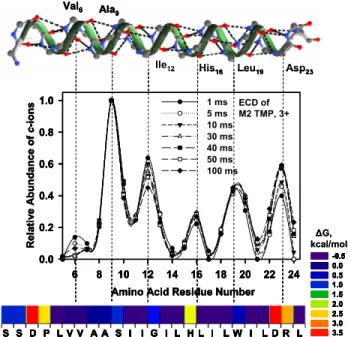
M2 TMP demonstrates extensive sequence coverage by both c- and z-type ions for triply protonated precursors (Figures 1and2, top). Only the c24product from ECD is
doubly charged, indicating preferential charge
neutral-ization at His16. Similar behavior was observed for a
wide range of electron irradiation periods, from 100 to
1 ms, as shown inFigure 1. Preferential ECD product
ion formation arises from cleavages at NOC␣ bond
numbers 3, 7, 10, 13, 17, 20, 21, and 24 for ECD of triply
charged M2 TMP (Figures 1and2, top). Yields of a- and
y-ions follow a similar pattern, but are not considered here in view of their low abundances.
ECD and activated-ion (AI)-ECD of doubly and triply charged M2 TMP produce periodic distributions of product ions with the most abundant z-type ions located at the same backbone sites for both precursor
charge states (Figure 2, top). Application of ECD to
triply charged model amphipathic peptides, AA9 and
LL9, is shown inFigure 3, and for a series of naturally
occurring antimicrobial peptides of amphipathic
na-ture, piscidins, inFigure 4and Supplementary Figure
article. The reproducibility of the results was confirmed by performing similar ECD experiments with a 14.5 T LTQ FT-ICR MS (National High Magnetic Field Labo-ratory [NHMFL], Tallahassee, FL, USA)[53], a 12 T LTQ FT-ICR MS (EPFL, Lausanne, Switzerland), a 9.4 T FT-ICR MS (NHMFL), a 9.4 T FT-ICR MS (Bruker Daltonics, Bremen, Germany), and a 7-T LTQ FT-ICR MS (Thermo Fisher Scientific, Bremen, Germany),
de-scribed elsewhere [54, 55]. The periodic character (e.g.
number and position of maxima) of ECD PIA for M2 TMP remains practically unchanged between different experimental setups. ECD PIA variation at each partic-ular backbone cleavage site is consistent with reported ECD PIA reproducibility and repeatability for other
peptides and does not exceed 10% on average [16].
ECD of Doubly Charged Amphipathic Peptides
ECD FT-ICR MS of doubly charged M2 TMP shows
only a few product ions (Figure 2, top). As expected,
more efficient fragmentation for vibrationally activated doubly charged precursors is obtained by activated ion ECD. Mainly z-type product ions and not c-ions are observed for ECD of doubly charged M2 TMP, support-ing the expected preferential charge retention by C-terminal Arg. Although less extensive, ECD of doubly
charged precursor ions nevertheless clearly indicates periodic abundance variation for z-type ions attributed to cleavages mainly in the N-terminal part of M2 TMP (Figure 2, top). Preferential product ion formation is the
result of cleavages at NOC␣bond numbers 3, 6(7), 10,
and 13 for ECD of doubly charged M2 TMP, in agree-ment with ECD of a triply charged peptide.
Similar general characteristics are observed for ECD of
other amphipathic peptides. For instance, Figure 2
(bot-tom) shows the influence of vibrational preactivation on ECD of AA9 peptide. Ion activation before ECD with laser powers of 10 and 20 W produces similar fragmentation patterns. N-terminal (c-ions) and C-terminal (z-ions) prod-uct ion distributions overlap in the middle of peptide
Figure 2. ECD and activated-ion (AI)-ECD FT-ICR MS relative PIA distribution for doubly protonated (top) transmembrane peptide M2 TMP (z-ions), and (bottom) amphipathic peptide AA9 (EAEKAAKEAEKAAKEAEK) (c- and z-ions), as a function of NOC␣bond number or amino acid residue number. Increased ion internal energy enhances formation of N- and C-terminal product ions toward the middle of the peptides. Higher charge state (triply charged compared to doubly charged M2 TMP) induces effects similar to AI-ECD of doubly charged peptides (top), with PIA maxima at similar NOC␣bond numbers for ECD and AI-ECD of doubly and triply charged peptide. Note that z-ions are indexed according to the corresponding NOC␣ bond number rupture, rather than conventional numbering from the C-terminus (see Experimental section). 6 8 10 12 14 16 18 20 22 24 0.0 0.2 0.4 0.6 0.8 1.0 1 ms 5 ms 10 ms 30 ms 40 ms 50 ms 100 ms Re la ti v e A bun dance of c -ion s ECD of M2 TMP, 3+ S S D P L V V A A S I I G I L H L I L W I L D R L S S D P L V V A A S I I G I L H L I L W I L D R L
Amino Acid Residue Number Pro4
Val6 Ala9
Ile12 His16 Leu19 Asp23
-0.5 0.0 0.5 1.0 1.5 2.0 2.5 3.0 3.5 -0.5 0.0 0.5 1.0 1.5 2.0 2.5 3.0 3.5 -0.5 0.0 0.5 1.0 1.5 2.0 2.5 3.0 3.5 -0.5 0.0 0.5 1.0 1.5 2.0 2.5 3.0 3.5 ΔG, kcal/mol 6 8 10 12 14 16 18 20 22 24 0.0 0.2 0.4 0.6 0.8 1.0 1 ms 5 ms 10 ms 30 ms 40 ms 50 ms 100 ms Re la ti v e A bun dance of c -ion s ECD of M2 TMP, 3+ S S D P L V V A A S I I G I L H L I L W I L D R L S S D P L V V A A S I I G I L H L I L W I L D R L
Amino Acid Residue Number Pro4
Val6 Ala9
Ile12 His16 Leu19 Asp23
-0.5 0.0 0.5 1.0 1.5 2.0 2.5 3.0 3.5 -0.5 0.0 0.5 1.0 1.5 2.0 2.5 3.0 3.5 -0.5 0.0 0.5 1.0 1.5 2.0 2.5 3.0 3.5 -0.5 0.0 0.5 1.0 1.5 2.0 2.5 3.0 3.5 6 8 10 12 14 16 18 20 22 24 0.0 0.2 0.4 0.6 0.8 1.0 1 ms 5 ms 10 ms 30 ms 40 ms 50 ms 100 ms Re la ti v e A bun dance of c -ion s ECD of M2 TMP, 3+ S S D P L V V A A S I I G I L H L I L W I L D R L S S D P L V V A A S I I G I L H L I L W I L D R L
Amino Acid Residue Number Pro4
Val6 Ala9
Ile12 His16 Leu19 Asp23
6 8 10 12 14 16 18 20 22 24 0.0 0.2 0.4 0.6 0.8 1.0 1 ms 5 ms 10 ms 30 ms 40 ms 50 ms 100 ms Re la ti v e A bun dance of c -ion s ECD of M2 TMP, 3+ S S D P L V V A A S I I G I L H L I L W I L D R L S S D P L V V A A S I I G I L H L I L W I L D R L
Amino Acid Residue Number Pro4
Val6 Ala9
Ile12 His16 Leu19 Asp23
-0.5 0.0 0.5 1.0 1.5 2.0 2.5 3.0 3.5 -0.5 0.0 0.5 1.0 1.5 2.0 2.5 3.0 3.5 -0.5 0.0 0.5 1.0 1.5 2.0 2.5 3.0 3.5 -0.5 0.0 0.5 1.0 1.5 2.0 2.5 3.0 3.5 ΔG, kcal/mol
Figure 1. Middle: ECD FT-ICR MS relative product ion abun-dance (PIA) distributions (c-ions) for triply protonated peptide M2 TMP as a function of amino acid residue number and electron irradiation period, demonstrating periodic sequence variation of PIA, reproducible over a wide range of electron irradiation periods (1–100 ms). Bottom: amino acid hydrophobicity distribu-tion in M2 TMP, showing periodicity in hydrophobic and hydro-philic amino acid location (color-coding scale according to Hessa et al.: blue denotes the most hydrophobic). Top: solution-phase ␣-helical structure of M2 TMP (PDB entry 1NYJ), demonstrating that periodicity in the ECD product ion distribution (3 or 4 amino acids per period) corresponds to that of an␣-helix (3.6 amino acids per turn).
sequence, at NOC␣ bond number ⬃9, thus providing complete sequence coverage of the middle part of the peptide. Further increase of IR laser power or irradiation period does not lead to expansion of the extent of c- or z-ion coverage, but induces a typical infrared multiphoton dissociation fragmentation pattern.
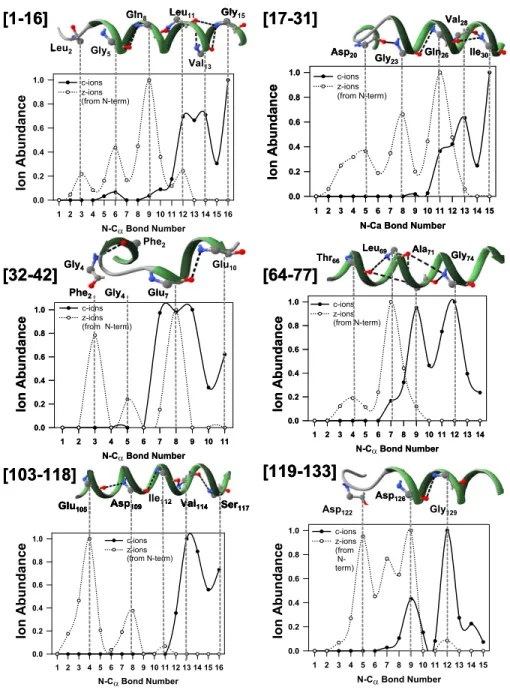
ECD FT-ICR MS of six doubly protonated horse myoglobin tryptic fragments ([1–16], [17–31], [32– 42], [64 –77], [103–118], and [119 –133]) without precursor ion vibrational activation (Supplementary Figure S2) and with vibrational activation (Figure 5) confirm pref-erential and sometimes periodic product ion formation
from peptides with mainly␣-helical or -turn
second-ary structure in solution (before protein digestion). Predominantly z-ions are observed because of preferen-tial charge retention at the C-terminal Lys or Arg basic residue upon electron capture, as expected for doubly charged tryptic peptides. The AI-ECD product ion distribution exhibits more complete sequence coverage than ECD, with c-ions extending further toward the N-terminus and z-ions further toward the C-terminus, as well as more extensive periodicity. A control exper-iment was performed by use of another enzyme, Asp-N, that produces a different set of enzymatic fragments. Importantly, similar preferential ECD prod-uct ion formation was observed (for example, for myo-globin fragment [85–108]; data not shown).
Supplementary Figure S2 demonstrates preferential
cleavage at the NOC␣ bond number 4 (zn⫺3) for
frag-ments with a distinct␣-helical or turn structure at the
N-terminus (fragments [1–16], [17–31], [64 –77], and
[103–118]). For extended solution-phase␣-helical
struc-tures, a periodic ECD product ion distribution is ob-served (fragments [1–16], [64 –77], and [103–118]). The
periodicity is more pronounced in AI-ECD data (Figure
5), demonstrating a period of 3 amino acids for the
specified myoglobin fragments.
The product ion distribution for myoglobin [119 – 133] differs by the presence of a local maximum
(cleav-age at the NOC␣ bond number 7) between two more
global maxima (NOC␣ bond numbers 5 and 9), more
evident in AI-ECD. Interestingly, amino acid hydropho-bicity distribution demonstrates a similar pattern in this sequence region. Furthermore, myoglobin fragment
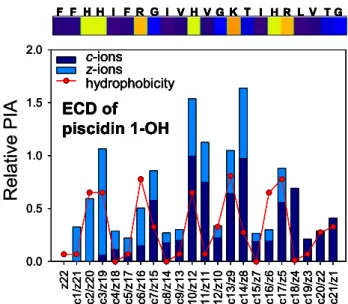
z22 c1/z21 c2/z20 c3/z19 c4/z18 c5/z17 c6/z16 c7/z15 c8/z14 c9/z13 c10/z12 c11/z11 c12/z10 c13/z9 c14/z8 c15/z7 c16/z6 c17/z5 c18/z4 c19/z3 c20/z2 c21/z1 0.0 0.5 1.0 1.5 2.0 I V G F F HH I FR G I V H V G K T I H R LV TG F F HH I FR G V H V G K T I H R L T c-ions z-ions hydrophobicity
ECD of
piscidin 1-OH
z22 c1/z21 c2/z20 c3/z19 c4/z18 c5/z17 c6/z16 c7/z15 c8/z14 c9/z13 c10/z12 c11/z11 c12/z10 c13/z9 c14/z8 c15/z7 c16/z6 c17/z5 c18/z4 c19/z3 c20/z2 c21/z1 0.0 0.5 1.0 1.5 2.0 I V G F F HH I FR G I V H V G K T I H R LV TG F F HH I FR G V H V G K T I H R L T c-ions z-ions hydrophobicityECD of
piscidin 1-OH
Relative PIA
z22 c1/z21 c2/z20 c3/z19 c4/z18 c5/z17 c6/z16 c7/z15 c8/z14 c9/z13 c10/z12 c11/z11 c12/z10 c13/z9 c14/z8 c15/z7 c16/z6 c17/z5 c18/z4 c19/z3 c20/z2 c21/z1 0.0 0.5 1.0 1.5 2.0 I V G F F HH I FR G I V H V G K T I H R LV TG F F HH I FR G V H V G K T I H R L T c-ions z-ions hydrophobicityECD of
piscidin 1-OH
Relative PIA
Figure 4. ECD FT-ICR MS relative PIA distribution for triply protonated amphipathic antimicrobial peptide piscidin 1 (FFHHI-FRGIVHVGKTIHRLVTG) in free acid form as a function of product ion number. N-terminal (c-ions) and C-terminal (z-ions) PIA are separately scaled relative to the most abundant ion in each PIA distribution. Labeling at the top of each panel is as inFigure 3. Data for piscidin 1 in amide form and for piscidin 3 in amide and free acid forms are shown in Supplementary Figure S1.
c1/ z17 c2/ z16 c3/ z15 c4/ z14 c5/ z13 c6/ z12 c7/ z11 c8/ z10 c9/z9 c10/z8 c11/z7 c12/z6 c13/z5 c14/z4 c15/z3 c16/z2 c17/z1 0.0 0.2 0.4 0.6 0.8 1.0 1.2 c1/ z17 c2/ z16 c3/ z15 c4/ z14 c5/ z13 c6/ z12 c7/ z11 c8/ z10 c9/z9 c10/z8 c11/z7 c12/z6 c13/z5 c14/z4 c15/z3 c16/z2 c17/z1 0.0 0.2 0.4 0.6 0.8 1.0 1.2 1.4
ECD of LL9 3+
E A E K A A K E A E K A A K E A E K E A E K A A K E A E K A A K E A E K E L E K L L K E L E K L L K E L E K E L E K L L K E L E K L L K E L E KRelativ
e PIA
Relativ
e PIA
c ions z ions hydrophobicity c ions z ions hydrophobicityECD of
AA9 3+
c1/ z17 c2/ z16 c3/ z15 c4/ z14 c5/ z13 c6/ z12 c7/ z11 c8/ z10 c9/z9 c10/z8 c11/z7 c12/z6 c13/z5 c14/z4 c15/z3 c16/z2 c17/z1 0.0 0.2 0.4 0.6 0.8 1.0 1.2 c1/ z17 c2/ z16 c3/ z15 c4/ z14 c5/ z13 c6/ z12 c7/ z11 c8/ z10 c9/z9 c10/z8 c11/z7 c12/z6 c13/z5 c14/z4 c15/z3 c16/z2 c17/z1 0.0 0.2 0.4 0.6 0.8 1.0 1.2 1.4ECD of LL9 3+
E A E K A A K E A E K A A K E A E K E A E K A A K E A E K A A K E A E K E L E K L L K E L E K L L K E L E K E L E K L L K E L E K L L K E L E KRelativ
e PIA
Relativ
e PIA
c ions z ions hydrophobicity c ions z ions hydrophobicityECD of
AA9 3+
Figure 3. ECD FT-ICR MS relative PIA distribution for triply protonated amphipathic peptides (top) AA9 (EAEKAAKEAEK-AAKEAEK) and (bottom) LL9 (ELEKLLKELEKLLKELEK) as a function of product ion number, demonstrating periodic PIA sequence variation. N-terminal (c-ions) and C-terminal (z-ions) PIA are separately scaled relative to the most abundant ion in each PIA distribution. The amphipathic nature of AA9 and LL9 is indicated by the sequence-periodic distribution of hydrophobic and hydrophilic amino acid residues shown (both above and included on the graph) and color-coded according to the Hessa hydrophobicity scale as inFigure 1.
[64 –77] differs from the others by location of a basic residue, His, at the N-terminus (the N-terminal proton can thus be shared between the N-terminal amide and basic residue), resulting in different gas-phase struc-tures and competition in formation of c-type and z-type ions.
Characteristic Features of ECD of Amphipathic
Peptides
In contrast to the PIA distribution for CID, product ion formation in ECD is believed to be nonspecific
regard-ing the cleavage site, leadregard-ing to much less pronounced variation of PIA in ECD than in CID. However, ECD of amphipathic peptides clearly demonstrates an order-of-magnitude sequence modulation of PIA. Overall, peri-odic variation of hydrophobic and hydrophilic amino acids in the primary structure of amphipathic peptides leads to the following ECD characteristics: (1) periodic PIA sequence variation is reproducible over a wide range of ECD parameters and from different experi-mental platforms; (2) PIA local and global maxima are not necessarily located near the charged site; and (3) ion activation before ECD not only extends product ion
N-C Bond Number 1 2 3 4 5 6 7 8 9 10 11 0.0 0.2 0.4 0.6 0.8 1.0 c-ions z-ions (from N-term) Glu7 Phe2 Gly4 Glu10 Gly4 Phe2 N-C Bond Number 1 2 3 4 5 6 7 8 9 10 11 12 13 14 0.0 0.2 0.4 0.6 0.8 1.0 c-ions z-ions (from N-term) Gly74 Thr66 Leu69 Ala71 N-Ca Bond Number
1 2 3 4 5 6 7 8 9 10 11 12 13 14 15 0.0 0.2 0.4 0.6 0.8 1.0 c-ions z-ions (from N-term) Val28 Ile30 Asp20 Gly 23 Gln26 N-C Bond Number 1 2 3 4 5 6 7 8 9 10 11 12 13 14 15 0.0 0.2 0.4 0.6 0.8 1.0 c-ions z-ions (from N-term) Gly129 Asp122 Asp126 N-C Bond Number 1 2 3 4 5 6 7 8 9 10 11 12 13 14 15 16 0.0 0.2 0.4 0.6 0.8 1.0 c-ions z-ions (from N-term) Ser117 Val114 Asp109 Glu105 Ile112 N-C Bond Number 1 2 3 4 5 6 7 8 9 10 11 12 13 14 15 16 0.0 0.2 0.4 0.6 0.8 1.0 c-ions z-ions (from N-term) Ser117 Val114 Asp109 Glu105 Ile112 N-C Bond Number 1 2 3 4 5 6 7 8 9 10 11 12 13 14 15 16 0.0 0.2 0.4 0.6 0.8 1.0 c-ions z-ions (from N-term) Val13 Leu11 Gly5 Leu2 Gln8 Gly15 N-C Bond Number 1 2 3 4 5 6 7 8 9 10 11 12 13 14 15 16 0.0 0.2 0.4 0.6 0.8 1.0 c-ions z-ions (from N-term) Val13 Leu11 Gly5 Leu2 Gln8 Gly15
]
7
7
-4
6
[
]
2
4
-2
3
[
[17-31]
[119-133]
[103-118]
[1-16]
Ion Abu n dan ce Ion Abundance Ion Abu n dan ce Ion AbundanceIon Abundance Ion Abundance
N-Cα Bond Number 1 2 3 4 5 6 7 8 9 10 11 0.0 0.2 0.4 0.6 0.8 1.0 c-ions z-ions (from N-term) Glu7 Phe2 Gly4 Glu10 Gly4 Phe2 N-Cα Bond Number 1 2 3 4 5 6 7 8 9 10 11 12 13 14 0.0 0.2 0.4 0.6 0.8 1.0 c-ions z-ions (from N-term) Gly74 Thr66 Leu69 Ala71 N-Ca Bond Number
1 2 3 4 5 6 7 8 9 10 11 12 13 14 15 0.0 0.2 0.4 0.6 0.8 1.0 c-ions z-ions (from N-term) Val28 Ile30 Asp20 Gly 23 Gln26 N-Cα Bond Number 1 2 3 4 5 6 7 8 9 10 11 12 13 14 15 0.0 0.2 0.4 0.6 0.8 1.0 c-ions z-ions (from N-term) Gly129 Asp122 Asp126 N-Cα Bond Number 1 2 3 4 5 6 7 8 9 10 11 12 13 14 15 16 0.0 0.2 0.4 0.6 0.8 1.0 c-ions z-ions (from N-term) Ser117 Val114 Asp109 Glu105 Ile112 N-Cα Bond Number 1 2 3 4 5 6 7 8 9 10 11 12 13 14 15 16 0.0 0.2 0.4 0.6 0.8 1.0 c-ions z-ions (from N-term) Ser117 Val114 Asp109 Glu105 Ile112 N-Cα Bond Number 1 2 3 4 5 6 7 8 9 10 11 12 13 14 15 16 0.0 0.2 0.4 0.6 0.8 1.0 c-ions z-ions (from N-term) Val13 Leu11 Gly5 Leu2 Gln8 Gly15 N-Cα Bond Number 1 2 3 4 5 6 7 8 9 10 11 12 13 14 15 16 0.0 0.2 0.4 0.6 0.8 1.0 c-ions z-ions (from N-term) Val13 Leu11 Gly5 Leu2 Gln8 Gly15
]
7
7
-4
6
[
]
2
4
-2
3
[
[17-31]
[119-133]
[103-118]
[1-16]
Ion Abu n dan ce Ion Abundance Ion Abu n dan ce Ion AbundanceIon Abundance Ion Abundance
Figure 5. Activated ion ECD FT-ICR MS relative PIA distribution for bottom-up structural analysis of horse myoglobin, demonstrating preferential cleavages for doubly charged tryptic peptides and indicating ion internal energy influence on ECD fragmentation pattern (compared to Supplementary Figure S2). Labeling at the top of each panel is as inFigure 1. Solution phase structures of horse myoglobin tryptic fragments are drawn as in the intact protein, PDB entry 1WLA.
sequence coverage but also preserves ion yield modu-lation.
The observed periodic modulation may be explained by existence of spatially distinct hydrophobic and hy-drophilic regions in the amino acid sequence. Schematic representation (the so-called␣-helical net) of the ideal-ized alpha helix shown in Scheme 1 allows visual identification of preferential ECD cleavage patterns.
A fragmentation map of the central part of M2 TMP, known from NMR to be␣-helical in solution and solid state, demonstrates preferential cleavages at the N-terminal or C-N-terminal side of a single hydrogen spine, and a turning point near the His16residue. Presumably,
the Coulombic potential induced by protonation at His16and Arg24is responsible for this shift. Preferential
fragmentation at the N-terminal side of Arg24and Asp3
takes place outside of the ␣-helical part of M2 TMP and indicates preferential product ion formation near hydrophilic residues (Asp and Arg are among the
most hydrophilic residues according to Hessa’s scale and others).
Following this approach,Scheme 2 shows preferen-tial ECD product ion formation projected onto the idealized ␣-helical net for myoglobin tryptic fragment [1–16].
Both ECD and AI-ECD clearly indicate preferential product ion yield ascribed to the cleavage N-terminal to the most polar residue in each␣-helical turn. Increased ion internal energy in AI-ECD may lead to the displace-ment of PIA maxima by one amino acid residue. The displacement in the central part of the␣-helix is toward a similarly hydrophilic amino acid. Preferential product ion yield shift toward a less hydrophilic amino acid in the N-terminal part of myoglobin [1–16] in AI-ECD is yet to be rationalized. The single amino acid resolution distribution of hydrophobicity along the peptide se-quence in amphipathic peptides AA9 and LL9 (Figure
3) and antimicrobial peptides, piscidins (Figure 4and
C13 N14 Ile C14N15 Leu O16 O13 H14 H15 C15 O15 N16 C10 N11Ile C11 N12 Ile O11 O10 H11 H12 C12 O12 N13 C7 N8Ala C8 N9 Ala O8 O7 H8 H9 C9 O9 N10 C4 N5 Leu C5 N6 Val O7 O4 H5 H6 C6 O6 N7 His H16 Gly H13 Ser H10 Val H7 C1 N2Ser C2 N3 Asp O2 O1 H2 H3 Ser C3 O3 N4 Pro H4 +H 3N C16 N17 Leu C17 N18 Ile O17 O16 H17 H18 C18 O18 N19Leu H19 C19 N20Trp C20 N21 Ile O20 O19 H20 H21 C21 O21 N22Leu H22 C22 N23 Asp C23N24 Arg O23 O22 H23 H24 C24 O24 N25Leu C25 OH O25 H25
+
+
+
His Gly Ser Val Pro+
+
+
Most abundant ECD product ions: ECD
Scheme 1. Schematic representation of hydrogen-bonded network in peptide M2 TMP (PDB entry 1NYJ) as an idealistic alpha helical net (a perfect␣-helix configuration with 3 H-spines). Preferential cleavage sites (the most abundant ECD product ions) of triply charged precursor M2 TMP ions are located on both sides of a single H-spine.
Supplementary Figure S1), confirms these observations. The comparative analysis of ECD PIA periodic distri-butions and periodic variation of amino acid hydropho-bicity in ␣-helical M2 TMP reveals a general rough correlation between the number and location of maxima for triply (Figure 1,Figure 2, top) and doubly (Figure 2,
top) charged M2 TMP (Figure 6). In good agreement
with the locations of the most abundant product ions for ECD of triply charged M2 TMP, the polar amino acids along the peptide backbone in M2 TMP are residues 3, 10, 13, 16, 20, 23, and 24. Preferential product
ion formation at the NOC␣bonds 17 and 21 indicates a
shift of a cleavage site by one residue toward the C-terminus.
Therefore, we can add the following characteristics of amphipathic peptide ECD: (1) the number and
loca-tion of PIA maxima correlate with amino acid hydro-phobicity maxima generally within a single amino acid displacement; and (2) preferential cleavage sites may be
located near a selected hydrogen spine in an ␣-helical
segment of a peptide. Nevertheless, correlation of PIA in ECD performed in the gas phase with amino acid hydrophobicity values obtained for solution phase will require more detailed thermodynamic understanding of gas-phase “hydrophobicity.”
Sequence-Periodic ECD: Current Understanding
Enhanced yield of ECD product ions within one
␣-helical turn toward the N-terminus from the protonated amino acid residue in proteins was observed by Breuker
et al. [12] and rationalized through a keto-enol type
tautomerism, as a result of partial charge-transfer along the hydrogen-bond network arising from the polariza-tion of backbone amide groups by basic amino acid side chains. In the cited work and previous works of that group, correlation between ECD PIA and secondary
(␣-helical) protein structure has been suggested.
Nev-ertheless, earlier reported experimental results did not
+ + + + + +
Figure 6. ECD FT-ICR MS relative PIA distribution (both c- and z-ions) for triply protonated peptide M2 TMP as a function of NOC␣bond number, demonstrating periodic PIA sequence vari-ation correlating with amino acid hydrophobicity distribution. Bottom: amino acid hydrophobicity distribution in M2 TMP, showing periodicity in hydrophobic and hydrophilic amino acid location (color-coding scale according to Hessa et al.). Top: solu-tion-phase ␣-helical structure of M2 TMP (PDB entry 1NYJ), demonstrating that periodicity of the ECD product ion distribu-tion (3 or 4 amino acids per period) corresponds to that of an ␣-helix (3.6 amino acids per turn).
C13 N14 Trp C14 N15 Gly O16 O13 H14 H15 C15 O15 N16 C10 N11 Leu C11 N12 Asn O11 O10 H11 H12 C12 O12 N13 C7 N8 Gln C8 N9 Gln O8 O7 H8 H9 C9 O9 N10 C4 N5 Gly C5 N6 Glu O7 O4 H5 H6 C6 O6 N7 Lys H16 Val H13 Val H10 Trp H7 C1 N2 Leu C2 N3 Ser O2 O1 H2 H3 Gly C3 O3 N4 Asp H4 +H 3N C16 O16 OH
-0.31
-0.31
-0.55
-0.55
3.49
0.30
2.71
0.84
2.68
2.36
2.05
0.74
0.30
2.36
0.74
Most abundant ECD product ions:
ECD AI-ECD ECD and AI-ECD
Scheme 2. Schematic representation of the hydrogen-bonded network in tryptic myoglobin fragment [1–16], that is known to have hydrophobic and polar faces, as an idealistic alpha helical net (a perfect ␣-helix configuration with 3 H-spines). Preferential cleavage sites (the most abundant ECD and AI-ECD product ions) are located next to the most hydrophilic residues for the doubly charged precursor peptide.
indicate several consecutive periods of ECD PIA and were not sufficient to deduce the characteristic features of amphipathic peptide ECD described here. Following hot hydrogen atom and related mechanisms of ECD suggested by McLafferty and colleagues, periodic ECD of amphipathic peptides arises from a set of specific preferential gas-phase conformations adopted by a bio-molecular ion. ECD PIA is thus a function of proton solvation propensity at a given peptide backbone site. Nevertheless, understanding of the role of amino acid nature (e.g. hydrophobicity) in this mechanism remains unclear.
Charge-site-remote and enhanced fragmentation ob-served in ECD of amphipathic peptides can be rational-ized within the framework of Turecˇek–Simons ECD mechanisms as a result of direct electron attachment to the * or, more probably, * orbital of the backbone carbonyl groups at the corresponding sites along the peptide sequence. Periodic distribution of PIA in ECD would then be explained by the characteristic location of not only basic, presumably protonated, amino acids (e.g., His16 and Arg24), but also neutral amino acids
(e.g., glycine) that can allow exothermic abstraction of an ␣-proton toward the long-lived amide anion in an excited electronic state [56, 57]. In M2 TMP, a Gly residue is located in the middle of the peptide, at
position 12, one␣-helix turn away from the basic His16
residue and therefore fulfilling the periodic require-ment. Although the Turecˇek–Simons approach was implemented specifically to rationalize formation of ECD product ions at charge-remote sites, it does not directly explain the presently observed modulation of PIA and does not suggest a general correlation with amino acid properties, except for basic residues and Gly.
The important role of hydrogen bonds in biological systems on PIA in ECD has been particularly outlined in the ECD mechanism suggested by Zubarev and colleagues and based on direct electron capture to the
neutral hydrogen bond of the ONOHO⫽CO group,
such as in ␣-helical and -sheet peptide and protein
structure units. Electron attachment leads to formation of an anionic site at the nitrogen atom and, at the same time, hydrogen atom transfer to the backbone carbonyl,
initiating NOC␣ bond rupture. The neutral hydrogen
bond mechanism has been tested on a small model protein, Trp cage, and demonstrated the best-to-date correlation between the PIA in ECD and the propensity of a given carbonyl to form hydrogen bonds. In the event that hydrogen bonding is not available, electron capture will follow the Turecˇek–Simons mechanism described earlier. Although the H-bond description of the ECD process takes into account hydrogen bonds
that form H-spines in␣-helical (amphipathic) peptides,
periodic variation of PIA in ECD of amphipathic pep-tides is not readily apparent from this approach. The recent work of Williams and coworkers on ECD of hydrated tripeptides further supports the influence of
hydrogen bonds on ECD[58]. They show that addition
of water molecules and formation of new hydrogen bonds increases the probability for typical ECD ions of c- and z-type to be formed instead of b-ions that presumably result from vibrational excitation of
precur-sor cations[58].
Periodic ECD: Influence of Hydrogen-Bonding
Networks
As an alternative to direct sequence–PIA correlation, the periodic ECD of amphipathic peptides may be influenced by the structure of their gas-phase hydrogen-bonding networks. From that perspective, correlation of PIA in ECD with amino acid hydrophobicity may be considered as a result of hydrogen-bonding net-works that involve nearest amino acids. Hydrogen bonds are stronger between hydrophilic residues com-pared to hydrophobic– hydrophobic and hydrophobic– hydrophilic pairs. Taking into account hydrogen-bonding interactions between remote amino acids, such
as between amino acids in the nearest turns of␣-helices,
may drastically improve the observed correlation factor between hydrophobicity and ECD PIA and, simulta-neously, indicate possible peptide and protein site-specific (amino acid resolution) secondary structure organization (data not shown).
The preferential yield of product ions in ECD along a single (idealized) H-spine of an amphipathic peptide may establish a link to quantum physics– based
consid-eration of energy relaxation in ␣-helical peptides,
sub-stantially developed in the last decade [59]. Energy
relaxation dynamics that, according to the quantum physics models, involve a single H-spine, may account not only for charge-site-remote and preferential frag-mentation in ECD, but also indicate a qualitative role of hydrogen-bonding networks and a quantitative role of H-bond parameters (such as length, energy, or force constant) that are in turn determined by amino acid
sequence in a given peptide or protein[60]. To a first
approximation, amide-I relaxation dynamics is consid-ered as an intermediate in the ECD process. Initial excitation of the amide-I mode is suggested to be attributed to peptide/protein rapid conformational change upon charge neutralization following electron capture. Subsequent decay of amide-I excitation along
the hydrogen-bonded structure, as in an␣-helical
pep-tide, was calculated to induce a local contraction of the peptide lattice that propagates along the selected H-spine. Quantum physics models of amide-I relaxation in ␣-helical peptides confirm excitation propagation along a selected H-spine with only a minor excitation energy component diverted into other H-spines. Selection of the H-spine follows the position of the initially excited site, such as the charge neutralization site in ECD. The
finite size of a realistic ␣-helical peptide results in
reflection of a H-bond deformation wave from the N-and C-termini N-and leads to increased amplitude N-and lifetime of H-bond network contractions. Specific
prop-erties of hydrogen bonds (such as H-bond force con-stant or energy) along the hydrogen-bonding network may trigger H atom transfer to the carbonyl oxygen and lead to formation of a carbonyl radical. Subsequent cleavage of the nearby NOC␣ bond may proceed in agreement with the known ECD mechanisms. There-fore, the amide-I relaxation may explain the specific attachment of a hydrogen atom to a carbonyl oxygen remote from the charge neutralization site. This anism agrees with the enol-to-keto tautomerism mech-anism for preferential cleavage in ECD suggested by Breuker et al. [12]and provides an analytical descrip-tion of the process.
Conclusions
An unmistakable extended periodic variation of ECD PIA along the peptide sequence, with an average period between 3 and 4 amino acids for the transmembrane domain of M2 protein from influenza virus A (M2
TMP), with suggested solution-phase␣-helical
second-ary structure (3.6 amino acids per turn), is demon-strated. Analysis of the fragmentation patterns suggests periodic modulation of PIA as a result of the amphi-pathic nature of the M2 TMP peptide. The observation of periodic PIA behavior was further confirmed by ECD of model amphipathic peptides, antimicrobial peptides of amphipathic nature, and enzymatic
frag-ments of primarily ␣-helical protein, myoglobin. The
tenfold modulation of PIA amplitude for ECD of am-phipathic peptides reveals the specific nature of ECD in contrast to previously reported nonspecific and random behavior in regard to the cleavage between different amino acids. Based on the obtained experimental data the characteristic features for ECD of amphipathic pep-tides were indicated. Mapping of preferential cleavage
sites on the 2D idealistic ␣-helical nets suggests
en-hanced yield along the hydrogen-bonding network-mediated pathway that connects the charged sites and most hydrophilic residues in each turn, thus revealing
most efficient ECD at NOC␣ bonds located at the
N-terminal and C-terminal sides of a selected H-spine. The observed dependences support previous reports on the general influence of hydrogen bonds and distribu-tion of basic residues on ECD fragmentadistribu-tion patterns
[58]. Current ECD mechanisms can explain some of the
experimentally observed features, whereas new in-sights described here as a set of rules in ECD of amphipathic peptides may advance further ECD
mech-anism development[60].
Acknowledgments
The authors thank Eduard Chekmenev and Conggang Li from Dr. Timothy A. Cross’s group (NMR Program, NHMFL, Tallahassee, FL) and Myriam Cotten for providing samples. Vincent Pouthier, Ron Heeren, Konstantin Zhurov, and Eduard Chekmenev are gratefully acknowledged for encouraging discussions and com-ments on the manuscript. This work was supported by EPFL, NSF
Division of Materials Research through DMR-0654118 and the State of Florida. We are indebted to Bruker Daltonics and Thermo Fisher Scientific (both Bremen, Germany) for providing manufac-turing facilities-based FT-ICR mass spectrometers to confirm results obtained in our research laboratories.
Appendix
Supplementary Material
Supplementary material associated with this article
may be found in the online version at doi: 10.1016/j.
jasms.2009.02.015.
References
1. Zubarev, R. A.; Kelleher, N. L.; McLafferty, F. W. Electron Capture Dissociation of Multiply Charged Protein Cations. A Nonergodic Pro-cess. J. Am. Chem. Soc. 1998, 120, 3265–3266.
2. Zubarev, R. A. Reactions of Polypeptide Ions with Electrons in the Gas Phase. Mass Spectrom. Rev. 2003, 22, 57–77.
3. Zubarev, R. A. Electron Capture Dissociation and Other Ion-Electron Fragmentation Reactions. In Principles of Mass Spectrometry Applied to
Biomolecules, Lifshitz, C.; Laskin, J., Eds. John Wiley and Sons: Hoboken,
NJ, 2006; pp 475–518.
4. Syka, J. E. P.; Coon, J. J.; Schroeder, M. J.; Shabanowitz, J.; Hunt, D. F. Peptide and Protein Sequence Analysis by Electron Transfer Dissocia-tion Mass Spectrometry. Proc. Natl. Acad. Sci. U. S. A. 2004, 101, 9528 –9533.
5. Coon, J. J.; Ueberheide, B.; Syka, J. E. P.; Dryhurst, D. D.; Ausio, J.; Shabanowitz, J.; Hunt, D. F. Protein Identification Using Sequential Ion/Ion Reactions and Tandem Mass Spectrometry. Proc. Natl. Acad. Sci.
U. S. A. 2005, 102, 9463–9468.
6. Palmblad, M.; Tsybin, Y. O.; Ramstrom, M.; Bergquist, J.; Hakansson, P. Liquid Chromatography and Electron-Capture Dissociation in Fourier Transform Ion Cyclotron Resonance Mass Spectrometry. Rapid
Com-mun. Mass Spectrom. 2002, 16, 988 –992.
7. Savitski, M. M.; Nielsen, M. L.; Kjeldsen, F.; Zubarev, R. A. Proteomics-Grade De Novo Sequencing Approach. J. Proteome Res. 2005, 4, 2348 – 2354.
8. Adams, C. M.; Kjeldsen, F.; Zubarev, R. A.; Budnik, B. A.; Haselmann, K. F. Electron Capture Dissociation Distinguishes a Single D-Amino Acid in a Protein and Probes the Tertiary Structure. J. Am. Soc. Mass
Spectrom. 2004, 15, 1087–1098.
9. Savitski, M. M.; Nielsen, M. L.; Zubarev, R. A. ModifiComb, a New Proteomic Tool for Mapping Substoichiometric Post-Translational Mod-ifications, Finding Novel Types of ModMod-ifications, and Fingerprinting Complex Protein Mixtures. Mol. Cell. Proteomics 2006, 5, 935–948. 10. Meng, F. Y.; Forbes, A. J.; Miller, L. M.; Kelleher, N. L. Detection and
Localization of Protein Modifications by High Resolution Tandem Mass Spectrometry. Mass Spectrom. Rev. 2005, 24, 126 –134.
11. Kelleher, N. L. Top-Down Proteomics. Anal. Chem. 2004, 76, 196A–203A. 12. Breuker, K.; Oh, H. B.; Lin, C.; Carpenter, B. K.; McLafferty, F. W. Nonergodic and Conformational Control of the Electron Capture Dis-sociation of Protein Cations. Proc. Natl. Acad. Sci. U. S. A. 2004, 101, 14011–14016.
13. Polfer, N. C.; Haselmann, K. F.; Langridge-Smith, P. R. R.; Barran, P. E. Structural Investigation of Naturally Occurring Peptides by Electron Capture Dissociation and AMBER Force Field Modelling. Mol. Physics
2005,103, 1481–1489.
14. Coon, J. J.; Syka, J. E. P.; Shabanowitz, J.; Hunt, D. F. Tandem Mass Spectrometry for Peptide and Protein Sequence Analysis. Biotechniques
2005,38, 519 –523.
15. Mikesh, L. M.; Ueberheide, B.; Chi, A.; Coon, J. J.; Syka, J. E. P.; Shabanowitz, J.; Hunt, D. F. The Utility of ETD Mass Spectrometry in Proteomic Analysis. Biochim. Biophys. Acta Proteins Proteomics 2006, 1764, 1811–1822.
16. Budnik, B. A.; Nielsen, M. L.; Olsen, J. V.; Haselmann, K. F.; Horth, P.; Haehnel, W.; Zubarev, R. A. Can Relative Cleavage Frequencies in Peptides Provide Additional Sequence Information? Int. J. Mass
Spec-trom. 2002, 219, 283–294.
17. Tsybin, Y. O.; Haselmann, K. F.; Emmett, M. R.; Hendrickson, C. L.; Marshall, A. G. Charge Location Directs Electron Capture Dissociation of Peptide Dications. J. Am. Soc. Mass Spectrom. 2006, 17, 1704 –1711. 18. Iavarone, A. T.; Paech, K.; Williams, E. R. Effects of Charge State and
Cationizing Agent on the Electron Capture Dissociation of a Peptide.
Anal. Chem. 2004, 76, 2231–2238.
19. McAlister, G. C.; Berggren, W. T.; Griep-Raming, J.; Horning, S.; Makarov, A.; Phanstiel, D.; Stafford, G.; Swaney, D. L.; Syka, J. E. P.; Zabrouskov, V.; Coon, J. J. A Proteomics Grade Electron Transfer Dissociation-Enabled Hybrid Linear Ion Trap-Orbitrap Mass Spectrom-eter. J. Proteome Res. 2008, 7, 3127–3136.
20. Pesavento, J. J.; Mizzen, C. A.; Kelleher, N. L. Quantitative Analysis of Modified Proteins and Their Positional Isomers by Tandem Mass Spectrometry: Human Histone H4. Anal. Chem. 2006, 78, 4271– 4280. 21. Patriksson, A.; Adams, C.; Kjeldsen, F.; Raber, J.; van der Spoel, D.;
Zubarev, R. A. Prediction of NOCOAlpha Bond Cleavage Frequencies in Electron Capture Dissociation of Trp-Cage Dications by Force-Field Molecular Dynamics Simulations. Int. J. Mass Spectrom. 2006, 248, 124 –135.
22. Savitski, M. M.; Kjeldsen, F.; Nielsen, M. L.; Zubarev, R. A. Hydrogen Rearrangement to and from Radical z Fragments in Electron Capture Dissociation of Peptides. J. Am. Soc. Mass Spectrom. 2007, 18, 113–120. 23. Lin, C.; Cournoyer, J. C.; O’Connor, P. B. Use of a Double Resonance
Electron Capture Dissociation Experiment to Probe Fragment Interme-diate Lifetimes. J. Am. Soc. Mass Spectrom. 2006, 17, 1605–1615. 24. Mihalca, R.; Kleinnijenhuis, A. J.; McDonnell, L. A.; Heck, A. J. R.;
Heeren, R. M. A. Electron Capture Dissociation at Low Temperatures Reveals Selective Dissociations. J. Am. Soc. Mass Spectrom. 2004, 15, 1869 –1873.
25. Chakraborty, T.; Holm, A. I. S.; Hvelplund, P.; Nielsen, S. B.; Poully, J. C.; Worm, E. S.; Williams, E. R. On the Survival of Peptide Cations after Electron Capture: Role of Internal Hydrogen Bonding and Micro-solvation. J. Am. Soc. Mass Spectrom. 2006, 17, 1675–1680.
26. Breuker, K.; Oh, H. B.; Horn, D. M.; Cerda, B. A.; McLafferty, F. W. Detailed Unfolding and Folding of Gaseous Ubiquitin Ions Character-ized by Electron Capture Dissociation. J. Am. Chem. Soc. 2002, 124, 6407– 6420.
27. Jarrold, M. F. Helices and Sheets In Vacuo. Phys. Chem. Chem. Phys. 2007,
9, 1659 –1671.
28. Zilch, L. W.; Kaleta, D. T.; Kohtani, M.; Krishnan, R.; Jarrold, M. F. Folding and Unfolding of Helix-Turn-Helix Motifs in the Gas Phase.
J. Am. Soc. Mass Spectrom. 2007, 18, 1239 –1248.
29. Counterman, A. E.; Clemmer, D. E. Gas Phase Polyalanine: Assessment of i¡ i ⫹ 3 and i ¡ i ⫹ 4 Helical Turns in [Ala(n) ⫹ 4H](4⫹) (n ⫽ 29 – 49) Ion. J. Phys. Chem. B 2002, 106, 12045–12051.
30. Oomens, J.; Polfer, N.; Moore, D. T.; van der Meer, L.; Marshall, A. G.; Eyler, J. R.; Meijer, G.; von Helden, G. Charge-State Resolved Mid-Infrared Spectroscopy of a Gas-Phase Protein. Phys. Chem. Chem. Phys.
2005,7, 1345–1348.
31. Stearns, J. A.; Boyarkin, O. V.; Rizzo, T. R. Spectroscopic Signatures of Gas-Phase Helices: Ac-Phe-(Ala)(5)-Lys-H⫹ and Ac-Phe-(Ala)(10)-Lys-H⫹. J. Am. Chem. Soc. 2007, 129, 13820–13821.
32. Zhang, Z. Q.; Bordas-Nagy, J. Peptide Conformation in Gas Phase Probed by Collision-Induced Dissociation and Its Correlation to Con-formation in Condensed Phases. J. Am. Soc. Mass Spectrom. 2006, 17, 786 –794.
33. Savitski, M. M.; Kjeldsen, F.; Nielsen, M. L.; Garbuzynskiy, S. O.; Galzitskaya, O. V.; Surin, A. K.; Zubarev, R. A. Backbone Carbonyl Group Basicities Are Related to Gas-Phase Fragmentation of Peptides and Protein Folding. Angew. Chem. Int. Ed. 2007, 46, 1481–1484. 34. Chou, P. Y.; Fasman, G. D. Empirical Predictions of Protein
Conforma-tion. Annu. Rev. Biochem. 1978, 47, 251–276.
35. Cornette, J. L.; Cease, K. B.; Margalit, H.; Spouge, J. L.; Berzofsky, J. A.; Delisi, C. Hydrophobicity Scales and Computational Techniques for Detecting Amphipathic Structures in Proteins. J. Mol. Biol. 1987, 195, 659 – 685.
36. Ben Hamidane, H.; Chiappe, D.; Hartmer, R.; Vorobyev, A.; Moniatte, M.; Tsybin, Y. O. Electron Capture and Transfer Dissociation: Peptide Structure Analysis at Different Ion Internal Energy Levels. J. Am. Soc.
Mass Spectrom. 2008, doi:10.1016/j.jasms.2008.11.016.
37. Gross, M. L.; Caprioli, R. M. The Encyclopedia of Mass Spectrometry.
Biological Applications. Elsevier: Amsterdam, 2005; Vol. 2, p 435.
38. Senko, M. W.; Hendrickson, C. L.; Pasa-Tolic, L.; Marto, J. A.; White, F. M.; Guan, S.; Marshall, A. G. Electrospray Ionization FT-ICR Mass Spectrometry at 9.4 Tesla. Rapid Commun. Mass Spectrom. 1996, 10, 1824 –1828.
39. Hakansson, K.; Chalmers, M. J.; Quinn, J. P.; McFarland, M. A.; Hendrickson, C. L.; Marshall, A. G. Combined Electron Capture and Infrared Multiphoton Dissociation for Multistage MS/MS in a Fourier Transform Ion Cyclotron Resonance Mass Spectrometer. Anal. Chem.
2003,75, 3256 –3262.
40. Tsybin, Y. O.; Quinn, J. P.; Tsybin, O. Y.; Hendrickson, C. L.; Marshall, A. G. Electron Capture Dissociation Implementation Progress in Fourier Transform Ion Cyclotron Resonance Mass Spectrometry. J. Am. Soc.
Mass Spectrom. 2008, 19, 762–771.
41. Tsybin, Y. O.; Hendrickson, C. L.; Beu, S. C.; Marshall, A. G. Impact of Ion Magnetron Motion on Electron Capture Dissociation Fourier Trans-form Ion Cyclotron Resonance Mass Spectrometry. Int. J. Mass Spectrom.
2006,255, 144 –149.
42. McFarland, M. A.; Chalmers, M. J.; Quinn, J. P.; Hendrickson, C. L.; Marshall, A. G. Evaluation and Optimization of Electron Capture Dissociation Efficiency in Fourier Transform Ion Cyclotron Resonance Mass Spectrometry. J. Am. Soc. Mass Spectrom. 2005, 16, 1060 –1066. 43. Ledford, E. B., Jr.; Rempel, D. L.; Gross, M. L. Space Charge Effects in
Fourier Transform Mass Spectrometry Mass Calibration. Anal. Chem.
1984,56, 2744 –2748.
44. Shi, S. D. H.; Drader, J. J.; Freitas, M. A.; Hendrickson, C. L.; Marshall, A. G. Comparison and Interconversion of the Two Most Common Frequency-to-Mass Calibration Functions for Fourier Transform Ion Cyclotron Resonance Mass Spectrometry. Int. J. Mass Spectrom. 2000,
196, 591–598.
45. Blakney, G. T., Robinson, D. E., Ngan, V. L., Kelleher, N. L., Hendrick-son, C. L., Marshall, A. G. In Proceedings of the 53rd ASMS Conference on
Mass Spectrometry and Allied Topics, San Antonio, TX, June 5–9, 2005.
46. Cooper, H. J.; Akbarzadeh, S.; Heath, J. K.; Zeller, M. Data-Dependent Electron Capture Dissociation FT-ICR Mass Spectrometry for Proteomic Analyses. J. Proteome Res. 2005, 4, 1538 –1544.
47. Parks, B. A.; Jiang, L.; Thomas, P. M.; Wenger, C. D.; Roth, M. J.; Boyne, M. T.; Burke, P. V.; Kwast, K. E.; Kelleher, N. L. Top-Down Proteomics on a Chromatographic Timescale Using Linear Ion Trap Fourier Trans-form Hybrid Mass Spectrometers. Anal. Chem. 2007, 79, 7984 –7991. 48. Hessa, T.; Kim, H.; Bihlmaier, K.; Lundin, C.; Boekel, J.; Andersson, H.;
Nilsson, I.; White, S. H.; von Heijne, G. Recognition of Transmembrane Helices by the Endoplasmic Reticulum Translocon. Nature 2005, 433, 377–381.
49. Kyte, J.; Doolittle, R. F. A Simple Method for Displaying the Hydro-pathic Character of a Protein. J. Mol. Biol. 1982, 157, 105–132. 50. Zhao, G.; London, E. An Amino Acid “Transmembrane Tendency”
Scale That Approaches the Theoretical Limit to Accuracy for Prediction of Transmembrane Helices: Relationship to Biological Hydrophobicity.
Protein Sci. 2006, 15, 1987–2001.
51. Kovacs, F. A.; Denny, J. K.; Song, Z.; Quine, J. R.; Cross, T. A. Helix Tilt of the M2 Transmembrane Peptide from Influenza A Virus: An Intrinsic Property. J. Mol. Biol. 2000, 295, 117–125.
52. Berman, H. M.; Westbrook, J.; Feng, Z.; Gilliland, G.; Bhat, T. N.; Weissig, H.; Shindyalov, I. N.; Bourne, P. E. The Protein Data Bank.
Nucleic Acids Res. 2000, 28, 235–242.
53. Schaub, T. M.; Hendrickson, C. L.; Horning, S.; Quinn, J. P.; Senko, M. W.; Marshall, A. G. High-Performance Mass Spectrometry: Fourier Transform Ion Cyclotron Rresonance at 14.5 Tesla. Anal. Chem. 2008, 80, 3985–3990.
54. Syka, J. E. P.; Marto, J. A.; Bai, D. L.; Horning, S.; Senko, M. W.; Schwartz, J. C.; Ueberheide, B.; Garcia, B.; Busby, S.; Muratore, T.; Shabanowitz, J.; Hunt, D. F. Novel Linear Quadrupole Ion Trap/FT Mass Spectrometer: Performance Characterization and Use in the Com-parative Analysis of Histone H3 Post-Translational Modifications. J.
Proteome Res. 2004, 3, 621– 626.
55. Tsybin, Y. O.; Witt, M.; Baykut, G.; Kjeldsen, F.; Hakansson, P. Com-bined Infrared Multiphoton Dissociation and Electron Capture Disso-ciation with a Hollow Electron Beam in Fourier Transform Ion Cyclo-tron Resonance Mass Spectrometry. Rapid Commun. Mass Spectrom.
2003,17, 1759 –1768.
56. Syrstad, E. A.; Turecˇek, F. Toward a General Mechanism of Electron Capture Dissociation. J. Am. Soc. Mass Spectrom. 2005, 16, 208 –224. 57. Sobczyk, M.; Anusiewicz, W.; Berdys-Kochanska, J.; Sawicka, A.;
Skur-ski, P.; Simons, J. Coulomb-Assisted Dissociative Electron Attachment: Application to a Model Peptide. J. Phys. Chem. A 2005, 109, 250 –258. 58. Prell, J. S.; O’Brien, J. T.; Holm, A. I. S.; Leib, R. D.; Donald, W. A.;
Williams, E. R. Electron Capture by a Hydrated Gaseous Peptide: Effects of Water on Fragmentation and Molecular Survival. J. Am. Chem.
Soc. 2008, 130, 12680 –12689.
59. Falvo, C.; Pouthier, V. Vibron-Polaron in Alpha-Helices. I. Single-Vibron States. J. Chem. Phys. 2005, 123, 184709.
60. Pouthier, V.; Tsybin, Y. O. Amide-I Relaxation-Induced Hydrogen Bond Distortion: An Intermediate in Electron Capture Dissociation Mass Spectrometry of Alpha-Helical Peptides? J. Chem. Phys. 2008,