All rights reserved. For permissions, please email: journals.permissions@oxfordjournals.org.
doi:10.1093/ejo/cjm045
Introduction
Progressive muscular dystrophy, or Duchenne muscular dystrophy (DMD), is a recessive neuromuscular disease affecting the short arm of the X chromosome in the p21-2 position ( Jennekens et al. , 1991; Onimus et al. , 1999 ) and has a prevalence of one male newborn in 3500.
This gene codes for dystrophin, a protein which is present in the sarcolema of the muscular cell, are absent or hardly detectable in DMD.
The disease is detected clinically at an average age of 3.5 years, but in the majority of the subjects, the parents recognize an earlier delay in motor function ( Fowler, 1982 ). From the age of 7 – 8 years, the progression of the disease is dramatic. The patient becomes wheelchair-bound at approximately 10 – 12 years of age with a subsequent loss of muscle strength in the upper limbs and the development of scoliosis ( Onimus et al. , 1999 ).
In the 1980s, life expectancy was low since most patients died of respiratory failure before 20 years of age. Nowadays, many patients reach 25 or even 30 years of age due to improved medical support ( Fardeau, 2005 ).
During post-natal growth, bones continue their modelling process to maintain a form that is appropriate to their biomechanical function. Muscle function exerts an infl uence on skeletal growth and also on the facial skeleton ( Kiliaridis, 1995 ).
In humans, vertical dentofacial aberrations have been observed in patients with reduced muscle function, as can be
Dentofacial characteristics of growing patients with Duchenne
muscular dystrophy: a morphological study
Catherine Morel - Verdebout , Sébastien Botteron and Stavros Kiliaridis
Department of Orthodontics, University of Geneva, Switzerland
SUMMARY Occlusal traits and craniofacial morphology were studied in growing patients with Duchenne muscular dystrophy (DMD). Sixteen patients from 6 to 20 years of age were examined and compared with 16 healthy male individuals matched according to age. The dental arches and occlusal traits of both groups were analysed on dental casts and compared with the norms of healthy individuals from the literature. Lateral cephalograms of the patients were compared with normal individuals by using scored values based on standard deviations in order to compensate for heterogeneity in the age of the subjects. Statistical
analysis was undertaken for continuous variables with a paired Student’s t -test and non-continuous
variables with a chi-square test. Linear regressions were used to evaluate the infl uence of age.
A high prevalence of malocclusions was found, including posterior crossbites, anterior and lateral open bites, a tendency towards mesio-occlusion due to a skeletal Class III malocclusion, and dental compensations of the Class III relationship by retrusion of the lower incisors. Both upper and lower arches were widened posteriorly. The lower arches were even wider than the upper arches, resulting in frequent posterior crossbites. No signifi cant skeletal vertical deviations were observed in this group of DMD patients, except for the maxillary plane angle (NL/NSL) that was larger than normal, while the anterior upper face height (NSp) was smaller. However, no difference was found in lower face height.
The posterior enlargement of the dental arches and the dentoalveolar development towards an Angle Class III relationship were signifi cantly related to age and found more frequently among the older subjects.
found in myotonic dystrophy ( Kiliaridis et al. , 1989 ). Similarly, a high prevalence of malocclusions has been noted in DMD patients, such as anterior open bites and posterior crossbites, which appear to be strongly related to the involvement of the orofacial muscles in the disease ( Morimoto et al. , 1981; Stenvik and Storhaug, 1986; Kulkarni and Chandran, 1995; Eckardt and Harzer, 1996; Hara et al. , 2002; Matsumoto et al. , 2002 ).
In DMD patients, the effects of the disease progress with the age of the individuals and this may also progressively infl uence orofacial function ( Onimus et al. , 1999 ). Thus, the hypothesis tested in this study is that in children and adoles-cents suffering from DMD, dentofacial aberrations may show a higher frequency and severity in older children. The aim of the investigation was to examine DMD patients of different ages, record their dentofacial characteristics and determine any relationship between age and dentofacial characteristics. Linking these factors would indirectly relate dentofacial char-acteristics to severity of the disease. This investigation will provide the base for a longitudinal prospective study, to record the individual changes in this group.
Subjects and methods
From a group of 24 DMD patients registered at the university hospitals of Geneva and Lausanne, the patients were selected based on two criteria: (1) they had to be between 6 and 20 years of age and (2) they had to give their informed consent according to the requirements of ethical committees
of both universities. Sixteen patients with a mean age of 11.7 years [standard deviation (SD) 3.7, range 6 – 20] fulfi lled the inclusion criteria and agreed to participate in the study. Of these 16 patients, nine used a wheelchair and stopped walking at an average age of 8.3 years. The other seven subjects who were still able to walk were among the youngest of the group and all were being treated with prednisolone ( Kinali et al. , 2002 ).
A control group of 16 healthy male children, selected consecutively and matched for age to the DMD patients were set up within the consultation of the annual school dental examination in Geneva. These controls presented no immediate need for orthodontic treatment.
These control children also gave their informed consent and had the same examinations as DMD patients, except for the radiographs, so as to meet the requirements of the ethical committees. The mean age of the control group was 11.9 years (SD 4.0, range 6 – 20).
To counterbalance the disadvantages of the limited size of the control group, comparisons were undertaken with the norms of cast measurements found in the literature ( Moyers et al. , 1976 ).
Impressions and occlusal wax bites were taken in order to construct dental casts for analysis of the occlusal traits. Sagitally, overjet and Angle classifi cation, which were evaluated on the fi rst permanent molars when applicable and converted to a continuous value from − 100 per cent (full Class III) to +100 per cent (full Class II), by steps of 25 per cent were measured. Vertically, the overbite and the height of the palatal vault in the fi rst permanent molar region were evaluated.
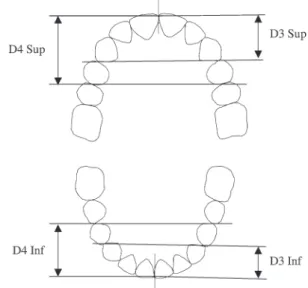
Evaluation of space conditions was performed using the values of Droschl et al. (1977 ), whenever patients were still in the mixed dentition. The depth and width of the dental arches were measured using calibrated photocopies of the casts ( Figures 1 and 2 ). To determine the geometric centre of the crown, the centroids were used ( McLean and Nelson, 1988 ). Width measurements were performed between the fi rst molars, fi rst primary molars or fi rst premolars, and canines, both in the upper and in the lower arches.
Depth was determined by fi rst drawing a line between the distal contact points of both canines and both fi rst premolars in the same arch. Then, the length of the segment perpendicular to these lines and passing through the contact point of the central incisors was measured and recorded. Palatal height was determined by placing an elastic band joining the mesio-palatal cusps of the fi rst permanent molars (when present) and measuring the distance to the midpalate perpendicular to the occlusal plane.
In order to limit the measurement errors, two operators (CMV and SB) performed all measurements separately on the casts on two occasions with an interval of at least 2 weeks. The average between these two measurements was used unless the values differed signifi cantly in which case both examiners repeated the measurement until a consensus
was found. A digital calliper (accurate to 0.01 mm) was used for all linear measurements.
Lateral cephalograms were taken of the DMD patients to study craniofacial morphology using a cephalometric method based on the Bergen analysis ( Figure 3 ; Hasund, 1977 ). The cephalometric results were compared with a sample of healthy individuals of different ages ( Riolo et al. , 1974 ).
Figure 1 Transverse measurements based on the centroid method, made on dental cast photocopies. W( x ) denotes the width between centroids of teeth ( x ), where x is, respectively, the fi rst molar (6), fi rst premolar (4), or canine (3). The fi rst premolar and canine can be either the permanent or the primary teeth.
Figure 2 Depth measurements based on the distance between the contact points of two pairs of teeth, and the contact point between the corresponding pair of incisors in the same arch. D denotes the depth measurement, 3 and 4 the canine and fi rst premolar, respectively, and, Inf and Sup the inferior and superior arches.
The measurements obtained from the dental casts and cephalometric analysis of the DMD patients were also compared with the dental casts of controls from a sample of healthy individuals recorded at different ages when applicable. Data from Riolo and Moyers were collected in the University of Michigan on a yearly basis starting in 1953 on children between their sixth and 16th birthday. Their ethnic background was not stated. The values used in the present study are the ones for male subjects ( Riolo et al. , 1974; Moyers et al. , 1976 ). Due to the range of ages, the absolute measurements of each individual were transformed to a score of SDs, based on normal values of a group of healthy individuals of the same age ( Moyers et al. , 1976 ). This was carried out for the linear and angular measurements of the cephalometric analysis, and linear measurements of the casts. All the scored values ( Y ) were evaluated computing the score as a number of SDs, using the formula:
Y=YPat− N N
X
SD ,
where Y Pat is the measurement of the patient, and X N and SD N the mean value and the SD of the ‘ norms ’ corresponding to the age of the patient.
Statistical analysis
For each measurement of a continuous variable, due to the small size of the samples, a paired Student’s t -test was
performed to evaluate the differences between the DMD patients and their healthy matched controls, when applicable ( Campbell and Machin, 1999 ).
For non-continuous variables and small samples, the chi-square test was used to evaluate the signifi cance of differences in frequency between the groups ( Campbell and Machin, 1999 ).
Linear regressions were used to evaluate the infl uence of age where DMD patient characteristics diverged from the control group or the data of Riolo et al. (1974) . In these regressions, α denotes the slope and β is the ordinate at the origin of the age axis (as in Y = α X + β ).
The signifi cance of these regressions was evaluated by computing the P value on the slope α , as well as regression coeffi cients ( R 2 ), for DMD patients and control group.
X 0 denotes the age at which both regressions intersect, and is computed by:
X0 = − − β β α α N DMD N DMD .
When the intersection X 0 between the two regression lines was in the range of 5 – 20 years of age, it was considered as signifi cant; otherwise, since both regressions were almost parallel, it was noted as non-signifi cant.
Paired t -tests were systematically performed to evaluate the signifi cance of the results.
Error of the methods
The error of the measurements in the dental analysis of the stone casts and the cephalometric analysis was computed after duplicate determinations, based on recordings of 10 randomly chosen subjects, using the following formula:
SE =
∑
d2 2 ,Nwhere d is the difference between the fi rst and second recordings and N is the number of double determinations. The error was computed for each operator in the DMD and control groups for the cast measurements and the radiographs of the DMD patients. The error of measurements did not exceed 0.6 mm for linear measurements or 1.0 degrees for the angular measurements of the cephalometric analysis, and 0.3 mm for the linear measurements of the casts.
Results
The analysis of the dental casts revealed a higher frequency of malocclusions in the DMD patients than in the control group.
A signifi cantly higher number of Class III malocclusions were observed (31 per cent, P = 0.015) in the DMD subjects, with a tendency to a smaller overjet ( P = 0.069). This antero-posterior dental relationship, expressed as a continuous
Figure 3 Cephalometric reference points and planes used in the Bergen analysis: ( Hasund, 1977 ) nasion (N), sella (S), basion (Ba), gnathion (Gn), points A and B, anterior nasal spine (Sp), incision superius (Is), incision inferius (ii), nasion sella line (NSL), nasal line (NL), mandibular line (ML), maxillo-facial measurements SNA, SNB, ANB, ML/NSL, NL/NSL, ML/NL, NSBa and gonial angles Gn-tgo-Ar. Dentoalveolar angles: interincisal I/I, Is/NA, ii/NB. Maxillo-facial height is evaluated in two separate segments, NSp and SpGn.
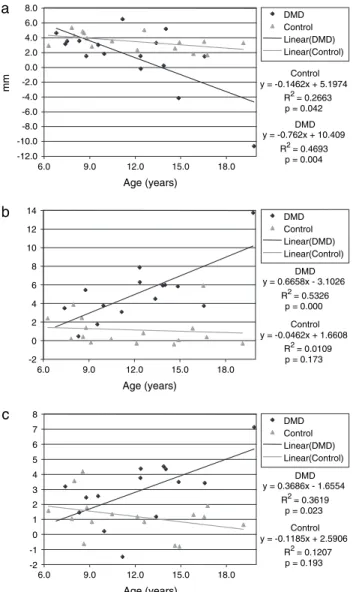
value, showed a tendency towards Class III in the older individuals [slope α = − 9.45 degrees (per cent per year), R 2 = 0.32, P = 0.022], meaning that older patients were more prone to a Class III malocclusion than the younger patients ( Figure 4 ). The overjet of DMD patients was negatively related to age and declined from 5 mm among the younger patients to − 4 mm in the older adolescents [slope α = − 0.76 (mm/year), R 2 = 0.47, P = 0.004], intersecting the regression line of the DMD group at the age of 8.4 years. In the control group, the overjet was also slightly negatively correlated with age [slope α = − 0.15 (mm/year), R 2 = 0.27, P = 0.042]. Linear regression in the control group showed a less negative slope ( − 0.1462, P = 0.042) than in the DMD patients ( − 0.762, P = 0.004), intersecting their regression line at 7.9 years of age ( Figure 5a ).
The prevalence of patients with an increased anterior and lateral open bite (38 and 44 per cent, with P = 0.033 and 0.003, respectively) was signifi cantly higher than that in the healthy controls. The measured overbite was smaller among the DMD patients than the healthy individuals ( P = 0.019); this result is in line with a higher frequency of anterior open bite in this group ( P = 0.033; Tables 1 and 2 ).
The prevalence of a posterior crossbite (88 per cent, P = 0.001) was signifi cantly greater than that in the healthy controls. In the transverse dimension, the premolar and molar width of both arches and the intercanine width of the lower arch were wider in DMD patients than in their matched healthy controls ( P = 0.001 – 0.155, Table 3 ). This difference was more pronounced in the lower arch ( P = 0.001 – 0.036) than in the upper ( P = 0.016 – 0.155), being almost double in the molar and premolar region ( Table 3 ). In DMD patients, the intermolar width of the fi rst permanent inferior molar showed a signifi cant enlargement in older adolescents when compared with the younger patients ( α = 0.67, R 2 = 0.53, P = 0.001), which was not the case in the
-100 -80 -60 -40 -20 0 20 40 60 80 100 6.0 9.0 12.0 15.0 18.0 Age (years) % Control y = -2.2004x + 39.872 R2 = 0.074 p = 0.305 DMD y = -9.4536x + 97.187 R2 = 0.3233 p = 0.022 DMD Control Linear (DMD) Linear (Control)
Figure 4 Angle classifi cation of the fi rst molars in the Duchenne muscular dystrophy (DMD) patients and the control group, as expressed by a continuous value from − 100 (%) for a full Class III to +100 (%) for a full Class II. Linear regression lines depict the sagittal molar relationship associated with the age of the subject, based on the average between left and sides.
Table 1 Occurrence of malocclusions in Duchenne muscular dystrophy (DMD) patients and a matched control group expressed as a percentage and numbers and their signifi cance, based on a chi-square test. A chi-chi-square test was performed for Angle Class III separately and then a global chi-square test by pooling Angle Class I, II, and III prevalences together.
DMD ( n = 16) Controls ( n = 16) χ 2 P n % n %
Angle classifi cation
I 8 50 14 88 5.91 0.015 II 3 19 2 12 0.237 0.626 III 5 31 0 0 5.93 0.015 Global angle classifi cation 16 100 16 100 6.84 0.033
Anterior open bite 6 37.5 1 6 4.57 0.033
Lateral open bite 7 44 0 0 8.96 0.003
Posterior crossbite 14 88 3 19 15.20 0.001 Control y = -0.1462x + 5.1974 R2= 0.2663 p = 0.042 Control y = -0.0462x + 1.6608 R2= 0.0109 p = 0.173 Control y = -0.1185x + 2.5906 R2= 0.1207 p = 0.193 DMD y = -0.762x + 10.409 R2= 0.4693 p = 0.004 DMD y = 0.6658x - 3.1026 R2= 0.5326 p = 0.000 DMD y = 0.3686x - 1.6554 R2= 0.3619 p = 0.023 -12.0 -10.0 -8.0 -6.0 -4.0 -2.0 0.0 2.0 4.0 6.0 8.0 a b c 6.0 9.0 12.0 15.0 18.0 Age (years) 6.0 9.0 12.0 15.0 18.0 Age (years) 6.0 9.0 12.0 15.0 18.0 Age (years) mm DMD Control Linear(DMD) Linear(Control) DMD Control Linear(DMD) Linear(Control) DMD Control Linear(DMD) Linear(Control) -2 0 2 4 6 8 10 12 14 -2 -1 0 1 2 3 4 5 6 7 8
Figure 5 Overjet (a) and arch widths at the lower (b) and upper (c) fi rst molar in the Duchenne muscular dystrophy (DMD) patients and control group and their linear regression lines.
healthy controls ( α = − 0.046, R 2 = 0.01, P = 0.173). The two regression lines for the lower arch of the DMD and the healthy control group intersected at 6.7 years of age. The corresponding line for the upper arch was 9 years. This indicates that from those ages, the DMD patients had progressively larger dental arches ( Figure 5b,c ).
ANB angle was signifi cantly smaller ( P = 0.008) in DMD patients when compared with the sample of Riolo et al. (1974 ; Table 4 ). Furthermore, the inclinations of the lower incisors (ii/NB) and lower arch depth were smaller in DMD patients ( P = 0.037; Tables 3 and 4 ).
The upper part of the anterior face, NSp, was smaller ( P = 0.001), while the inclination of the maxilla in relation to the anterior cranial base (NL/NSL, P = 0.010) and the cranial base angle (NSBa, P = 0.048) was larger in the DMD
patients when compared with the norms. It should be noted that other values, including the vertical relationship between the mandible and the cranial base and the intermaxillary angle, did not show any statistically signifi cant difference from the norms.
Discussion
Although the size of the control group was small due to the diffi culty in gathering a larger cohort from the annual scholar dental examination, many of the results are in line with the literature and are signifi cant.
This study has shown that DMD patients present mainly dentoalveolar deviations, and these are more frequent and severe in post-pubertal individuals. No signifi cant skeletal vertical deviations were observed in these DMD patients. From a dentoalveolar point of view, the frequency of an anterior open bite, lateral open bite, and lateral crossbite was very high, which confi rms the observations of many previous studies ( Morinushi and Matsumoto, 1986; Stenvik and Storhaug, 1986; Ghafari et al. , 1988; Ertük and Dogan, 1991; Matsumoto et al. , 2002; Symons et al. , 2002 ). The fi ndings, which were based on comparison with a healthy matched control group, were comparable with those found in the literature.
For the antero-posterior dimension, the results are in agreement with those of Eckardt and Harzer (1996) who found a small overjet in patients with DMD, and other studies that found a dental Class III tendency ( Ertük and Dogan, 1991; Matsumoto et al. , 2002 ). In the present study, DMD patients also showed a tendency towards a skeletal Class III relationship with dental compensation, as expressed by a smaller angle of the lower incisor to the NB line (ii/ NB). Similar results confi rming a clear skeletal Class III
Table 3 Upper and lower arch width and depth in the Duchenne muscular dystrophy (DMD) patients and control group as per Figures 1 and 2 , measured according to Riolo et al. (1974) on photocopies of occlusal surface of the dental casts. The average
x – and standard deviation (SD) are provided. Signifi cance was
evaluated using paired t-tests.
Arch width (W) DMD Controls P
Result x – SD x – SD Upper arch W6 (mm) 52.8 6.3 47.7 3.4 0.029 W4 (mm) 38.7 4.1 35.6 2.3 0.016 W3 (mm) 32.5 4.1 30.5 2.5 0.155 D4 (mm) 19.5 3.0 20.4 2.9 0.295 D3 (mm) 12.1 2.0 13.4 2.7 0.133 Lower arch W6 (mm) 52.9 7.8 42.7 3.2 0.001 W4 (mm) 36.6 5.2 30.5 2.8 0.001 W3 (mm) 26.9 3.6 24.4 2.3 0.036 D4 (mm) 13.7 2.6 16.0 2.4 0.066 D3 (mm) 7.1 1.7 9.4 3.0 0.018
Table 4 Absolute and scored cephalometric variables and number of standard deviations (SD) in Duchenne muscular dystrophy (DMD) patients and the control group based on the values of Riolo et al. (1974 ). The x – and SD for DMD patients and controls are provided. Signifi cance was evaluated using paired t-tests.
DMD Scored values P x – SD x – SD SNA (°) 79.4 5.09 − 0.482 1.63 0.258 SNB (°) 77.9 6.35 0.254 2.24 0.525 ANB (°) 1.5 3.49 − 1.171 1.53 0.008 ML/NSL (°) 36.6 6.14 0.517 1.30 0.123 NL/NSL (°) 9.3 3.64 0.956 1.35 0.010 ML/NL (°) 27.2 5.65 − 0.063 1.25 0.827 NSBa (°) 132.8 6.62 0.694 1.36 0.048 Gn-tgo-Ar (°) 128.5 6.48 0.380 1.11 0.206 I/I (°) 133.0 9.85 0.470 0.99 0.063 Is-NA (°) 23.1 4.83 0.105 0.86 0.499 ii/NB (°) 20.3 9.47 − 0.820 1.45 0.037 Sp-Gn (mm) 66.1 9.41 − 1.059 1.47 0.148 N-Sp (mm) 48.8 4.37 − 1.500 1.07 0.001
Table 2 Interarch relationship, space conditions, and upper arch dimensions measured on dental casts. The molar relationship is expressed as a percentage, from – 100 (%) for a full Class III to +100 (%) for a full Class II. The average and standard deviation (SD) for Duchenne muscular distrophy (DMD) patients and controls are provided. Signifi cance was evaluated using paired t -tests.
n DMD Controls P
x – SD x – SD Molar relationship (%) 16 − 13.4 61.0 13.7 32.0 0.111
Overjet (mm) 16 1.5 4.1 3.5 1.1 0.069
Overbite (mm) 15 0.29 3.2 2.7 1.6 0.019 Space upper arch (mm) 14 − 0.93 6.2 0.61 2.6 0.416 Space lower arch (mm) 14 3.1 5.4 1.0 3.6 0.249 Palatal width (mm) 14 42.8 5.5 40.3 3.8 0.233 Palatal height (mm) 13 17.8 3.9 17.5 3.6 0.780
relationship were found in DMD patients in the permanent dentition, in contrast to DMD patients who were in the mixed dentition and showed only a tendency to a Class III skeletal relationship ( Matsumoto et al. , 2002 ).
In the vertical dimension, the high frequency of anterior and lateral open bites is charasteristic of DMD patients. In this study, anterior and lateral open bites were more frequent in the older than in the younger patients. Skeletally, no signifi cant vertical discrepancies were observed, except for a larger inclination of the maxilla in relation to the anterior cranial base and a small upper anterior face height (NSp); the latter fi nding is in agreement with the observations of Eckardt and Harzer (1996) . The large inclination of the maxilla may be attributed to specifi c palatal remodelling due to the increased tongue volume infl uencing mainly the posterior part of the maxilla. Contrary to the fi ndings of a recent longitudinal study where a posterior rotation of the mandible was found ( Matsuyuki et al. , 2006 ), no statistically signifi cant differences in the vertical skeletal dimension in relation to the norms of healthy individuals were observed. This may be explained by the fact that the power of a cross-sectional cephalometric evaluation has limitations in
detecting the fi ne changes that can be identifi ed by a longitudinal follow-up. It is intended to follow these patients longitudinally to observe the skeletal and dentoalveolar changes that may take place within this group.
In the transverse dimension, the posterior crossbite in the DMD group was mainly due to the increase in lower arch width. It was observed that the lower arch was wider in the older than in the younger patients ( Figure 6 ), and this may be related to buccal tipping of the lower molar and premolar. This is in agreement with the fi ndings of Matsumoto et al. (2002) and has possibly been caused by the increased volume of the tongue.
Recent studies on DMD patients, based on ultrasound measurements, have shown that muscular changes occur through an increase of muscle volume and a disruption of the muscular architecture with disappearing aponevrosis and septums ( Pillen et al. , 2003; Scholten et al. , 2003 ). This is due to muscle cell replacement with fat and connective tissue ( Heckmatt et al. , 1982; Reimers et al. , 1993 ), and explains the classical observations of increased lingual volume. Matsumoto et al. (2002) assumed that a posterior crossbite was more frequent than an anterior crossbite,
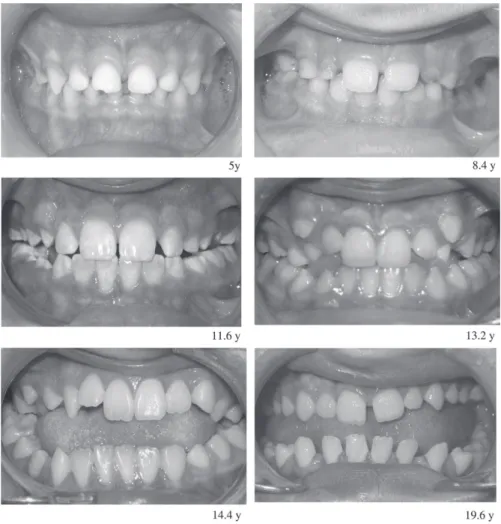
Figure 6 Anterior view of teeth in occlusion in various Duchenne muscular dystrophy (DMD) patients at the ages of 5.0, 8.4, 11.6, 13.2, 14.4, and 19.6 years.
because the enlargement of the tongue progresses over time from the root of the tongue to its apex; as a result, a posterior crossbite is more prominent in older subjects.
Although DMD and myotonic dystrophy both affect the muscles in and around the oral cavity, their effect is different since muscle imbalance produces different skeletal and dental growing processes. In myotonic dystrophy, a high prevalence of malocclusion has also been found, including anterior open bites and lateral crossbites, associated with a vertical skeletal aberration ( Kiliaridis et al. , 1989 ). Malocclusions in these patients seem to be related to a vertical aberration in craniofacial growth due to the involvement of masticatory muscles, with a possibly less affected suprahyoid musculature. The lowered mandible and tongue cannot counterbalance the forces developed by the stretched facial musculature and this situation may affect the teeth transversely, decreasing the width of the palate and causing a posterior crossbite; the lowering of the mandible may permit overeruption of the posterior teeth and development of an anterior open bite ( Kiliaridis and Katsaros, 1998 ).
By contrast, DMD patients show a high prevalence of anterior and lateral open bites without vertical skeletal aberration. DMD affects muscles at various stages of the evolution of the disease. A good example is the weakening of the masseters, which occurs at an earlier stage compared with the labial muscles ( Eckardt and Harzer, 1996 ). Due to the imbalance between lateral and anterior forces combined with the increased lingual volume, lateral dentoalveolar effects are more signifi cant than frontal effects and take the form of an increased transverse diameter; in turn, this causes buccal tipping of the teeth, as well as a lateral open bite and crossbite ( Stenvik and Storhaug, 1986; Willig et al. , 1994; Matsumoto et al. , 2002; Symons et al. , 2002 ).
An interesting observation in the present study was that many measurements start to diverge signifi cantly from normal values at 7 – 10 years of age, as shown by the computation of the intersection between linear regression lines of the patient group and the healthy controls. This singular point in the clinical evolution can be related to the fact that the physical capacity of these boys signifi cantly decreases with age; in this group, the patients stopped walking at a mean age of 8.3 years.
Therapeutic exercises on a submaximal level seem to be an interesting way to limit the loss of function ( De Lateur and Giaconi, 1979; Kawazoe et al. , 1982; Kilmer et al. , 1994; Grimby, 2004 ). In addition, progress has been made in new therapeutic protocols by means of gene therapy ( Goyenvalle et al. , 2004; Denti et al. , 2006 ), which in turn may lead to less frequent and severe malocclusions.
Conclusions
In patients with DMD, a high prevalence of posterior and anterior open bites with a decreased overjet, as well as
posterior crossbites due to enlargement of the posterior lower arches were observed. The dentoalveolar deviations were related to the age of the patients since they showed a higher prevalence in older adolescents than in younger children.
No obvious vertical skeletal deviations were found in this patient group.
Address for correspondence
Professor Stavros Kiliaridis Division d’Orthodontie Section de Médecine Dentaire Université de Genève
CH-1211 Genève 4 Switzerland
E-mail: stavros.kiliaridis@unige.ch
Funding
Swiss National Funds for Scientifi c Research (Fonds national de la recherche scientifi c project no. 3200-06196).
Acknowledgements
The authors wish to thank the staff at Association de la Suisse Romande et Italienne contre les Myopathies and La Cassagne, the Departments of Pediatrics and Radiology at Hôpital Cantonal Universitarie Geneva, the Departments of Pediatrics and Radiology at Centre Hospitalier Universitaire Vaudois Lausanne, the Service of Odonto-Stomatology at Policlinique Médicale Universitaire Lausanne, and the Orthopedic Hospital of Lausanne for their invaluable help and most appreciated collaboration.
References
Campbell M J , Machin D 1999 Medical statistics, a commonsense approach, 3rd edn. John Wiley & Sons Ltd , Chichester
De Lateur B J , Giaconi R M 1979 Effect on maximal strength of submaximal exercise in Duchenne muscular dystrophy . American Journal of Physical Medicine 58 : 26 – 36
Denti M A et al. 2006 Body-wide gene therapy of Duchenne muscular dystrophy in the mdx mouse model . Proceedings of the National Academy of Sciences of the USA 103 : 3758 – 3763
Droschl H , Gölles J , Sager K 1977 Uber die Anwendung der Wahrscheinlichkeitstafeln von Moyers . Informationen aus Orthodontie und Kieferorthopädie 9 : 241 – 259
Eckardt L , Harzer W 1996 Facial structure and functional fi ndings in patients with progressive muscular dystrophy (Duchenne) . American Journal of Orthodontics and Dentofacial Orthopedics 110 : 185 – 190
Ertük N , Dogan S 1991 The effect of neuromuscular diseases on the development of dental and occlusal characteristics . Quintessence International 22 : 317 – 321
Fardeau M 2005 L’homme de chair. Odile Jacob Sciences , Paris Fowler W M 1982 Rehabilitation management of muscular dystrophy and
related disorders: II. Comprehensive care . Archives of Physical and Medical Rehabilitation 63 : 322 – 327
Ghafari J , Clark R E , Shofer F S , Berman P H 1988 Dental and occlusal characteristics of children with neuromuscular disease . American Journal of Orthodontics and Dentofacial Orthopedics 93 : 126 – 132 Goyenvalle A et al . 2004 Rescue of dystrophic muscle through
U7snRNA-mediated exon skipping . Science 306 : 1796 – 1799
Grimby G 2004 Positiv effekt av fysisk träning vid neuromuskulär sjukdom. Träningsprogram måste avpassas efter bakomliggande patologi . Läkartidningen 101 : 2008 – 2012
Hara A , Uehara M , Nakata S , Nakashima A 2002 Relationship between functional balance of masticatory muscles and craniofacial morphology in patients with Duchenne muscular dystrophy . Orthodontic Waves 61 : 1 – 13
Hasund B 1977 Clinical cephalometry for the Bergen-technique, Dental Institute. University of Bergen , p. 120
Heckmatt J Z , Leeman S , Dubowitz V 1982 Ultrasound imaging in the diagnosis of muscle disease . Journal of Pediatrics 101 : 656 – 660 Jennekens F G , ten Kate L P , de Viser M , Wintzen A R 1991 Diagnostic
criteria for Duchenne and Becker muscular dystrophy and myotonic dystrophy . Neuromuscular Disorders 1 : 389 – 391
Kawazoe Y , Kobayashi M , Tasaka T , Tamamoto M 1982 Effects of therapeutic exercise on masticatory function in patients with progressive muscular dystrophy . Journal of Neurology, Neurosurgery and Psychiatry 45 : 343 – 347
Kiliaridis S 1995 Masticatory muscle infl uence on craniofacial growth . Acta Odontologica Scandinavica 53 : 196 – 202
Kiliaridis S , Katsaros C 1998 The effects of myotonic dystrophy and Duchenne muscular dystrophy on the orofacial muscles and dentofacial morphology . Acta Odontologica Scandinavica 56 : 369 – 374
Kiliaridis S , Mejersjö C , Thilander B 1989 Muscle function and craniofacial morphology: a clinical study in patients with myotonic dystrophy . European Journal of Orthodontics 11 : 131 – 138
Kilmer D D , McCrory M A , Wright N C , Aitkens S , Bernauer E M 1994 The effect of high resistance exercise in slowly progressive neuromuscular disease . Archives of Physical and Medical Rehabilitation 75 : 560 – 563
Kinali M , Mercuri E , Main M , Muntoni F , Dubowitz V 2002 An effective, low-dosage, intermittent schedule of prednisolone in the long-term treatment of early cases of Duchenne dystrophy . Neuromuscular Disorders 12 , (Supplement 1) : S169 – S174
Kulkarni M L , Chandran V R 1995 Typical facies in Duchenne muscular dystrophy . Indian Pediatrics 32 : 700 – 710
Matsumoto S , Morinushi T , Ogura T 2002 Time dependent changes of variables associated with malocclusion in patients with Duchenne muscular dystrophy . Journal of Clinical Pediatric Dentistry 27 : 53 – 61 Matsuyuki T , Kitahara T , Nakashima A 2006 Developmental changes in
craniofacial morphology in subjects with Duchenne muscular dystrophy . European Journal of Orthodontics 28 : 42 – 50
McLean W G , Nelson E W 1988 First moments and centroïds. McGraw-Hill , New York
Morimoto T , Takebe H , Kawamura Y 1981 Oral kinesthesia in patients with Duchenne muscular dystrophy . Journal of the Neurological Sciences 49 : 285 – 291
Morinushi T , Matsumoto S 1986 Oral fi ndings and proposal for a dental health care program for patients with Duchenne type muscular dystrophy . Special Care Dentistry 6 : 117 – 119
Moyers R E , van der Linden F , Riolo M L , McNamara J A 1976 Standards of human occlusal development. Monograph No. 5, Craniofacial Growth Series. Center for Human Growth and Development, The University of Michigan, Ann Arbor
Onimus M , De Billy B , Chataigner H 1999 Les maladies neuro-musculaires de l’enfant. Sauramps Médical , pp. 1 – 139 .
Pillen S , Scholten R R , Zwarts M J , Verrips A 2003 Quantitative skeletal muscle ultrasonography in children with suspected neuromuscular disease . Muscle & Nerve 27 : 699 – 705
Reimers K , Reimers C D , Wagner S , Paetzke I , Pongratz D E 1993 Skeletal muscle sonography: a correlative study of echogenicity and morphology . Journal of Ultrasound in Medicine 2 : 73 – 77
Riolo M L , Moyers R E , McNamara A , Hunter W S 1974 An atlas of craniofacial growth Monograph No. 2, Craniofacial Growth Series. Center for Human Growth, The University of Michigan, Ann Arbor Scholten R R , Pillen S , Verrips A , Zwarts M J 2003 Quantitative
ultrasonography of skeletal muscles in children: normal values . Muscle and Nerve 27 : 693 – 698
Stenvik A , Storhaug K 1986 Malocclusion patterns in fourteen children with Duchenne’s muscular dystrophy . ASDC Journal of Dentistry for Children 53 : 215 – 218
Symons A L , Townsend G C , Hughes T E 2002 Dental characteristics of patients with Duchenne muscular dystrophy . ASDC Journal of Dentistry for Children 69 : 277 – 283
Willig T N , Paulus J , Lacau Saint Guily J , Béon C , Navarro J 1994 Swallowing problems in neuromuscular disorders . Archives of Physical Medicine and Rehabilitation 75 : 1175 – 1181