ORIGINAL PAPER
Total serum IgE quantification by microfluidic ELISA
using magnetic beads
Gaëlle Proczek&Anne-Laure Gassner&
Jean-Marc Busnel&Hubert H. Girault
Received: 28 July 2011 / Revised: 30 September 2011 / Accepted: 11 October 2011 / Published online: 22 October 2011 # Springer-Verlag 2011
Abstract The present work reports on the quantification of total IgE in human serum using a microanalytical device whose fluidics is driven by gravity and capillary forces only. Thanks to the eight parallel microchannels in each microchip, calibration and sample analysis are performed simultaneously. A mixture of magnetic bead/analyte/second antibody is incubated off-line and then percolated through the channels where magnetic beads are trapped, enabling the separation of the solid phase from the excess reagents. The entire assay is performed in less than 1 h, and thanks to the miniaturized format, only a small volume of serum is required. Non-specific adsorption was first investigated and a blocking agent compatible with this allergy-based test was chosen. Then, the assay was optimized by determining the best magnetic bead and labelled antibody concentra-tions. After achievement of a calibration curve with a reference material, the protocol was applied to total IgE quantification of a patient serum sample that showed results in good accordance with those obtained by ImmunoCap® and Immunoaffinity capillary electrophoresis measure-ments. A detection limit of 17.5 ng ml−1 was achieved and good reproducibility (RSD<10%) inter- and intra-chip was observed.
Keywords Immunoassay . Allergy . Microfluidics . Magnetic particles
Introduction
A major health issue today concerns allergic diseases that are estimated to affect 20% of the population [1]. Diseases such as allergic rhinitis, asthma and atopic eczema are increasing in prevalence and it has been suggested that this trend may be due to the sanitized Western lifestyle depriving the immune system of molecules helping its development and the extensive use of antibiotics [2]. Allergy is an abnormal immunoglobulin E (IgE) mediated immune reaction to normally harmless environmental substances and is also called immediate or type I hypersensitivity [1]. Briefly, the sequence of events in the development of immediate hypersensitivity reactions con-sists of a first exposure to the allergen resulting in the activation of TH2 cells. By secreting cytokines, the latter
stimulate B cells specific for the foreign antigen to transform into IgE-producing cells. The IgE antibodies produced bind to specific receptors of mast cells, sensitizing them. The next encounter with the foreign antigen leads to its recognition by the activated mast cells and to secretion of proinflammatory mediators, such as histamine, causing immediate symptoms [1,3].
The diagnosis of allergy can be confirmed by either in vivo or in vitro methods. Skin tests where a commercial allergen extract droplet is placed on the skin before abrading the skin with a needle are a particularly useful in vivo tool, but can be contraindicated, as in some cases, anaphylactic reactions may occur [4]. In vitro methods imply mainly the use of ELISA-related techniques, even if flow cytometric quantification of in vitro basophile activa-tion can be reliable [4]. An allergy immunoassay involves the quantification of IgE in serum, either total IgE testing to confirm that the allergy is atopic or specific IgE to identify the allergen(s) responsible for the disease [5]. Total IgE
Published in the ANAKON special issue with guest editors P. Dittrich, D. Günther, G. Hopfgartner, and R. Zenobi.
G. Proczek
:
A.-L. Gassner:
J.-M. Busnel:
H. H. Girault (*) Laboratoire d’Electrochimie Physique et Analytique, Ecole Polytechnique Fédérale de Lausanne,EPFL SB ISIC LEPA, Station 6, 1015 Lausanne, Switzerland e-mail: [email protected] DOI 10.1007/s00216-011-5495-0
serum levels vary during the lifetime, being <1 kIU/l at birth [5] (1 IU=2.4 ng), reaching its highest levels at age 15–20 and remaining constant until about an age of 60, when it slowly declines [6]. Three immunoassay systems capable of quantifying total and specific IgE are commer-cially available: the HYTEC™ 288 from Hycor, the ImmunoCAP® from Phadia and the Immulite® from Siemens. These three systems provide similar analytical sensitivities (0.1 kIU l−1) and make use of a sandwich immunoassay with detection through enzyme-labelled anti-IgE [7]. However, even if these commercial systems offer suitable sensitivities, low detection limits, high throughput and automation, they are relatively expensive and time and sample/reagent consuming. Indeed, an ImmunoCap assay is performed within 3 h [8] and requires about 40μl of serum for total IgE quantitation. As a consequence, research now focuses on the reduction of both assay time and sample/ reagent consumption.
Ten years ago, an immunosensor using disposable screen-printed carbon electrodes and amperometric detec-tion was developed to carry out IgE quantitadetec-tion in 30 min with a detection limit of 0.09 ng ml−1[9]. The same type of electrodes was used later by the same group to carry out a competitive assay where the detection was carried out by differential pulse voltammetry [6]. Instead of using an anti-IgE antibody to recognize the target anti-IgE, an aptamer was chosen with the advantage of being insensitive to temper-ature and low cost. These interesting fetemper-atures explain the number of publications concerning IgE quantification with aptamers [10–13]. Other studies were also carried out, making use of surface plasmon resonance spectroscopy [14,
15] and quartz crystal microbalance detection [15]. In the microchip field, a micro-ELISA was performed on polysty-rene beads achieving a detection limit of 2 ng ml−1 with thermal lens microscope detection [16]. Another strategy used the competition between IgE to be quantified and IgE-sensitized immunoliposomes entrapping a fluorescent dye for anti-IgE immobilized on a nitrocellulose membrane [17]. In addition, a number of publications concern IgE quantification with magnetic beads with the advantage of increasing the specific surface for reaction, being easily trapped by permanent magnets and having a large choice of functionalizations commercially available [18]. Among these studies, an optical detection method based on the deflection of magnetic particles caused by a magnetic field gradient was used to analyse allergen-specific IgE for Dermatophagoides farinae and Dermatophagoides ptero-nyssinus in patient serum, with detection limits of 565 and 268 fM respectively [19]. An immunoassay, with an anti-IgE antibody grafted on magnetic beads and anti-IgE-specific aptamers attached to polystyrene beads as label for chemiluminescent detection was developed to detect IgE down to 4.6 pM [20]. Finally, a capillary electrophoresis
system using fluorescence detection was developed in our lab with a sensitivity in the low picomolar range and a highly linear dynamic range from 2.4 to 2,400 ng ml−1[21]. In this work, a sandwich-type immunoassay using magnetic beads was developed for total IgE quantification in serum using a commercial device, the GRAVI™-Cell from DiagnoSwiss, having the particular feature of working with gravity and capillary force-driven fluidics only. Gravity-induced flows are not commonly used to perform immunoassays, but the concept was demonstrated in previous studies, first by coating the whole microchannel with antibodies [22], before using magnetic beads as a solid support [23]. More recently, this system was used to detect specific DNA sequences of Legionella pneumophila, with a RSD of 8.5% and a detection limit of 0.33 nM [24]. In this work, non-specific adsorption was first studied and after testing different blocking solutions, the most adequate one was chosen to limit non-specific adsorption. Then, the assay was optimized by determining the best magnetic bead and labelled antibody concentrations. After achievement of a calibration curve with a reference material, the protocol was applied to total IgE quantification of a patient serum sample whose concentration was previously determined by an ImmunoAffinity Capillary Method developed in our lab [21] and by classical ImmunoCap® method.
Material and methods Chemicals
Mouse anti-human IgE recognizing an epitope expressed on the Cε3 domain (0100–0414) and an epitope expressed on the Cε2 domain (0100–0413) respectively was purchased from AbD Serotec (Oxford, UK). Reference human IgE was obtained from the National Institute for Biological Standards and Control. Alkaline phosphatase with an activity between 2,000 and 4,000 Umg−1 protein, gelatin from porcine skin, bovine serum albumin (BSA), human serum albumin (HSA) and Tween 20 was from Sigma. Dimethyl sulfoxide (DMSO) was purchased from Fluka. The enzyme substrate, para-aminophenyl phosphate (PAPP), was obtained from DiagnoSwiss (Monthey, Switzerland). Tosyl-activated Dynabeads® MyOne™ (1.08 μm in diameter) were from Invitrogen (Oslo, Norway).
All the buffers and sample solutions were prepared with water produced by an alpha Q Millipore System (Zug, Switzerland).
Buffers had the following composition: blocking buffer (phosphate buffer saline (PBS) pH 7.4 containing 0.05% Tween 20 and 0.5% gelatin), washing buffer (PBS pH 7.4 containing 0.05% Tween 20) and substrate solution for
electrochemical reaction (PAPP 10 mM in 100 mM Tris buffer, pH 9.8).
Apparatus
All the assays were carried out with the GRAVI™-Cell immunoassay device from DiagnoSwiss (Monthey, Switzerland). The instrument is used with polyimide GRAVI™-Chips that are composed of eight independent microchannels allowing the performance of eight tests in parallel. The chips are reusable if the microchannels are washed carefully after each experiment. Each microchannel, which is 1.5 cm in length and has a cross-section of 90× 200 μm2, possesses two 30 μl reservoirs, at the inlet and outlet of the channel respectively. The distance between two microchannels, 9 mm, was defined to provide compatibility with standard microtitreplates. Electrochemical detection occurs directly in the chip thanks to integrated micro-electrodes. As indicated by its name, the GRAVI™-Cell is a device in which liquid flows are driven by gravity and capillary forces only, as the chips are fixed to a surface tilted at 30°. An array of eight permanent magnets is integrated to the device and can be easily placed and removed. Data were acquired and processed with the GRAVI-Soft software. The different elements are illustrated in Fig.1.
Grafting mouse anti-human IgE antibody to magnetic beads Anti-human IgE antibody (0100–0413) was covalently coupled to tosyl-activated magnetic beads following the manufacturer’s instructions. An antibody/bead ratio of 40 μg of antibody for 1 mg of beads is generally recommended for an optimal conjugation reaction. A 10-μl volume of beads (100 mg ml−1) was first washed three
times with 100μl of coating buffer (sodium borate buffer,
100 mM, pH 9.5) and then resuspended in 87 μl of the same buffer. Then, 40 μl of anti-human IgE antibody (1 mg ml−1) and 83 μl of ammonium sulphate (3 M in coating buffer) were added. The mixture was incubated for 24 h at 37 °C with slow agitation. Finally, the beads were washed twice with washing buffer and resuspended in PBS containing 0.025% of Tween 20 and 0.02% of sodium azide. Before use, the required amount of magnetic beads was blocked with blocking buffer overnight at 37 °C with slow agitation (beads at 1 mg ml−1). The beads were further diluted in PBS with 0.05% Tween 20. The success of the grafting was investigated by a CE immunoaffinity method described by Chen et al. [25]. The grafted magnetic beads were trapped in the capillary, a standard human IgE solution was flowed through the capillary and IgE were captured on the beads. After washing, acidic conditions were used to release the IgE and detect them.
To get an insight of the amount of antibodies grafted on the magnetic beads, a BCA protein assay was performed (Pierce, USA) according to the manufacturer instructions: 1 ml of working reagent was mixed with 50 μl of sample/beads followed by a 3-h incubation at room temperature with slow agitation in order to avoid bead sedimentation. The bead sample was prepared as follows: 10μl of beads (5 mg ml−1) was washed three times and resuspended in 50 μl water. Absorbance measurements were carried out with a Lambda XLS+UV/Vis spectrophotometer (PerkinElmer) at 562 nm. A calibration curve was then determined with 7 standard anti-human IgE antibody (0100–0413) solutions ranging from 2.5 to 250μg ml−1(R2=0.9983). A blank containing non-grafted tosyl-activated beads was measured and its signal subtracted from the grafted bead signal. With the data provided by the bead manufacturer, the number of antibodies per bead and Γmax were determined to be 1.4857·105 Ab bead−1 and
6.738·10−8mol m−2respectively.
Fig. 1 (a) GRAVI™-Cell device with an 8-microchannel chip tilted at 30°. (b) Cross-section along a microchannel showing the trapping of the magnetic beads. (c) GRAVI™-Chip comprising eight microchannels with two lines of reservoirs, at the inlet (top) and the outlet (bottom)
Labelling mouse anti-human IgE antibody with alkaline phosphatase
Alkaline phosphatase (0.2 mg) was first dissolved in 100μl (0.1 mg) of anti-human IgE antibody (0100–0414). An aqueous solution (5 μl) of glutaraldehyde 1% was then added to the solution. The mixture was incubated 24 h at room temperature with slow agitation. Then, 10 μl of ethanolamine 1 M was added and the solution was left for 2 h incubation at room temperature with slow agitation. Finally, 115μl of PBS containing 0.05% of Tween 20 and 0.04% of sodium azide was added.
Immunoassay procedure
The protocol is divided in six main steps:
1. Sample preparation: Four microlitres of antibody coated magnetic beads was mixed with 10 μl of IgE (reference solution or diluted serum) and 6 μl of ALP-labelled antibody. Each solution was at the desired concentration. The mixture was then incubated for 30 min at room temperature with agitation.
2. Blocking step: If the microchip was used for the first time, the microchannels were pre-wetted with ethanol and water. The microchannels were then washed with PBS containing 0.05% of Tween 20 by loading the solution into the top reservoirs of the chip. Then, 20μl of blocking buffer was percolated by gravity through the channels for a total duration of 14 min, so as to block their surface and avoid non-specific adsorption. It can be noted that this step was carried out during the sample incubation, avoiding any dead time.
3. Sample dispensing: Fifteen microlitres of the incubated sample mixture was dispensed in the upper reservoirs of the microchip. The solution flowed through the microchannels, while the magnetic beads were trapped nearby the electrodes by the magnet array.
4. Washing: The upper reservoirs were rinsed three times with 20 μl of washing buffer and the channels were washed with 15 μl of the same buffer to eliminate contaminants and unbound reagents.
5. Substrate addition and electrochemical detection: Twenty microlitres of PAPP solution was dispensed in the top reservoirs of the microchip for enzyme-mediated generation of electrochemical signal. Alkaline phosphatase hydrolyzes PAPP into the elec-trochemically active p-aminophenol (PAP). By apply-ing an oxidizapply-ing potential, PAP is then converted into 4-quinonimide (4-QI) and two electrons are produced. After 1 min, the excess of substrate is removed from the top reservoirs and the electrochemical signal, generated by application of a 300-mV potential versus
Ag/AgCl, is measured in static mode during 0.5 s alternatively in each channel. The measurement was repeated ten times per channel for a total acquisition time of 1 min and a plot of the current versus time was obtained for each channel.
6. Chip regeneration: Once the signal readout was over, the magnet array was removed. Twenty microlitres of DMSO was dispensed in the top reservoirs and directly aspired through the channels by application of a depression in the bottom reservoirs. This procedure was repeated three times to denature and eliminate beads and other reagents from the microchannels. Finally, reservoirs and channels were washed with water and PBS containing 0.05% of Tween 20.
Results and discussion Non-specific adsorption
Adsorption is a pervasive phenomenon, such as in this work, IgE, anti-IgE or other serum sample components may adsorb to the microchannel walls or to the magnetic beads. These non-specific interactions have to be limited, as they might skew quantitative results. Consequently, it is neces-sary to block the surfaces to obtain a powerful quantitative method. Many blocking agents are available and the most common ones are proteic, such as BSA or casein, but polymeric coatings, such as poly(vinyl pyrrolidone) (PVP), are also used [26].
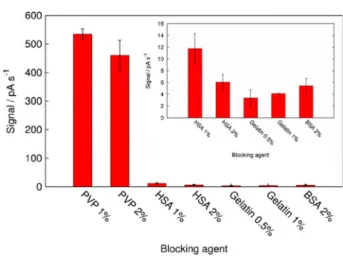
The first step of this study was to reduce the non-specific adsorption on channel walls by testing four blocking agents: PVP, HSA, BSA and gelatin. Therefore, channels were filled with a blocking solution prepared in PBS, 0.05% Tween 20 and left for incubation. A solution of labelled antibody was then percolated through the channels, followed by washing and electrochemical detection. Results obtained with the four blocking agents are presented in Fig.2. It can be seen that a high residual signal is obtained for PVP, meaning that the blocking of the channels is not efficient. HSA, gelatin and BSA reduce non-specific adsorption in the same manner and the background signal is very low relative to the specific signal obtained with the beads (see Figs. 4 and 5). However, as this study is dedicated to allergy, it is necessary to take into account the potential allergenicity of the blocking agent. Milk allergy is the most frequent food allergy among children, but it is less frequent in adults [27]. While milk contains around 20 different potentially allergenic proteins, only a few are recognized as major allergens, notably ß-lactoglobulin and casein [27]. Allergy to BSA is rare and this protein is
considered as a minor allergen [28]. Nevertheless, as the serum quantified in this work comes from a milk allergic patient and as the exact allergen(s) is unknown, BSA should not be used as a blocking agent. HSA being an expensive protein, it was excluded because of its price. Finally, porcine gelatin was chosen as the blocking agent. Though, it might also be considered as an allergenic compound. However, pork meat is very rarely allergenic; moreover, a recent study conducted on 116 pork meat-specific IgE positive children showed that only 38% of them were positive for porcine gelatin-specific IgE [29], showing how unlikely is an allergy to gelatin. To exclude any specific reaction between the reference IgE and gelatin, an experiment consisting in coating the microchannels, flowing an IgE solution (6,000 ng ml−1 in PBS 0.05% Tween 20) before percolating the labelled antibody was performed and no significant signal was observed.
Finally, non-specific adsorption on the magnetic beads was also investigated. The beads were blocked as described in the“Material and methods” section. The microchannels
were first blocked with PBS containing 0.05% of Tween 20 and 0.5% of gelatin. Blocked and non-blocked magnetic beads were incubated with labelled antibody and the solution was then percolated through the microchannels, followed by a washing and a detection step. A signal should be observed only if non-specific interactions occur. The results showed that the blocking step decreases significantly the electrochemical signal to 5% of its initial value (from 399.0±50.9 to 22.3±3.2) indicating that blocking the beads is a necessary step.
Immunoassay optimization
After eliminating all possible sources of non-specific adsorption, the optimal concentrations of the magnetic beads and labelled antibody solutions had to be determined before calculating any calibration curve. To that purpose, seven reference IgE concentrations were prepared, ranging from 46.875 to 3,000 ng ml−1. Various concentrations of each parameter were investigated for all reference IgE concentrations, keeping the second parameter constant, providing a“calibration curve” for each parameter value.
The optimal magnetic bead concentration was first determined by varying its concentration from 0.0125 to 0.4 mg ml−1 and keeping a constant concentration of labelled antibody, high enough (30μg ml−1) so as it is not a limiting factor. It can be observed in Fig. 3 that there is clear dependence of the current on the bead concentration. For a given IgE concentration, the signal increases with the bead concentration up to 0.2 mg ml−1 and a decrease is observed for 0.4 mg ml−1. It is probably due to the fact that
Fig. 2 Effect of different blocking agents on the non-specific adsorption on the microchannel walls. The inset is a zoom showing the lowest signals. Blocking buffers were as follows: PBS 0.05% Tween 20 with PVP 1% or 2%, HSA 1% or 2%, gelatin 0.5% or 1% or BSA 2%. Procedure is as follows: (1) loading two times 20μl of the blocking solution; (2) incubation: 30 min for PVP solutions, 12 min for HSA and gelatin, 6 min for BSA; (3) loading 20μl of labelled antibody 25μg ml−1; (4) washing and (5) detection
Fig. 3 Signal obtained for different magnetic bead concentrations. Conditions are as follows: labelled antibody concentration = 30μg ml−1. (a) 3D plot and (b) 2D plot with the dots representing the different bead concentrations
the beads sediment, either in the well or in the channel and impede the flow through the microchannel. By looking at the signal for a constant bead concentration, it can be seen that the signal increases with IgE concentration. However, for bead concentrations lower than 0.2 mg ml−1, there is a sudden decrease for the 3,000 ng ml−1 IgE concentration, certainly due to a high-dose hook effect. Indeed, this effect occurs only in one-stage sandwich immunoassays, when the first antibody, antigen and second antibody are simultaneously mixed. It is due to excessive analyte concentrations that simultaneously saturate both capture and detection antibodies, preventing the formation of the full complex [5]. A way to avoid this undesired effect is to perform the immunoassay in two steps, and to wash the excess analyte before adding the labelled antibody. This would be easy to implement, as magnetic beads can be isolated with a magnet, but it would also extend the assay time. Consequently, it was decided in this work to give priority to assay time and perform a one-step assay requiring finding conditions where no hook effect occurs.
Concerning the optimal bead concentration, according to the results, values equal to 0.1 or 0.2 mg ml−1 would be suitable, as both give high signal. Nevertheless, to minimize bead and labelled antibody consumption, 0.1 mg ml−1 was chosen for the following experiments, even if the hook effect observed at 0.1 mg ml−1decreases the assay dynamic range.
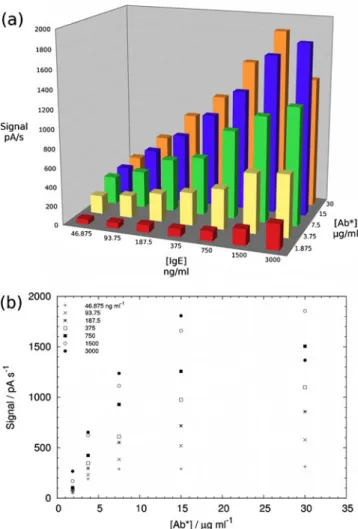
The concentration of ALP-labelled antibody was then optimized for a constant 0.1 mg ml−1 bead concentration. Labelled antibody concentration was varied from 1.875 to 30 μg ml−1 with the same IgE concentration range as previously. As illustrated in Fig.4, for a given IgE concentration, the signal increases with the labelled antibody concentration, but this increase is more pro-nounced for higher IgE concentrations, while the lowest tend to saturation. This is certainly due to the low amount of IgE to bind that is the limiting factor. Consequently, increasing the concentration of beads is useless, as there are already too many binding sites for IgE antibodies. Similar to the magnetic bead optimization, for an identical labelled antibody concentration, the signal increases with the IgE concentration, but as already observed before, a decrease due to a high-dose hook effect is observed for the highest labelled antibody concentration. However, this effect dis-appears when the labelled antibody concentration decreases. It can thus be attributed to the high IgE concentration, but also certainly to an excess of labelled antibody relative to the number of binding sites available on the beads. Indeed, as described by Fernando and Wilson, the one-step reaction is assumed to reach equilibrium and if any of the three reactants is present in insufficient or excess amount, the equilibrium may shift in either direction causing significant signal deviation from the expected behaviour [30]. By decreasing the labelled antibody
Fig. 5 Calibration curves for the quantification of total IgE. A linear response was determined for the logarithm of reference IgE concentration. Conditions are as follows: magnetic beads (0.1 mg ml−1) blocked overnight with gelatin 0.5%, labelled antibody 15μg ml−1
Fig. 4 Signal obtained for different labelled antibody concentrations (Ab*). Conditions are as follows: bead concentration=0.1 mg ml−1. (a) 3D plot and (b) 2D plot with the dots representing the different IgE concentrations
concentration without modifying that of the beads, the equilibrium is displaced and no hook effect is observed anymore. Finally, as all labelled antibody concentrations lower than 30μg ml−1provide curves without hook effect for this IgE concentration range and consequently a higher dynamic range, the concentration ensuring the highest signal, 15 μg ml−1, was chosen for the following experi-ments. Concerning the sensitivity, the limit of detection (LOD) depends on background noise, on the presence of contaminations, on non-specific adsorption, as well as on the residual oxidation of some assay components, like the assay biomolecules. As a consequence, increasing the bead and labelled antibody concentrations may induce a higher noise, leading to a higher LOD. However, this feature was not studied in detail in this work.
Calibration curve and application to patient serum sample With a view of quantifying total IgE in patient serum sample, a calibration curve was plotted using the optimal bead and labelled antibody concentrations determined in the previous section, and the same reference human IgE concentration range. A linear calibration curve, average of three experiments performed in the same chip, was obtained for IgE concen-trations ranging from 46.875 to 3,000 ng ml−1between the logarithm of the IgE concentration and the signal (Fig. 5). Higher concentrations led to a decreased signal, due to the hook effect described previously. The calibration curve in the same chip is quite reproducible (RSD=4.2%, n=3). The assay limit of detection, defined as three times the standard deviation of the blank, that is to say an assay with a zero IgE concentration, was determined to be 17.5 ng ml−1IgE.
The applicability of the method was then demonstrated through the analysis of a patient serum sample that had already been quantified by two other methods, ImmunoCap (performed by the Laboratoire Environnement et Chimie Analytique in Paris) and an immunoaffinity capillary electrophoresis method developed in our laboratory [21]. To fully validate the method, more samples should be analysed, but the goal of this study was to demonstrate the concept only. To avoid any potential variation due to the use of different experimental conditions, the calibration curve and the serum sample were analysed simultaneously thanks to the eight parallel microchannels of the chip. In the present case, five calibrators and three dilutions of the
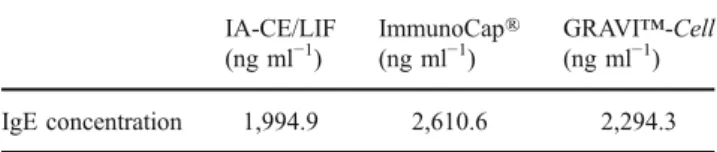
serum sample were tested together. Knowing the total IgE concentration of the sample previously determined by two other methods, the sample was diluted 16, 32 and 43 times. However, in the case of an unknown sample, the dilution factor could be adapted. Four repetitions were performed on the same chip, and RSD values of 7.8%, 10.4% and 9.2% were obtained for dilutions of 16, 32 and 43 respectively. The average IgE concentration calculated for the three dilutions is 2,294.3 ng ml−1and the average RSD is equal to 9.1%. By comparing these results with those obtained by other techniques as in Table 1, it can be seen that the GRAVI™-Cell results are in good agreement.
To evaluate the inter-chip reproducibility of the test, the sample was then analysed with another chip and different batches of magnetic beads and labelled antibody. The calibration curve obtained by the analysis of five calibrators (46.875, 93.75, 187.5, 375 and 750 ng ml−1) is shown in Fig. 6, with the three sample dilutions in red. An average concentration of 2,279.2 ng ml−1 was obtained for the quantification of total IgE in the serum sample. This result is in good agreement with that found previously (RSD (IgE concentration) <1%).
Conclusions
The GRAVI™-Cell technology, where fluids are driven by gravity and capillary force, was successfully applied to the quantification of total IgE in human serum. A one-step sandwich-type ELISA using magnetic beads as a solid phase for the first antibody was developed. The mixture bead/analyte/second antibody was incubated off-line and then percolated through the channels where magnetic beads were trapped, enabling the separation of the solid phase
Table 1 Comparison of different techniques for the total IgE quantification in a patient serum sample
IA-CE/LIF (ng ml−1) ImmunoCap® (ng ml−1) GRAVI™-Cell (ng ml−1) IgE concentration 1,994.9 2,610.6 2,294.3
Fig. 6 Calibration curve (black) and signal obtained for three different dilutions of serum sample (red triangles). All the values were measured simultaneously in the eight channels of the chip. Conditions are as follows: magnetic beads (0.1 mg ml−1) blocked overnight with gelatin 0.5%, labelled antibody 15μg ml−1
from the excess reagents. Finally, after washing, electro-chemical detection was performed.
Firstly, the non-specific adsorption was reduced by finding a good blocking agent for both microchannels and beads that had to be compatible with this allergy-based test, that is to say non potentially allergenic. As the sample studied here was from a milk-allergic patient, blocking proteins from milk had to be avoided. However, with other samples, the blocking agent may be adapted, as allergies to porcine gelatin are possible. Secondly, the optimal magnetic bead and labelled antibody concentrations were investigated by measuring the signal obtained for a range of reference IgE concentrations. A compromise between minimal reagent consumption and high-dose hook effect shunning was found. Finally, calibration curves were measured and their reproduc-ibility was studied before carrying out the quantification of one sample that showed results in good accordance with those obtained by ImmunoCap® and Immunoaffinity CE measure-ments. Good reproducibility (RSD<10%) inter- and intra-chip was observed.
Thanks to the eight parallel microchannels in each chip, calibration and sample analysis can be performed simulta-neously. In spite of 30 min incubation of the sample with the beads and secondary antibody, the entire assay can be performed in less than 1 h, and thanks to the miniaturized format, only 1.5μl of serum was required for the sample studied in this work. Moreover, the platform offers the possibility to use a robot for mixing the solutions and transferring the solutions from a microtiterplate, enabling a fully automated assay.
Acknowledgements The authors wish to thank the Swiss National Science Foundation for financial support grant entitled “Supramolec-ular phases for protein adsorption” (Grant No 404740-117321). The authors also thank DiagnoSwiss for fruitful collaboration and Hélène Sénéchal (LECA ESPCI Paris) for providing the serum sample and for the helpful advice.
References
1. Abbas AK, Lichtman AH (2009) Basic immunology: functions and disorders of the immune system. Saunders Elsevier, Philadelphia
2. Kay AB (2000) Overview of‘Allergy and allergic diseases: with a view to the future’. Brit Med Bull 56(4):843–864
3. Platts-Mills TAE (2001) The role of immunoglobulin E in allergy and asthma. Am J Resp Crit Care 164(8):S1–S5
4. Ebo DG, Hagendorens MM, Bridts CH, Schuerwegh AJ, De Clerck LS, Stevens WJ (2004) In vitro allergy diagnosis: should we follow the flow? Clin Exp Allergy 34(3):332–339
5. Wild D (2001) The immunoassay handbook. Nature Publishing Group, New York
6. Papamichael KI, Kreuzer MP, Guilbault GG (2007) Viability of allergy (IgE) detection using an alternative aptamer receptor and electrochemical means. Sensor Actuat B-Chem 121(1):178–186
7. Hamilton RG, Williams PB (2010) Human IgE antibody serology: a primer for the practicing North American allergist/immunologist. J Allergy Clin Immunol 126(1):33–38
8. Li HY, Dauriac V, Thibert V, Senechal H, Peltre G, Zhang XX, Descroix S (2010) Micropillar array chips toward new immuno-diagnosis. Lab Chip 10(19):2597–2604
9. Kreuzer MP, O’Sullivan CK, Pravda M, Guilbault GG (2001) Development of an immunosensor for the determination of allergy antibody (IgE) in blood samples. Anal Chim Acta 442(1):45–53 10. Gokulrangan G, Unruh JR, Holub DF, Ingram B, Johnson CK,
Wilson GS (2005) DNA aptamer-based bioanalysis of IgE by fluorescence anisotropy. Anal Chem 77(7):1963–1970
11. Maehashi K, Katsura T, Kerman K, Takamura Y, Matsumoto K, Tamiya E (2007) Label-free protein biosensor based on aptamer-modified carbon nanotube field-effect transistors. Anal Chem 79 (2):782–787
12. He JL, Wu ZS, Zhang SB, Shen GL, Yu RQ (2009) Novel fluorescence enhancement IgE assay using a DNA aptamer. Analyst 134(5):1003–1007
13. Wang JL, Munir A, Li ZH, Zhou HS (2010) Aptamer-Au NPs conjugates-accumulated methylene blue for the sensitive electro-chemical immunoassay of protein. Talanta 81(1–2):63–67 14. Li Y, Ren JJ, Nakajima H, Soh N, Nakano K, Imato T (2007)
Surface plasmon resonance immunosensor for IgE analysis using two types of anti-IgE antibodies with different active recognition sites. Anal Sci 23(1):31–38
15. Su XD, Zhang H (2004) Comparison of surface plasmon resonance spectroscopy and quartz crystal microbalance for human IgE quantification. Sensor Actuat B-Chem 100(3):309– 314
16. Ohashi T, Mawatari K, Sato K, Tokeshi M, Kitamori T (2009) A micro-ELISA system for the rapid and sensitive measurement of total and specific immunoglobulin E and clinical application to allergy diagnosis. Lab on a Chip 9(7):991–995
17. Ho JAA, Wu LC, Chang LH, Hwang KC, Hwu JRR (2010) Liposome-based immunoaffinity chromatographic assay for the quantitation of immunoglobulin E in human serum. J Chromatogr B 878(2):172–176
18. Gijs MA, Lacharme F, Lehmann U (2010) Microfluidic applications of magnetic particles for biological analysis and catalysis. Chem Rev 110(3):1518–1563
19. Hahn YK, Jin Z, Kang JH, Oh E, Han MK, Kim HS, Jang JT, Lee JH, Cheon J, Kim SH, Park HS, Park JK (2007) Magnetophoretic immunoassay of allergen-specific IgE in an enhanced magnetic field gradient. Anal Chem 79(6):2214–2220
20. Peng QW, Cao ZJ, Lau CW, Kai M, Lu JZ (2011) Aptamer-barcode based immunoassay for the instantaneous derivatization chemilumi-nescence detection of IgE coupled to magnetic beads. Analyst 136 (1):140–147
21. Chen HX, Busnel JM, Peltre G, Zhang XX, Girault HH (2008) Magnetic beads based immunoaffinity capillary electrophoresis of total serum IgE with laser-induced fluorescence detection. Anal Chem 80(24):9583–9588
22. Morier P, Vollet C, Michel PE, Reymond F, Rossier JS (2004) Gravity-induced convective flow in microfluidic systems: Elec-trochemical characterization and application to enzyme-linked immunosorbent assay tests. Electrophoresis 25(21–22):3761–3768 23. Rossier JS, Baranek S, Morier P, Vollet C, Vulliet F, De Chastonay Y, Reymond F (2008) GRAVI: Robotized micro-fluidics for fast and automated immunoassays in low volumes. JALA 13:322–329
24. Laschi S, Miranda-Castro R, Gonzalez-Fernandez E, Palchetti I, Reymond F, Rossier JS, Marrazza G (2010) A new gravity-driven microfluidic-based electrochemical assay coupled to magnetic beads for nucleic acid detection. Electrophoresis 31(22):3727– 3736
25. Chen HX, Busnel JM, Gassner AL, Peltre G, Zhang XX, Girault HH (2008) Capillary electrophoresis immunoassay using magnetic beads. Electrophoresis 29(16):3414–3421
26. Salim M, McArthur SL, Vaidyanathan S, Wright PC (2011) Towards proteomics-on-chip: the role of the surface. Mol Biosyst 7(1):101–115
27. Restani P, Ballabio C, Di Lorenzo C, Tripodi S, Fiocchi A (2009) Molecular aspects of milk allergens and their role in clinical events. Anal Bioanal Chem 395(1):47–56
28. Aparicio VF, Marcen IS, Montero AP, Baeza ML, Fernandez MD (2005) Allergy to mammal’s meat in adult life: immunologic and follow-up study. J Invest Allerg Clin 15(3):228–231
29. Bogdanovic J, Halsey NA, Wood RA, Hamilton RG (2009) Bovine and porcine gelatin sensitivity in children sensitized to milk and meat. J Allergy Clin Immunol 124(5):1108–1110 30. Fernando SA, Wilson GS (1992) Studies of the hook effect in
the one-step sandwich immunoassay. J Immunol Methods 151 (1–2):47–66