DOI 10.1007/s00426-008-0167-1
O R I G I N A L A R T I C L E
The e
Vect of spatial frequency content on parameters
of eye movements
Marina T. Groner ·Rudolf Groner · Adrian von Mühlenen
Received: 12 June 2007 / Accepted: 28 January 2008 / Published online: 15 October 2008 © Springer-Verlag 2008
Abstract Two experiments were conducted to examine the inXuence of the spatial frequency content of natural images on saccadic size and Wxation duration. In the Wrst experiment 10 pictures of natural textures were low-pass Wltered (0.04–0.76 cycles/deg) and high-pass Wltered (1.91– 19.56 cycles/deg) and presented with the unWltered origi-nals in random order, each for 10 s, to 18 participants, with the instruction to inspect them in order to Wnd a suitable name. The participants’ eye movements were recorded. It was found that low-pass Wltered images resulted in larger saccadic amplitudes compared with high-pass Wltered images. A second experiment was conducted with natural stimuli selected for diVerent power spectra which supported the results outlined above. In general, low-spatial frequen-cies elicit larger saccades associated with shorter Wxation durations whereas high-spatial frequencies elicit smaller saccades with longer Wxation durations.
Introduction
In their pioneering research Buswell (1935) and Yarbus (1967) demonstrated that eye movements of observers looking at complex natural scenes depend on characteristics of the stimulus as well as on the intention of the observer.
Recently, the control of eye movements as part of an active vision system has become again an important topic not only for psychologists trying to understand the mechanisms of information-seeking but also for people designing artiWcial vision systems.
There is general consent that eye movements are guided by stimulus features as well as by cognitive processes. The question discussed at present is to what extent and under what conditions they are controlled bottom-up or top-down. One of the most important factors determining the pattern of eye movements is the nature of the task people are involved in. The locations of Wxations in goal-directed actions are mainly controlled top-down, whereas in free viewing of a scene the inXuence of stimulus features can be demonstrated. Land and Hayhoe (2001) registered eye movements of people preparing food. Nearly all Wxations were directed towards relevant objects before and during their handling. In a study by Turano, Geruschat, and Baker (2003) participants had to walk towards a target. A model using only bottom-up information could not explain their Wxation behavior. Top-down information about the target’s coarse features had to be included into the model.
There are studies that compared patterns of eye move-ments in diVerent tasks. Henderson, Weeks, and Holling-worth (1999) let participants either search for a certain object in a scene or let them memorize the scene. They found a diVerent pattern of Wxations. When participants searched for an object they Wxated it faster than when they had to memorize the scene. Henderson and Hollingworth (1998) compared eye movement parameters of scene view-ing with those of readview-ing. The variance and the mean of Wxation duration and saccade length were greater in scene viewing than in reading. Similar results were found by Andrews and Coppola (1999) studying eye movements with diVerent types of images and tasks. Viewing a M. T. Groner (&)
Department of Psychology,
University of Bern, CH 3000 Bern 9, Switzerland e-mail: [email protected]
R. Groner
Institute for Research in Open-, Distance-, and eLearning, Distance University of Switzerland, Brig, Switzerland
A. von Mühlenen
complex natural scene and viewing simple textured patterns led to correlated eye movement parameters such as mean Wxation duration and saccade length. The same result was found for reading and search but there was no correlation between the eye movement parameters of these tasks and those of viewing complex natural scenes and simple pat-terns. These studies demonstrate that free viewing of a scene leads to a diVerent pattern of eye movements.
Under free viewing conditions, stimulus characteristics have been demonstrated to have an eVect on Wxation behav-ior. Deubel and Elsner (1986) found in a threshold percep-tion task that saccades were larger when low spatial frequencies were viewed. In studies with above threshold perception, local features of the stimulus at Wxation locations were compared with those features at randomly chosen or not-Wxated locations. Several features such as edge density and contrast were found to be greater at the points of Wxation (Mannan, Ruddock, & Wooding, 1996, 1997; Parkhurst & Niebur, 2003). In a similar study, Krieger, Rentschler, Hauske, Schill, and Zetzsche (2000) analysed second-order statistics of the stimuli and found that regions with higher spatial variance had a higher probability to be Wxated.
The non-uniform distribution of features in an image can be modeled as saliency map and be used to predict Wxation behavior in a pure bottom-up way. Itti and Koch (2000) implemented a computational model in which saliency was deWned by intensity, color, and orientation. Parkhurst, Law, and Niebur (2002) applied this model to predict natural viewing of diVerent types of images. They found that the pure bottom-up mechanisms of this model could contribute signiWcantly to the explanation of Wxation behavior. Tatler, Baddeley, and Gilchrist (2005) tested diVerent saliency models to predict Wxation locations in natural scenes. They found that contrast and edge information discriminated bet-ter between Wxated and non-Wxated locations, as compared to luminance and chromaticity, especially in high spatial frequency bands.
Most studies providing evidence for stimulus-driven, bottom-up control of eye movements are based on correla-tions between local stimulus features and the frequency with which these locations are being Wxated. However, sta-tistical correlation does not exclude the possibility that the local features attracting Wxations are associated with infor-mativeness about objects and therefore the control of eye movements runs top-down. To be able to interpret the results in a more causal way local features of the stimuli should be varied without much changing the informative-ness about objects.
As a consequence of these considerations we varied the spatial frequency content of images and presented them to participants in a natural viewing task. Pictures of natural textures such as gravel, ice, bark, textiles, etc. were chosen as stimuli and digitally Wltered, thus containing either the
full range of spatial frequencies or only low-pass or high-pass components. The cutoV frequencies were chosen according to the model of spatial channels by Wilson and Bergen (1979). We expect that, compared with unWltered images, low-pass Wltered stimuli will elicit larger saccadic sizes, while high-pass Wltered images will elicit smaller sac-cades. Such a prediction can be related to studies which demonstrated something like a “saccadic responsive Weld size” as has been shown by double-step target studies (Becker & Jürgens, 1979), multiple-target experiments (Menz & Groner, 1986), or the center-of-gravity eVect (Findlay, 1982) where it was demonstrated that the landing position of a next saccade is computed over an area of inte-gration analogous to receptive Weld size.
With respect to Wxation duration, two diVerent hypothe-ses can be stated which contradict each other. The Wrst hypothesis goes back to the well established result that low spatial frequency stimuli show shorter reaction times (Breitmeyer, 1975; Lupp, Hauske, & Wolf, 1976) and shorter durations of visible persistence (Di Lollo & Woods, 1981). These Wndings lead to the prediction that low-pass Wltered images elicit shorter Wxation durations. On the other hand, eye movement research in reading and other cognitive tasks usually show a positive correlation of Wxation duration with saccadic size (Salthouse & Ellis, 1980; Heller & Müller, 1983). If saccadic size is larger with low spatial frequencies and smaller with high spatial frequencies, as stated above, then it should follow that low-pass Wltered images will lead to longer Wxation durations and high-pass Wltered images to shorter Wxations.
Experiment 1 Method Participants
Eighteen undergraduate students (12 women and 6 men) participated in Experiment 1 in partial fulWlment of a course requirement. The average age was 27 years. Seven Participants had normal and 11 corrected-to-normal vision. Each participant served in a single session of about 30 min. Apparatus
The stimuli were presented on a 14⬙ Eizo Flexscan 8060S monitor, which was driven by a PC through a Matrox graphics board (PIP-512/1024A). A head-chin rest helped participants in maintaining their head at the same position throughout a block of trials. Participants viewed the display monitor from a distance of 57 cm. The total screen area subtended 20° £ 27° of visual angle.
Eye movements were recorded with the OBER2 limbus tracker from Permobil Meditech. Eye position was sampled with a frequency of 200 Hz on both eyes. This recording system was driven by a second PC computer. The unpro-cessed signals were online plotted on the recording com-puter monitor, which was only visible to the experimenter. The eye movement data were stored on the recording com-puter’s hard disc. The two computers were connected with each other by a parallel port cable to allow synchronisation between the display and the recording system and to set time markers in the data Wle for diVerent events (calibration cross or stimulus onset) on the stimulus computer.
The laboratory was dimly illuminated to eliminate reXections on the CRT. The lamp was connected to a direct current converter to minimize interference with the eye movement recording.
Stimuli
All stimuli were based on ten photographs of natural tex-tures taken from a standard work of textex-tures. In a Wrst step the photographs were digitized and saved in a computerized image format with a resolution of 512 £ 512 pixels and 255
grey scale values. These digitized pictures were the base for all subsequent processing. Three diVerent versions of stim-uli textures were generated: In the Wrst version the original images were used without being Wltered. In the second ver-sion the images were low-pass Wltered, including only fre-quencies within the range of 0.04–0.76 cycles/deg. This range of spatial frequencies is assumed to be processed by the lowest spatial channel with a peak sensitivity of about 0.8 cycles/deg (Peterzell & Teller, 1996). This channel cor-responds to the U-channel in the model of Wilson and Bergen (1979). In the third version the images were high-pass Wltered, including only frequencies within the range of 1.91– 19.56 cycles/deg. This range is assumed to be processed by the S- and N-channels in the Wilson and Bergen model. For some examples see Fig.1. This produced a total of 30 stim-uli textures, three versions (unWltered, low-pass Wltered, and high-pass Wltered) for each of the ten texture images. Procedure
The experiment was divided into one exercise- and ten test-blocks. Each block started with a new calibration of the display-recording system. A cross was successively presented Fig. 1 Three examples of
stim-uli in Experiment 1. The unWl-tered images are presented in the
left-hand column, the low-pass
Wltered images in the middle
column, and the high-pass
Wltered images in the
at 13 diVerent positions on the screen (one at every position of a 4 £ 3 matrix and twice at the screen centre). Each cross appeared for 1 s at its position, followed by a 1 s blank screen. Participants were told to Wxate the cross while it was shown.
After calibration the three pictures of a block were shown. Each trial was started by the experimenter and it began with a central Wxation cross which was on for 1 s. Participants were told to Wxate the cross, which was con-trolled by the Experimenter by looking at the approximate eye positions on the recording monitor. After the Wxation cross disappeared the picture was presented for 10 s.
Participants were asked to look at each picture for the whole 10 s it was presented. Their main task was to Wnd a possible name for each of these pictures. After each picture there were 10 s to tell a name. If no name was given during this time, the experimenter suggested to call it “no title” and started the next trial. After each block there was a short break, where participants could remove their head from the head-chin rest.
Design
There were two variables: texture (1–10) and Wlter (unWl-tered, low-pass, high-pass), giving a total of 30 pictures. The order of stimuli was for each participant randomly cho-sen, with the restraint that a block of consecutive pictures always contained an unWltered, a low-pass Wltered and a high-pass Wltered image, which were generated from diVer-ent textures. The order within a block was random.
Data analysis
The data were analysed using the software of Walther-Müller (1993). First the raw data were smoothed using a mov-ing average (median) over three consecutive data points.
For calibration appropriate Wxations were chosen for each cross shown on the screen (300 ms with least variation during stimulus onset). These values for the x- and y-chan-nel were used in a multiple linear regression analysis to estimate eye positions (least square) for the corresponding cross positions on the screen.
Saccadic eye movements and Wxations were identiWed for both eyes separately with a noise adapting velocity threshold algorithm. The critical velocity was 36°/s for sac-cade-begin and 18°/s for saccade-end. Saccades that were smaller than 0.4° of visual angle and Wxations that were shorter than 40 ms were eliminated. The result of this auto-matic identiWcation of Wxations and saccades was plotted on a monitor and visually veriWed.
Based on visual inspection 4 participants had to be dis-carded from further analysis: For two of them some of the recordings were out of range. The other two produced a very noisy signal, which led to a bad Wxation-saccade
iden-tiWcation. For all participants the same parameter settings were used.
Results
For each participant and each picture, Wxation durations and saccadic size were averaged across the inspection interval of 10 s. The resulting scores were subjected to analyses of vari-ance with Wltering and texture as factors with repeated mea-sures. For saccadic size, there was a highly signiWcant main eVect of Wltering, F(2, 26) = 9.34, P < 0.01 (df corrected by the Huynh–Feldt factor). For Wxation duration, there was a signiWcant eVect of Wltering, F(2, 26) = 4.96, P < 0.05 (df corrected by the Huynh–Feldt factor). The diVerent textures had no eVect on both variables, and no interaction was found. Figure2a shows the eVects of Wltering on the mean sacc-adic size. Low-pass Wltered images and unWltered images produced larger saccades than high-pass Wltered images. The number of saccades being shorter than 3° increased when high-pass Wltered images were viewed (Fig.2b). The eVect of Wltering on Wxation durations is presented in Fig.3. The mean duration of Wxations was shorter with unWltered images than with Wltered images.
Discussion
The data from Experiment I showed that a change in the spatial frequency content of the images generated by Wlter-ing led to a change in the pattern of eye movements. Low-pass Wltered images evoked larger saccades than high-pass Wltered images. This seems plausible since low-pass Wltered images have a coarser structure. The unWltered images were close to the low-pass Wltered images with respect to average saccadic size they evoked. This suggests that eye move-ments might be controlled by information from the lowest spatial frequency channel.
The images of textures used as stimuli did not have a signiWcant eVect on saccadic size or Wxation durations, although their spatial frequency content varied. If our hypothesis holds then it should be possible to show such an eVect by selecting images which vary more strongly in their power spectra than the ones used in the present experiment. This was realized in Experiment 2.
Experiment 2 Method Participants
Twenty-four new participants (20 women and 4 men) took part in Experiment 2 in partial fulWlment of a course
requirement. The average age was 24 years. Twelve partici-pants had normal and 12 corrected-to-normal vision. Each participant served in a single session of about 30 min. Apparatus, procedure and stimuli
Apparatus and procedure were the same as in Experiment 1. Again, ten stimuli textures were used as source material. In
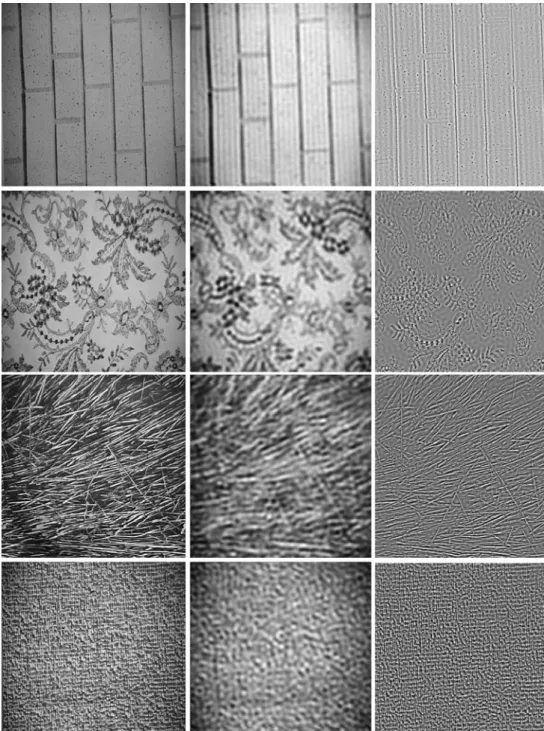
contrast to Experiment 1 they were chosen such that they varied in their power spectra. One group of textures called the “coarsies”, was deWned by high power in the low spatial frequency bands corresponding to the U- and T- channel in the model by Wilson and Bergen (1979). The other group of textures, called the “Wnies”, was deWned by high power in the high spatial frequency bands corresponding to the S- and N-channel in the model by Wilson and Bergen. For some examples of “Wnies” and “coarsies” see Fig.4. Six textures were taken from the same collection of textures as in Experiment 1. One of the textures was the same as in Experiment 1, the others were new. A second diVerence concerned the Wltering: Low-pass Wltered pictures con-tained frequencies smaller than 2.5 cycles/deg, and high-pass Wltered pictures contained frequencies larger than 2.5 cycles/deg. The low-pass Wltering contains the range of spatial frequencies assumed to be processed by the U- and T-channels in the model of Wilson and Bergen, the high-pass Wltering contains the range of spatial frequencies assumed to be processed by the S- and N-channels in the same model.
Design and data analysis
There were three variables: texture (1–5), texture coarse-ness (“Wnies”, “coarsies”), and Wlter (unWltered, low-pass, high-pass), giving a total of 30 pictures. The order of stim-uli was randomly chosen for each participant. The proce-dure for data analysis was the same as in Experiment 1. No participant had to be discarded.
Results
The eye movement data, saccadic size and Wxation dura-tions, were averaged for each participant and each group of textures across the inspection interval of 10 s. The resulting scores were subjected to analyses of variance with Wltering and spatial frequency content as factors with repeated mea-sures. With respect to saccadic size, highly signiWcant main eVects of both factors, Wltering, F(2, 46) = 8.24, P < 0.01, (df corrected by the Huynh-Feldt factor), and spatial Fig. 2 a Mean saccadic amplitudes for the unWltered, the low-pass
Wltered, and the high-pass Wltered images. b Frequency distributions of saccadic amplitudes for the three types of images
Saccade Size
3.8 4.2 4.6 5
unfiltered low-pass high-pass
Filter S iz e ( d eg rees) 0 5 10 15 20
Saccade size (degrees) 0 100 200 300 400 500 600 Frequency Unfiltered 0 5 10 15 20
Saccade size (degrees) 0 100 200 300 400 500 600 Frequency Low-pass filtered 0 5 10 15 20
Saccade Size (degree) 0 100 200 300 400 500 600 Frequency High-pass filtered a
b Fig. 3 Mean duration of Wxation for the unWltered, the low-pass
Wltered, and the high-pass Wltered images Fixation Duration
320 360 400 440
unfiltered low-pass high-pass
Filter
frequency content, F(1, 23) = 9.82, P < 0.01, were found. There was no interaction between the two factors. With respect to Wxation duration, a signiWcant main eVect of Wltering, F(2, 46) = 6.18, P < 0.05 (df corrected by the Huynh–Feldt factor), and a highly signiWcant main eVect of spatial frequency content, F(1, 23) = 62.92, P < 0.001, were found. Moreover there was a highly signiWcant inter-action between these two factors, F(2, 46) = 8.89, P < 0.01 (df corrected by the Huynh–Feldt factor).
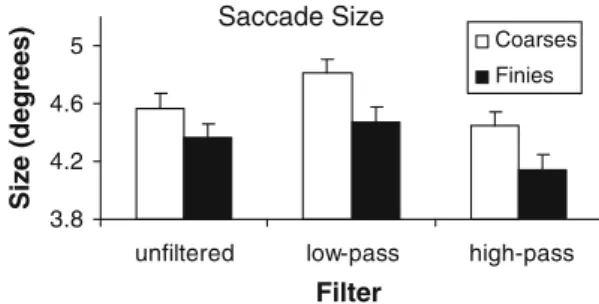
Figure5 shows the average size of saccades dependent on the type of Wltering (unWltered, low-pass Wltered, and high-pass Wltered), and on the spatial frequency content of
the images. The images with high power in low-spatial fre-quencies, the “coarsies”, elicited longer saccades than the “Wnies”, the images with high power in high spatial fre-quencies. Filtering had the same eVect in both groups of images. Low-pass Wltering led to larger saccades than high-pass Wltering. This conWrms the results of Experiment 1. The mean saccadic size evoked by the unWltered images lies in between.
In Fig.6 the mean Wxation durations are represented for the two experimental factors. Images with high power in high spatial frequencies, the “Wnies”, evoked larger Wxation durations than the “coarsies”. Filtering had no eVect when Fig. 4 Four examples of stimuli
in Experiment 2. In the Wrst two rows are two examples of imag-es with high power in low spatial frequencies, so-called “coar-sies”; in the bottom two rows two examples of high power in high spatial frequencies, so-called “Wnies”. The unWltered images are presented on the
left-hand column, the low-pass
Wltered images in the middle column, and the high-pass Wltered images in the
the images were coarse. With the Wne images, high-pass Wltering produced longer Wxations than no Wltering or low-pass Wltering. This partly replicates the results of Experi-ment 1.
General discussion
Presumably three major factors play a role in the control of saccadic eye movements: perceptual knowledge about objects, strategies of information-seeking that are depen-dent on the task the visual system has to perform, and spa-tial features of the image. In our experiments we focused on the third factor and chose an experimental situation where the Wrst two are supposed to be of minor importance. Both experiments in which participants inspected pictures of tex-tures for 10 s in order to Wnd a suitable name showed that characteristics of eye movements changed with the spatial frequency content of the images.
Low-pass Wltered images increased the average saccadic sizes as compared to unWltered or high-pass Wltered images. The same result was found with respect to the spatial fre-quency content of unWltered images. Images with high power in low-spatial frequencies led to larger saccades in the average than images with high power in high spatial fre-quencies. The spatial frequency content of the images showed also an eVect on the average Wxation duration. The
longest mean Wxation duration was found for high-pass Wltered images with high power in high spatial frequencies, the shortest for unWltered images with high power in low spatial frequencies. Mannan, Ruddock, and Wooding (1995) who had done similar experiments, found just the opposite: low-pass and high-pass Wltered images evoked shorter saccades than unWltered images, and Wxation dura-tion was longest with low-pass Wltered images. One can only speculate about the reasons for the disagreement between these Wndings. The Wltering of the images was diVerent in both studies. However, this cannot account for the diVerence in results because we found the same eVects in unWltered images which just diVered in spatial frequency content.
There was also a diVerence in the time that was available for participants to inspect the images, but again, it cannot explain the disagreement between the two studies because, essentially, we got the same results when we analysed just the Wrst 3 s of our inspection intervals. It is more likely that the reason lies in the diVerent tasks and material that led to diVerent strategies for picking up information in the images. Participants in the study of Mannan et al. (1995) had to identify natural scenes with well-known objects whereas our participants had to Wnd suitable titles for pic-tures of natural texpic-tures. A similar inXuence of stimulus material shows up in the study by Parkhurst et al. (2002). Stimulus features of fractal images made better predictions of Wxation locations than stimulus features of natural scenes. The authors assume that the inXuence of top-down strategies is greater when scenes with well-known objects are observed.
The eVect of diVerent tasks has already been demon-strated in a study by Groner and Menz (1985). In a factorial experimental design, the inXuence of stimulus properties, tasks and individual diVerences between participants was investigated. With respect to saccadic size, there was a strong statistical interaction between tasks and participants. All participants showed shorter saccadic sizes in a visual search task, but with respect to the two other tasks (free inspection versus concept identiWcation) the participants diVered systematically from each other in their respective saccadic sizes.
The inXuence of the power spectra of the stimuli on eye movement parameters in our experiments suggests that the guidance of Wxations was mainly stimulus-driven. High power in low spatial frequency bands led to greater saccade size. High power in high spatial frequency bands produced smaller saccade size. This eVect was increased by taking bands of spatial frequencies out of the images. Given a cer-tain Wxation location, the planning of the next location depends on the information the visual system can get out of the peripheral parts of the visual Weld. The sensitivity for high spatial frequencies decreases with eccentricity. If there Fig. 5 Mean saccadic amplitudes for the unWltered, the low-pass
Wltered, and the high-pass Wltered images, separately for the “Wnies” and the “coarsies” textures
Saccade Size
3.8 4.2 4.6 5
unfiltered low-pass high-pass
Filter
Size (degrees)
Coarses Finies
Fig. 6 Mean duration of Wxation for the unWltered, the low-pass Wltered, and the high-pass Wltered images, separately for the “Wnies” and the “coarsies” textures
Fixation Duration
320 360 400 440
unfiltered low-pass high-pass
Filter Du ra ti o n ( m s ) Coarses Finies
is high power in low spatial frequency bands or only low spatial frequencies are left in the image the visual system can analyse information further out in the peripheral visual Weld, thus enabling greater saccades to be made.
Acknowledgment We gratefully remember the many discussions with Dieter Heller in which he added his perspective, often resulting in a deeper understanding of the visual and cognitive processes under study. After his untimely death, we miss him strongly as a unique friend and colleague. This article is dedicated to his memory. This re-search was supported by grants of the Swiss National Science Founda-tion. Correspondence concerning this article should be addressed to: Marina Groner, Department of Psychology, University of Bern, CH-3000 Bern 9, Switzerland (e-mail: [email protected]).
References
Andrews, T. J., & Coppola, D. M. (1999). Idiosyncratic characteristics of saccadic eye movements when viewing diVerent visual envi-ronments. Vision Research, 39, 2947–2953.
Becker, W. R., & Jürgens, R. (1979). An analysis of the saccadic eye movement system by means of double step stimuli. Vision
Research, 19, 967–983.
Breitmeyer, B. G. (1975). Simple reaction time as a measure of the temporal response properties of the transient and sustained chan-nels. Vision Research, 15, 1411–1412.
Buswell, G. (1935). How people look at pictures. A study of the
psy-chology of perception in art. Chicago: University of Chicago
Press.
Deubel, H., & Elsner, T. (1986). Threshold perception and saccadic eye movements. Biological Cybernetics, 54, 351–358.
Di Lollo, V., & Woods, E. (1981). Duration of visible persistence in relation to range of spatial frequencies. Journal of Experimental
Psychology: Human Perception and Performance, 7, 754–769.
Findlay, J. M. (1982). Global processing for saccadic eye movements.
Vision Research, 22, 1033–1045.
Groner, R., & Menz C. (1985) The eVects of stimulus characteristics, task requirements and individual diVerences on scanning patterns. In R. Groner, G. W. McConkie & C. Menz (Eds.), Eye movements
and human information processing (pp. 239–250). Amsterdam:
North Holland.
Heller, D., & Müller, H. (1983). On the relationship between saccadic size and Wxation duration in reading. In R. Groner, C. Menz, D. F. Fisher & R. A. Monty (Eds.), Eye movements and psychological
functions: International views (pp. 287–302). Hillsdale:
Lawrence Erlbaum.
Henderson, J. M., & Hollingworth, A. (1998). Eye movements during scene viewing: An overview. In G. Underwood (Ed.), Eye
guid-ance in reading and scene perception (pp. 269–293). Amsterdam:
Elsevier.
Henderson, J. M., Weeks, P. A., Jr., & Hollingworth, A. (1999). EVects of semantic consistency on eye movements during scene viewing.
Journal of Experimental Psychology: Human Perception and Performance, 25, 210–228.
Itti, L., & Koch, C. (2000). A saliency-based search mechanism for overt and covert shifts of visual attention. Vision Research, 40, 1489–1506.
Krieger, G., Rentschler, I., Hauske, G., Schill, K., & Zetzsche, C. (2000). Object and scene analysis by saccadic eye-movements: An investi-gation with higher-order statistics. Spatial Vision, 13, 201–214. Land, M. F., & Hayhoe, M. (2001). In what ways do eye movements
contribute to everyday activities? Vision Research, 41, 3559– 3565.
Lupp, U., Hauske, G., & Wolf, W. (1976). Perceptual latencies to sinu-soidal gratings. Vision Research, 16, 969–972.
Mannan, S., Ruddock, K. H., & Wooding, D. S. (1995). Automatic control of saccadic eye-movements made in visual inspection of brieXy presented 2-D images. Spatial Vision, 9, 363–385. Mannan, S. K., Ruddock, K. H., & Wooding, D. S. (1996). The
rela-tionship between the locations of spatial features and those of Wx-ations made during visual examination of brieXy presented images. Spatial Vision, 10, 165–188.
Mannan, S. K., Ruddock, K. H., & Wooding, D. S. (1997). Fixation patterns made during brief examination of two-dimensional imag-es. Perception, 26, 1059–1072.
Menz, C., & Groner, R. (1986) Saccadic programming with multiple targets under diVerent task conditions. In K. O’Regan & A. Levy-Schoen (Eds.), Eye movements: From physiology to cognition (pp. 95–103). Amsterdam: Elsevier/North-Holland.
Parkhurst, D. J., & Niebur, E. (2003). Scene content selected by active vision. Spatial Vision, 16, 125–154.
Parkhurst, D., Law, K., & Niebur, E. (2002). Modeling the role of sa-lience in the allocation of overt visual attention. Vision Research,
42, 107–123.
Peterzell, D. H., & Teller, D. Y. (1996). Individual diVerences in con-trast sensitivity functions: The lowest spatial frequency channels.
Vision Research, 36, 3077–3085.
Salthouse, T. A., & Ellis, C. L. (1980). Determinants of eye-Wxation duration. American Journal of Psychology, 93, 207–234. Tatler, B. W., Baddeley, R. J., & Gilchrist, I. D. (2005). Visual
corre-lates of Wxation selection: EVects of scale and time. Vision
Research, 45, 643–659.
Turano, K. A., Geruschat, D. R., & Baker, F. H. (2003). Oculomotor strategies for the direction of gaze tested with a real-world activ-ity. Vision Research, 43, 333–346.
Walther-Müller, P. U. (1993). Zur Messung von Augenbewegungen: Beschreibung der Software zur Analyse von Augenbewegungsda-ten. Research Report 1993-3, Department of Psychology, Univer-sity of Bern.
Wilson, H. R., & Bergen, J. R. (1979). A four mechanism model for threshold spatial vision. Vision Research, 19, 19–32.
Yarbus, L. (1967). Eye movements and vision. New York: Plenum Press.