Ph.D Thesis
Corporate Governance Issues and Performance of
Initial Public Offerings
Author:
Biljana Seistrajkova
Thesis Committee:
Prof. Eric Nowak - Swiss Finance Institute, Università della Svizzera Italiana Prof. François Degeorge - Swiss Finance Institute, Università della Svizzera Italiana Prof. Michel Habib - Swiss Finance Institute, University of Zürich UZH
A thesis submitted in fulfillment of the requirements for the degree of Ph.D in Finance at the
Swiss Finance Institute - Università della Svizzera Italiana - Faculty of Economics
Summary
In my PhD thesis I analyze corporate governance issues of initial public offerings and their subsequent performance. The thesis consists of three chapters: Chapter 1 “Managerial Incentive Explanation of Equity Carve-outs Initial Returns”, Chapter 2 “Are Incentive Stock Options Signaling Better Corporate Governance? - An Evidence from Equity Carve-outs” and Chapter 3 “Short Selling and the Subsequent Performance of Initial Public Offerings”.
In the first two chapters of the thesis I focus on one type of initial public offerings called equity carve-outs and earnings management behavior of the managers as a com-mon principal-agent problem at the IPOs. An equity carve-out is a type of corporate reorganization in which a conglomerate is selling one of its divisions to the public. As a part of the reorganization the division (middle-level) managers become CEOs of a pub-licly listed company. Compensation contracts of the subsidiary managers are revised in order to incorporate subsidiary share prices and profits as measure of performance. New contracts are becoming more efficient. Often incentive stock options granted on the IPO date are part of the revised contracts. Those options usually have an exercise (strike) price equal to the IPO offer price (IPO options in the rest of the text) with payoff equal to max (0, St - Offer Price). I hypothesize that subsidiary managers who received such incentive stock options don’t have an incentive to push up the offering price of the IPO because it will decrease their future payoff. At the other side, subsidiary managers who don’t have IPO options (have only shares) in their new contracts have an incentive to window dress the company before going public by using more aggressive accounting techniques in order to pump-up the performance around the IPO.
The core of my data set in both chapters is a hand-collected information about incentive stock option grants to division managers on the IPO date (IPO options) from the prospectuses of the initial public offerings (filing type S-1 in EDGAR database) .
When this information was not available in the prospectuses then I hand-collected it from the proxy statements (filing type DEF 14A in EDGAR database) in the year of the IPO.
Chapter 1 “Managerial Incentive Explanation of Equity Carve-outs Initial
Returns” examines the hypothesis that managers select accruals at the time around
the IPO opportunistically depending on their compensation packages. In this chapter the focus is on the first-day return of the carve-outs and I show that it is explained by the reporting distortions in the pre-IPO period, conditioned on whether the executives and directors of the subsidiary received IPO options (with exercise price is equal to the IPO offer price).
In absence of IPO options, accruals in the year before the issue are negative predic-tors in the cross-sectional variation of the first-day returns. In presence of IPO options this relationship is reversed and becomes positive: this is especially pronounced in cases where non-employee directors received such compensation packages.
I find that managers incentivized by IPO options are using less aggressive accounting techniques in the years around the IPO. Their reported earnings are more realistic compared to the other subsample of managers that did not receive such option grants. I conclude that incentive stock options are good governance mechanism to decrease opportunistic reporting by the managers in the years around the IPO.
The predictive power of the accruals on future returns and its direction differ depend-ing on the executive compensation packages, suggestdepend-ing that management intentionally manipulate earnings.
This finding contribute to the vast literature of earnings management. I show that predictive power of accruals differs depending on the executives compensation packages. This is an indirect proof that earnings are managed intentionally by the management. Accruals as a measure of earnings management and as predictor of future returns should be seen trough lens of the executives and how they are incentivized. My findings are potentially useful for investors and regulators. Investors are concerned about whether they are trading at the fair initial price and at which direction earnings management affects the short-term return. Accounting and financial regulators must be concerned about the informativeness of the accounting numbers and how accurately accounting information communicates firm performance to capital markets.
Chapter 2 “Are Incentive Stock Options Signaling Better Corporate
Gov-ernance? - An Evidence from Equity Carve-outs” focuses on the long-run
stock options on the IPO date. Carve-outs that did not grant incentive stock options subsequently underperform both relative to the overall market and relative to a sample of carve-outs that granted stock options. The stock returns are robust to alternative specifications of abnormal returns.
In particular, I consider the returns to a zero-investment strategy which takes a long position in the stock of equity carve-outs that granted IPO options and short position in carve-outs that did not grant IPO options. I show that the alpha of following this strategy for three years (using value-weighted or equal-wighted returns) is positive in a four factor time-series return regression.
Further, I show that accruals in years around the IPO explain the cross-sectional variation of the long-run stock market and accounting underperformance. Contrarily, carve-outs that grant incentive stock options to their executives at the IPO date do not underperform appropriate benchmarks over three-year period following the IPO and use less aggressive accounting around the IPO.
The result in this chapter points out that incentive stock options are signaling better corporate governance to the market that result in better long-run stock market and accounting performance. There is distortion in behavior induced by the compensation packages of the executives and it does affect ultimate firm performance. Incentive stock options are good governance mechanism to decrease opportunistic reporting by the managers in the years around the IPO resulting in better long-run stock market and accounting performance.
This findings are potentially useful for investors and regulators. Investors may want to use the information on IPO options that is public before the IPO to discriminate among issuers. Particularly, this information is very useful because for most of the investors it is difficult to detect earnings management i.e. which part of the accruals are “normal” or unusually high for a given company given the business conditions. IPO options by it self should signal them less managed earnings i.e. better corporate governance. Finally, regulators must be concerned about the informativeness of the accounting numbers and how accurately accounting information communicates firm performance to the markets.
Chapter 3 “Short Selling and the Subsequent Performance of Initial
Pub-lic Offerings” examines short sale volume on the offer day of initial public offerings
and their subsequent performance. IPOs are major corporate events surrounded by much noise and pricing inefficiencies. I find it interesting to know whether short sellers posses superior information about the fundamentals of IPOs relative to other investors.
Up to my knowledge my paper is a first attempt to measure long-run performance of IPOs conditioned on short selling activity on the first trading day. The tests provide evidence of informed trading immediately at the IPO.
The main finding is that short sellers are well informed about the fundamental value of IPOs. Heavily-shorted IPOs on the offer day underperform both relative to the lightly-shorted IPOs and relative to the overall market in one-year window. On risk-adjusted basis when using calendar time-series portfolio approach, heavily-shorted IPOs on the offer day underperform lightly-shorted IPOs by an average of 9 basis points daily (22.68% annualized return) and 1.72% monthly average (20.64% annualized return). The stock returns are also robust to alternative specifications of abnormal returns (CARs and BHARs).
When using accounting measures such as net income, earnings per share and ROA I find that accounting performance declines significantly in the quarter after the IPO for companies that were shorted the most on the first trading day.
To support the main finding of this chapter I show that short sellers are sophisticate investors that possess information of the fundamentals of IPOs at least as informative as the analysts. Heavily-shorted IPOs get the least favorable initiation of analysts’ recommendations that occur on average 28 trading days after the offer day in my sample. Further, I show that heavily-shorted IPOs have the highest predicted probability for downgrade by the analysts within the first year after the IPO.
I explore which types of IPOs are subject to more short selling on the offer day. I provide evidence that short sellers are picking hot issues with high demand and high first-day return. Heavily-shorted IPOs are overpriced on the end of the first-trading day on average by 35% relative to their industry peers. Short sellers go against the sentiment of the individual investors for hot issues. This result indicates that short sellers are more sophisticated than the other investors and go against the behavioral biases such as overoptimism that surrounds hot issues in order to make profit on longer run.
Overall the results indicate that, on average, short sellers are sophisticated investors that are well informed regarding the fundamental value of IPOs and important contrib-utors to efficient stock prices. The finding should encourage regulators to provide more timely disclosure of short selling to all investors.
Acknowledgements
While writing this thesis, I was lucky to have support from a number of people. First, I want to thank my advisor Eric Nowak for his support during the whole period of the PhD program. After I completed the master at USI, Eric Nowak invited me to pursue with the doctoral studies under his supervision. I am grateful that he believed in my capabilities and gave me this opportunity. Without him this thesis would not exist.
I am really grateful to François Degeorge for his comments, advices and impressive lectures that opened to me new perspective of the world of corporate finance.
I would like to thank Michel Habib for agreeing to serve as external member of my committee and for his useful comments, availability and kindness.
I want to thank all the PhD students at the Institute of Finance for making this journey more enjoyable: Alessio, Andrea, Carlo, Chiara, Davide, Efe, Elisa, Fabrizio, Federica, Filippo, Gianpaolo, Giuseppe, Ilaria, Jovan, Julia, Mirela, Sofia, Tamara, Virginia, Umit, Wojciech. Specially, I would like to thank Alxander Eisele for the ideas and comments on my research topics, Mirco Rubin for being a grate office made and for helping me with econometric problems and Mihaela Sandulescu, Cecilia Aquila and Zoran Filipovic for being my close friends.
I dedicate my thesis to the people I love and who supported me all my life. First of all, this is for my beloved husband Viktor and our children Boris and Anna. I thank Viktor for loving me and supporting me for more than twenty years. He encouraged me in difficult times when I had doubts that I will not be able to come to the end of this work. I use this opportunity to thank my older child Boris for being a grate child that every parent would wish for and for understanding when I missed some of the weekends, school events and basketball tournaments. I thank God for blessing me with Anna at the end of this work. She brought additional joy to our lifes and motivated me to finish this thesis. I also dedicate my thesis to my amazing parents and my sister. Their support and encouragement trough my whole life brougth me to this point.
Contents
Summary iii
Acknowledgements vii
Table of Contents viii
List of Figures xi
List of Tables xii
1
Managerial Incentives Explanation of Equity
Carve-outs Initial Returns
11.1 Introduction . . . 2
1.2 Carve-outs underpricing and earnings management conditioned on man-agerial incentives . . . 7
1.3 Sample selection, data description, variables definition and empirical methodology . . . 12
1.3.1 Sample selection and data description . . . 12
1.3.2 Variables definition . . . 16
1.3.2.1 Stock option grants . . . 16
1.3.2.2 Measures of initial pricing . . . 16
1.3.2.3 Measures of earnings management (accruals) . . . 19
1.3.2.4 Other variables . . . 21
1.4 Results . . . 22
1.4.1 First-day return and earnings management . . . 22
1.4.2 Decomposition of the first-day return . . . 31
1.4.2.1 Instrumental variable estimation . . . 34
1.5.1 Initial Return . . . 37
1.5.2 Matching procedure . . . 40
1.6 Conclusion . . . 47
2
Are Incentive Stock Options Signaling Better
Cor-porate Governance? - An Evidence from Equity
Carve-outs
50 2.1 Introduction . . . 512.2 Data . . . 54
2.3 Long-run Performance Conditioned on IPO Options . . . 59
2.3.1 Stock Market Performance . . . 59
2.3.1.1 Cumulative Abnormal Stock Returns . . . 59
2.3.1.2 Calendar Time-Series Portfolios Approach . . . 60
2.3.1.3 Buy-and-Hold Abnormal Returns (BHAR) . . . 64
2.3.2 Accounting Performance . . . 66
2.3.2.1 Return on Assets . . . 66
2.4 Earnings Management and Long-run Performance . . . 70
2.4.1 Cross-Section of Stock Market Returns and Earnings Management 74 2.4.2 Cross-Section of Accounting Returns and Earnings Management 74 2.5 Conclusion . . . 77
3
Short Selling and the Subsequent Performance of
Initial Public Offerings
81 3.1 Introduction . . . 823.2 Data and Summary Statistics . . . 86
3.3 Long-Run Stock Market Performance of IPOs Conditioned on Short Sell-ing Activity on the Offer Day . . . 90
3.3.1 Calendar Time-Series Portfolios Approach . . . 90
3.3.2 Cumulative Abnormal Stock Returns . . . 93
3.3.3 Buy-and-Hold Abnormal Returns (BHAR) . . . 98
3.3.3.1 Cross-section of Abnormal Returns on Short Sale Volume101 3.4 Accounting Performance of IPOs Conditioned on Short Selling Activity on the Offer Day . . . 101
3.5 Consensus Analysts’ Recommendations and Short Selling Activity of IPOs105 3.6 Short Selling Volume on the Offer Day and IPO Characteristics . . . . 109
3.6.1 First-Day Return and Short Selling Volume . . . 113 3.7 Conclusion . . . 118
List of Figures
1.1 Mean of accruals conditioned on IPO options grants . . . 11
1.2 Effect of total BS accruals(t 1) on first-day return conditioned on IPO options . . . 28
2.1 Stock Market Performance . . . 61
2.2 Accounting Performance: Return on Assets . . . 69
2.3 Mean of Accruals in Event Time Conditioned on IPO Options . . . 73
List of Tables
1.1 Summary sample characteristics . . . 14
1.2 Characteristics of the carve-outs and matching firms . . . 15
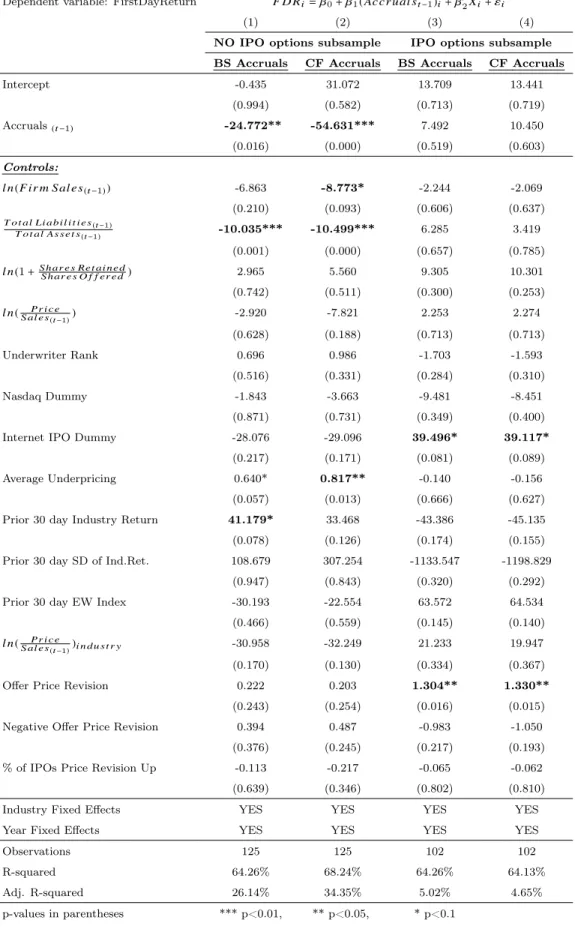
1.3 Cross-sectional regressions of FDR on accruals conditioned on IPO options 24 1.4 Cross-sectional regression of the FDR on director’s IPO option grants . 26 1.5 Subsample regressions of first-day return on accruals . . . 29
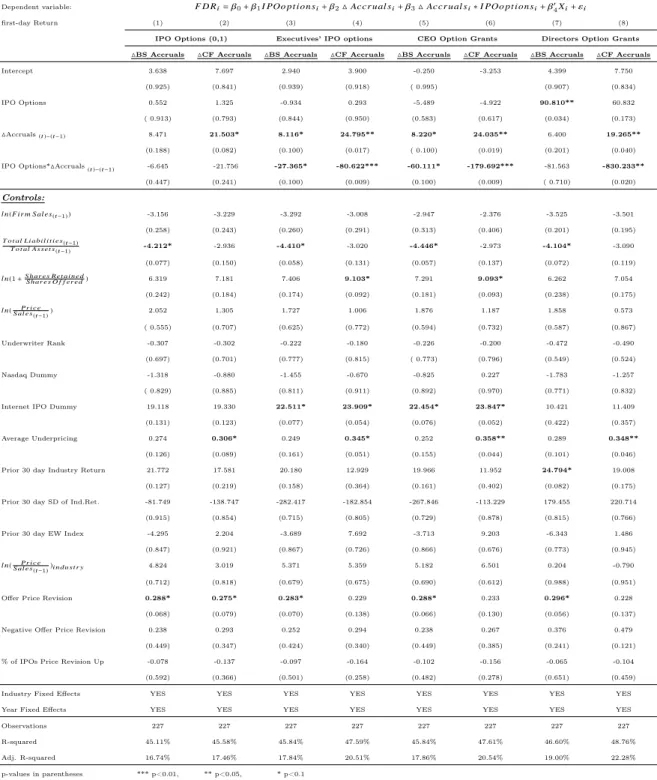
1.6 Cross-sectional regressions of FDR on changes of accruals conditioned on IPO options . . . 30
1.7 Summary statistics of the decomposed first-day return . . . 32
1.8 Regressions of the components of the first-day return on accruals condi-tioned on IPO options . . . 35
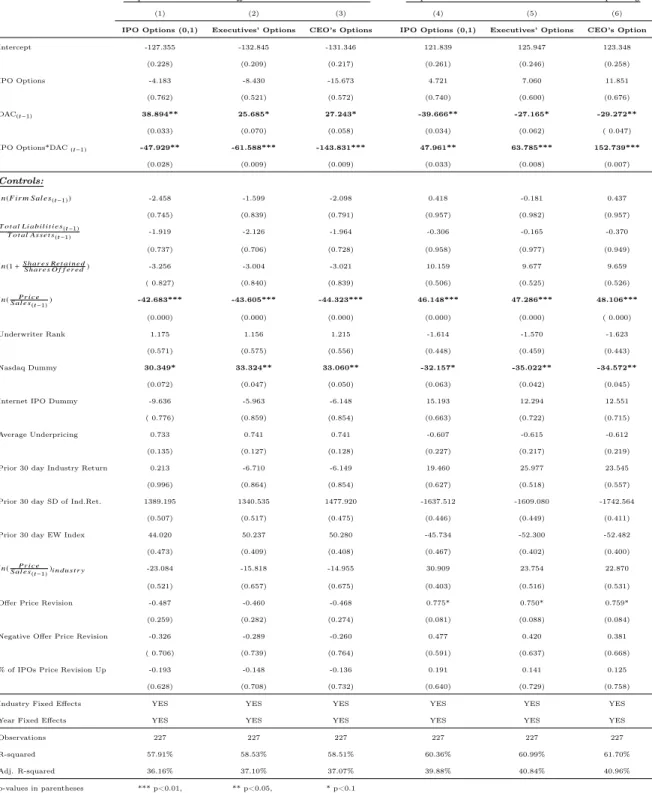
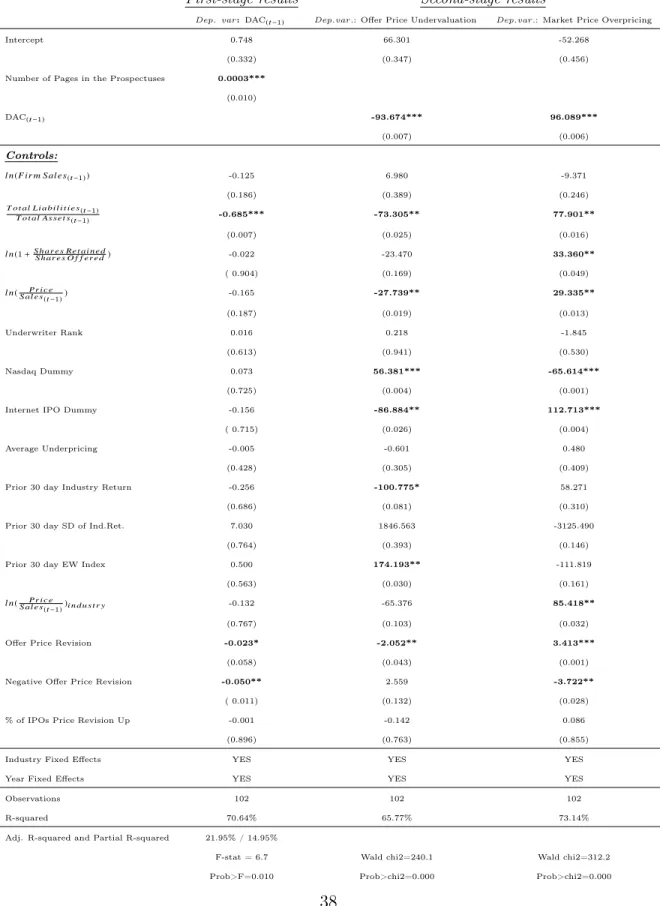
1.9 Two-stage least-squares regressions explaining offer price undervaluation and market price overpricing for the subsample of companies that granted IPO options . . . 38
1.10 Cross-sectional regressions of the initial return (2nd day market price) 39 1.11 Cross-sectional regressions of the initial return (7th day market price) 41 1.12 Regressions of the market price overpricing computed with alternative market prices . . . 42
1.13 Characteristics of the carve-outs and their best match . . . 44
1.14 Summary statistics of the decomposed first-day return under different matching criteria (using single match) . . . 45
1.15 Regressions of the components of the first-day return under different matching procedure (using single match) . . . 46
2.1 Summary Sample Statistics . . . 58
2.2 Cumulative Abnormal Return (Market Model) . . . 62
2.3 Cumulative Abnormal Return (Four-Factor Model) . . . 63
2.5 Buy-and-Hold Returns Using Value-Weighted Daily Returns . . . 67
2.6 Buy-and-Hold Returns Using Equally-Weighted Daily Returns . . . 68
2.7 Accounting Performance . . . 71
2.8 Cross-section of BHAR on Lagged Accruals (Using Daily Returns) . . . 75
2.9 Cross-section of BHAR on Lagged Accruals (Using Monthly Returns) . 76
2.10 Cross-Section of ROA on Change in Accruals (Between IPO Year and
pre-IPO Year) . . . 78
3.1 Summary Statistics . . . 88
3.2 Long-Term Performance Using Daily Returns of IPOs with Smallest Short Sales Volume vs. IPOs with Highest Short Sales Volume on the
First Trading Day . . . 91
3.3 Long-Term Performance Using Monthly Returns of IPOs with Smallest Short Sales Volume vs. IPOs with Highest Short Sales Volume on the
First Trading Day . . . 92
3.4 Cumulative Abnormal Return (Market Model) to Short Sale Volume . . 95
3.5 Cumulative Abnormal Return (Four-Factor Model) to Short Sale Volume 96
3.6 Buy-and-Hold Returns Using Value-Weighted Daily Returns . . . 99
3.7 Buy-and-Hold Returns Using Value-Weighted Monthly Returns . . . . 100 3.8 Cross-section of Abnormal Returns on Short Sale Volume . . . 102 3.9 Accounting Performance . . . 104 3.10 Cross-section of Mean Analysts Recommendation on Short Sale Volume 107 3.11 Probit Model of Analysts’ Downgrades on Short Sale Volume Quartiles 110 3.12 Cross-section of Short Sale Volume on IPO Characteristics . . . 112 3.13 Decomposition of the First-Day Return . . . 115 3.14 Cross-section of Short Sale Volume on Decomposed First-Day Return . 117
На Моето Семеjство
To My Family
Chapter 1
Managerial Incentives Explanation of Equity
Carve-outs Initial Returns
Abstract
This paper studies the first-day return of 227 carve-outs during 1996-2013. I find that the first-day return of newly issued subsidiary stocks is explained by the reporting dis-tortions in the pre-IPO period, conditioned on whether the executives and directors of the subsidiary received stock options with an exercise price equal to the IPO offer price. In absence of IPO options, accruals in the year before the issue are negative predictors in the cross-sectional variation of the first-day returns. In presence of IPO options this relationship is reversed and becomes positive: this is especially pronounced in cases where non-employee directors received such compensation packages. The predictive power of the accruals on future returns and its direction differ depending on the ex-ecutive compensation packages, suggesting that management intentionally manipulate earnings.
JEL classifications: M41; G24; G32; G34; J33
Keywords: Earnings management; Initial public offerings; IPO underpricing; Equity carve-outs; Executive compensation; Stock options
1.1 Introduction
This paper investigates the first-day return of a sample of 227 equity carve-outs dur-ing 1996-2013 with an aggregate proceeds of $69 billion that represents 11.7% of the total IPO market (Ritter (2013) reported $591.8 billion of aggregate proceeds for the same period). It shows that when a conglomerate sells one of its devision to the pub-lic (carve-out), division managers of the newly issued subsidiary are choosing differ-ent income-increasing accounting policies depending on their compensation packages. These policies influence the initial performance of the new company. In a very specific environment when executives and directors of the subsidiary receive stock options with an exercise price equal to the IPO offer price (IPO options in the rest of the paper) I show that predictive power of accruals (measure of earnings management) on the initial return is decreasing and for higher compensation packages it reverses i.e. the relationship becomes positive. The offer price of these companies is set close to their industry peers, as well as their initial secondary market stock price. The paper shows that in this setting incentive stock options are good governance mechanism to decrease opportunistic reporting by the managers in the years around the IPO. Furthermore, this paper rise a red flag that accruals as predictors of magnitude and direction of the future returns should be seen conditioned on the executives’ incentives suggesting that earnings are managed intentionally by the management.
Equity carve-outs are special class of IPOs where a company decides to sell a portion of one of its wholly owned subsidiary to the public. It is expected that those kind of IPOs have same stylized fact (anomalies) as all other IPOs: initial underpricing con-firmed by several studies (McDonald and Fisher (1972); Logue (1973); Ibbotson (1975); Ritter (1984); Rock (1986); Ibbotson and Ritter (1988); Loughran and Ritter (2002); Ritter and Welch (2002); among others) and long-run underperformance confirmed by: Stern and Bornstein (1985); Ritter (1991); Loughran and Ritter (1995). However, Vijh (1999) shows that newly issued subsidiary stocks beat appropriate benchmarks over a three-year period following the carveout. This result is in striking contrast with the doc-umented poor long-run performance of initial public offerings. Positive market reaction to an announcement of equity carve-outs is noted by Schipper and Smith (1986), while market reaction for SEOs announcement is negative. They offer a set of reasons based on divestiture gains, and one of them is designing more efficient compensation contracts for the subsidiary’s managers. Vijh (2002) continues their work confirming that market reacts positively to an equity carve-outs and furthermore his results support the
di-vestiture gains hypothesis of carve-outs discriminating asymmetric information model proposed by Nanda (1991).
These findings lead to a conclusion that equity carve-outs have special features among IPOs that distinguishes them from standard IPOs. To the best of my knowl-edge, initial underpricing of equity carve-outs is rarely present in the literature. Only Benveniste (2008) finds that the subsidiary’s first-day return is significantly related to its parent’s return over the book-building period, but not related to its contemporane-ous return. I find that the average first-day return in my sample of carve-outs is 17.99% that is significantly lower than the 21.6% average first-day return of 5402 IPOs during
1990-20131 (information available on Jay Ritter’s web site).2 Aggregate money left on
the table in my sample of equity carve-outs is $9.3 billion. Ritter (1991) concludes that investors are periodically overoptimistic about the earnings potential of new issues.
My paper explores a possible sources for less optimism noted around equity carve-outs issues. According to the earnings management explanation of IPO anomalies issuing firms report high earnings around the IPO by reporting abnormal accruals aggressively, inflating the earnings. The stock market temporarily overvalues those firms. Teoh and Wong (1998) provide evidence that in standard IPOs issuers with unusually high accruals in the IPO year experience poor stock return performance in the three years thereafter.
Earnings reported in the financial statements (income statement) of each public company consist of cash flows from operations and accounting adjustments called ac-cruals. The simplest way to think about the accruals is that they are difference between earnings and cash flows. When this amount is positive for example, it can be a sign (not necessarily) of artificially inflated earnings by use of “creative” legal accounting tech-niques. Managers have certain legal discretion over the accruals. On shorter run they can increase the accruals (leading to increased earnings), for example, by recognition of revenues earned on credit (before cash is received), delaying recognition of expenses (cash paid in advance), realizing unusual gains, decelerating depreciation. On longer run all of these accounting adjustments will be reversed resulting in lower earnings. Earnings management is certainly a sign of bad corporate governance. The bottom line is that accounting accruals are negative predictors of the future performance: so-called
1The first-day return is even higher if I exclude the period from 1990 until 1995 in order to
corre-spond to my sample period of equity carve-outs.
2I thank Professor Ritter for making these data publicly available. See
investor fixation on earnings theory documented by Sloan (1996).
In order to be able to do the manipulation companies may create earnings reserves in pre-IPO period by using more conservative accounting techniques and report negative accruals (by postponing the sales or accelerating the depreciation for example). They report lower earnings than cash flows. This allow them to boost the earnings in the year of the IPO. The bottom line is that accounting accruals in pre-IPO year can predict the cross-sectional variation of the first-day return and due to the reversal of the accruals that inflate the earnings in the IPO year this relationship is negative. Up to this point the evidence doesn’t prove that managers intentionally are adjusting accruals to exploit market credulity.
In order to disentangle and find evidence that earnings are managed intentionally by the management I use the unique environment surrounding the equity carve-outs. Schipper and Smith (1986) argue that carve-outs are associated with a restructuring of managers’ responsibilities and incentives. Furthermore the incentive contracts of subsidiary managers are revised to incorporate subsidiary share prices and profits as measure of performance. Afterwords Aron (1991) points out that after the carveout the stock value of the subsidiary firm is a cleaner measure of managerial productivity. She shows that a stock-based compensation plan motivates the managers of the carved out subsidiary to work harder and better exploit investment opportunities. My research question is whether incentive stock options are a good governance mechanism to de-crease opportunistic reporting by the managers. It turns out that they are, particularly in years around the IPO.
Following Lowry and Murphy (2007) I split the sample in two groups, companies that grant stock options to the top executives (ex-division managers) with an exercise price set equal to the offer price (I will use the name “IPO options” in future) and companies that do not incentivize their top management in such way. Forty-five percent of the sample (i.e. 102 companies out of 227) granted IPO options to the top management. Lowry and Murphy (2007) look at all IPOs and their hypothesis is that if executives can influence the IPO offer price there should be a positive relationship between IPO option grants and underpricing. They do not find evidence of a such relationship. In standard IPOs there are two sides of the incentives story of the executives that are in striking contrast: executives who receive IPO options will benefit from higher underpricing (lower offer price relative to the aftermarket price), but at the same time they will lose from underpricing if they hold shares or options granted before the IPO due to the dilution when shares are sold below the market price. In case of equity carve-outs
IPO options give unique one-side incentive to executives to push down the offer price because their pre-IPO holdings remain in the conglomerate (not in the newly carved out subsidiary) and they will lose less from the dilution of their previous holdings.
I predict that companies that grant options will have lower first-day return (un-derpricing). Executives cannot exercise their options immediately on the day of the issue, so they cannot profit from short-term performance of the company. More than 92% of the executives in the sample can exercise partially their options one year after the issue and then gradually with different annual percentages (with range from 10% to 50%) in the years that follows. The findings of the paper are in the line with the finding of Bergstresser and Philippon (2006) who show that during years of high ac-cruals, CEOs exercise unusually large amounts of options. Executives of the carved out companies are not allowed to exercise their IPO options around the IPO, so I pre-dict lower accruals around the IPO. Furthermore top management of newly carved out subsidiary typically comes from former division management of the parent company. As mid-level executives in the parent companies (having in mind underwriters, insti-tutional investors and parent top executives), it is unlikely that they can influence the offer price. However, they could search for a possibility to decrease the investors’ op-timism trough less aggressive accounting (lower accruals leading to lower earnings) in the years around the IPO compared to the managers that did not receive IPO options. I do not find reversal of accruals in the IPO year for companies that grant IPO options to their executives, while for companies that did not grant IPO options I find reversal of the negative accruals in the pre-IPO period to the IPO year as a sign for earnings management (consistent with Sloan (1996)’s pattern). In absence of IPO options I find that accruals in the year before the issue negatively predict the first-day return. While in presence of IPO options this relationship is reversed and becomes positive.
The first-day return is a function of both: i) the first-day market price (driven by an individual investor) and ii) the offer price (driven by underwriters, parent company and institutional investors that are more informed compared to an individual investor). I find that carved out companies that grant IPO options on average experience less underpricing (16.27%) than companies that did not grant such options (19.39%). I interpret the smaller underpricing as a function of less managed earnings in the years around the IPO by incentivized managers. Further I find that for these companies the initial offer price is set more closely to the price of their industry peers while for companies that did not grant options to their executives the offer price overvalues the company on average by 12% compared to their industry peers. This finding is in the line
with the finding of Purnanandam and Swaminathan (2004) that the median IPO was significantly overvalued relative to industry peers. Contemporaneously, due to more realistic reported earnings, the market optimism decreases towards the companies that grant IPO options resulting in lower initial market price and lower first-day return.
In this unique setting of one-side incentive, I conclude that options, as part of compensation packages, play their main role i.e. aligning the interest of agents and investors. In this special case of IPOs interests are aligned with the parent as well. Parent usually retains the control in the carved out subsidiary. Average shares retained by the parent in the sample is 70%. Zingales (1995) shows that first selling a portion of the firm’s shares to the individual investors and then selling a controlling block to bigger more sophisticated investors maximizes the seller’s revenue. According to this finding parent company is less interested in the short-term performance of the subsidiary. Incentivized managers do not manage earnings around the IPO in order to show high short-term performance, instead they have an incentive to manage the company in such a way that the stock prices increases on longer run.
The last finding of the paper is that for companies that grant IPO options to the outside directors statistical results are strongest. I find a direct, unconditional on accruals, positive relationship between option grants to directors and the first-day return suggesting that directors might have direct influence over the offer price unlike the subsidiary managers.
The main conclusion of the paper is that incentive stock options grants are good governance mechanism to align the interests of the principals and agents in the years around the IPO. Managers of IPO options granting carve-outs are managing less the earnings in the years around the issue compared to managers of carve-outs that did not grant IPO options. The finding of this paper contributes to the literature on earnings management, initial public offerings underpricing and executives compensation adding insight on managerial incentives to manage earnings. The findings are potentially useful for investors and regulators.
The rest of the paper is organized as follows. Section 2 presents and motivates development of the main hypotheses. Section 3 describes the sample selection and data. Section 4 shows the empirical relationship between the accruals and the first-day return (and its two drivers) conditioned on IPO options grants. Section 5 provides robustness tests to support the main findings and Section 6 concludes.
1.2 Carve-outs underpricing and earnings management
conditioned on managerial incentives
A company may decide to partially sell a portion of one of its subsidiaries to the public (so called equity carve-out strategy) for several reasons: raise capital, highlight a true value of the division etc. This strategy also allows to create more efficient compensa-tion contracts for division’s managers based directly on divisional performance. Often management’s stock option plan in a carved out subsidiary is based on the offer price. Managers who receive such options benefit from a lower offer price meaning a lower exercise price of their options. An elaborate negotiation about the offer price takes place in the period before the IPO. The underwriters and the owners of the company engage in a discussion about the price at which the division’s stock should be sold to the public. Demand for the new issue formed by the institutional investors also play a role in forming the final offer price. Middle level division managers cannot directly influence the offer price. They might avoid to window dress the division by using less aggressive accounting techniques (more realistic ones) in both the pre-IPO year and at the IPO year trying to push down the offer price down as much as possible and decrease the market optimism toward the new issue. Supporting fact is that these IPO options cannot be exercised immediately at the day of issue (usually after one year these op-tions became partially exercisable). Managers who receive such opop-tions would not care much about the short-run performance of the subsidiary. This eventually decreases the usual investor’s overoptimism towards the new issues that will negatively affect the second driver of the first-day return i.e. first-day market closing price resulting in lower first-day return.
Greenblatt (2010)3 points out in his book “ You can be a stock market genius”:
“...don’t expect bullish pronouncements or presentations about a new carve-outs until a price has been established for management’s incentive stock options... Sometimes a management silence about the merits of a new carve-out may not be bad news; in some case, it can be actually golden.” I expect that these carve-outs are less “hot” issues and they will have negative mid-price revision as a result of decreased demand. I predict that these companies report more realistic earnings around the IPO. No reversal of accruals
3Joel Greenblatt is an American academic, hedge fund manager, investor, and writer. He is a value
investor, and adjunct professor at the Columbia University Graduate School of Business. Through his firm Gotham Capital, Greenblatt presided over an impressive annualized return of 40% from 1985 to 2006.
from pre-IPO period is observed in the IPO year; this leads to smaller first-day return. In contrast, carve-outs that did not incentivize their managers with IPO options care more about the short-term performance tying to increase offering proceeds and value of their holdings in the company. Degeorge and Zeckhauser (1993) point out that managers have extraordinary incentives to make their firms “shine” before floating. To use their example, consider a manager who owns 10 per cent of a firm that normally earns $1 million and that will sell at eight times earnings when it goes public. Every $1.000 increase in earnings before going public means another $800 for the manager. Then it is not surprising that managers want to present the best possible figures in their prospectuses. My predictions are that these managers who don’t own IPO options (they usually own shares) create a reserve of earnings in the pre-IPO period by using more conservative accounting techniques (income decreasing) that allow them to inflate the earnings in the IPO year by reporting positive accruals aggressively. This leads to higher first-day return i.e. negative relationship between accruals form pre-IPO period and the first-day return.
To answer my research question whether incentive stock options are good gover-nance mechanism to align the interests of shareholders and management and avoid one of the principal-agent problem i.e. earnings management I use the special environment of equity carve-outs where insiders may benefit when the company trades at more re-alistic initial price. My main hypothesis (H1) is as follows: “Carve-outs that grant incentive stock options (with exercise price equal to the offer price) to their executives do not manage earnings in the IPO period and they experience less initial underpricing compared to carve-outs that did not grant such options.” Initial underpricing (first-day return) is a function of two variables: first-day market price and offer price. Both of them influence the first-day return in different direction. To support the main hypoth-esis I additionally test two hypothhypoth-esis regarding how earnings management influences the two drivers of the initial return. The second hypothesis (H2) is that “Carve-outs that grant incentive stock options (with exercise price equal to the offer price) to their executives do not manage earnings in the IPO period and they have more realistic offer price compared to the carve-outs that did not grant such options. The second group will be overvalued (higher offer price than their industry peers) due to earnings man-agement. The third hypothesis (H3) is as follows:“Carve-outs that grant incentive stock options (with exercise price equal to the offer price) to their executives do not manage earnings in the IPO period and they experience less market overoptimism resulting in lower first-day closing price compared to the carve-outs that did not grant such options.
Predicted relationships are as follows:
• For carve-outs that did not grant IPO options to their executives reversal of accruals should be observed in the IPO year (t) as a sign for earnings management. This has two opposite effects on the first-day return. Inflated earnings in the IPO year trigger the market overoptimism and lead to a higher first-day closing price i.e. higher first-day return. On the other hand inflated earnings might bias the offer price up and have a negative impact on the first-day return. Since individual investors are less informed and more anchored to earnings compared to institutional investors and underwriters I predict that the effect on the first-day market price will be stronger than the effect on the offer price resulting in higher first-day return. The bottom line of my predictions is that the relationship between accruals in the pre-IPO year (t-1 ) and the first-day return is negative.
(H3) # accrualst 1=) " accrualst =)" f irst day closing price =)" f irst day return (H2) # accrualst 1=) " accrualst =)" o f f er price =)# f irst day return
(H1) # accrualst 1=) stronger e f f ect on the market =)" f irst day return • For carve-outs that grant IPO options to their executives no reversal of accruals
should be observed in the IPO year (t). Realistic earnings in the IPO period decrease the market overoptimism and lead to a lower first-day price compared to the other IPOs. On the other hand realistic earnings lead to more realistic offer price. Since individual investors are less informed and more anchored to earnings compared to institutional investors and underwriters I predict that the effect on the first-day market price is stronger than the effect on the offer price resulting in lower first-day return. The bottom line of my predictions is that the relationship between accruals in the pre-IPO year (t-1 ) and the first-day return will be positive for this subsample of carve-outs.
(H3) # accrualst 1⇡ accrualst =)# f irst day closing price =)# f irst day return
(H1) # accrualst 1=) stronger e f f ect on the market =)# f irst day return Consistent with the prediction, I find the following development of accruals (see Figure 1.1): for companies that did not grant IPO options there is an increase of positive accruals in the year of the IPO suggesting that these companies are inflating the earnings around the IPO, while for companies that grant IPO options I do not observe such pick suggesting that they report more realistic earnings. In the first graph I compute the total accruals scaled by assets from companies’s balance sheet statements (named BS Accruals), while in the second graph total accruals scaled by assets are collected directly form the operating part of the cash flow statements (named CF Accruals). The third graph represents development of the discretionary (abnormal) part of total accruals computed using performance-adjusted modified Jones model (DAC in the rest of the paper).
One possible way to test the hypothesis is to see whether the cross-sectional differ-ences of the first-day return are explained by the changes in the accruals between the pre-IPO year (t-1 ) and IPO year (t) conditioned on whether the carved out company grant IPO options or not. Since accruals at the IPO year are observed only ex-post, more interesting test from individual investor’s point of view would be whether ac-cruals in the pre-IPO year conditioned on IPO options grants predict cross-sectional differences of the first-day returns. For carve-outs that did not grant IPO options this relationship should be negative as a sign for earnings management. In contrast this negative relationship should be offset in the other subsample of carve-outs that grant IPO options. In this setting all information is publicly available before or soon after the IPO. Cash flow and earnings for the pre-IPO year is public information and it can be found in the section financial statements of prospectus for the issue. If the investor is attracted to some carve-out, he can check the SEC filings for information about the compensation packages of the executives, more precisely for stock options grants connected to the IPO offer price.
1.3 Sample selection, data description, variables
def-inition and empirical methodology
1.3.1 Sample selection and data description
I restrict my sample from May 1996 to December 2013 because IPO prospectuses are available on SEC’s (Securities and Exchange Commission) EDGAR system (Electronic Data Gathering, Analysis and Retrieval system) starting from May 1996. First I collect
data from the Thomson One SDC (Securities Data Company) database for US’s issues.4
The initial sample has 661 carve-outs for the period of almost 18 years. I require that the newly carved out subsidiary has available CRSP’s (Center for Research in Security Prices) tapes and has available financial statements in Compustat database. After merging all three database the sample decreases to 381 carve-outs. Further I exclude 81 finance firms (SIC Codes 6000-6999) and 20 units offers yielding a sample of 280 carve-outs. I hand collect data from financial statements of the subsidiary in the prospectuses (filing type S-1 in EDGAR database) for two years preceding the IPO in order to be able to compute the accruals in the pre-IPO year. Additionally, I hand collect data for the option grants to executives and outside directors that have exercise price equal to the offer price (IPO options) from the prospectuses of the issue. If this information is not available in the prospectus then I collect it from the proxy statements (filing type DEF 14A in EDGAR database) of the IPO year. I lost additional firms that did not have available prospectus or proxy statement. My final sample has 227 equity carve-outs out of which 102 firms grant IPO options to their executives.
Table 1.1 provides descriptive statistics of the whole sample (column 1) and the two subsamples (columns 2 and 3) conditioned on whether the company grants stock op-tions to the executives and outside directors with exercise price equal to the offer price. Companies that grant IPO options have lower accruals in the pre-IPO period and lower first-day return relative to companies that did not grant IPO options. Furthermore, they do not have huge reversal of the accruals in the IPO year (accruals remain neg-ative) suggesting that they use less aggressive accounting techniques compared to the huge reversal of accruals in the IPO year for companies that did not grant IPO op-tions. These differences in mean are statistically significant. IPO options granters on average are slightly smaller companies in terms of assets but they have higher sales and they are trading at statistically significant lower multiples (price-to-sales ratio). They
also have lower debt ratio compared to the non-granting companies. As for the issue characteristics, carve-outs with IPO options are bigger issues that leave less money on the table (due to the lower underpricing). It turns out that they are less “hot” issues revising initial mid point of the price range downwards suggesting lower demand in the book-building process. On average in both groups the parent company kept the control over the subsidiary after the initial public offering.
In order to disentangle the effect of earnings management on the two drivers of the first-day return (offer price and market first-day price) I need a benchmark price that should be considered a fair price (I call it intrinsic price in the rest of the paper) of the subsidiary. For each carveout in the sample I find a non-IPO industry peers. To select appropriate matching firms, I consider all firms in Compustat in the fiscal year prior to the IPO year with available information about their sales. I eliminate those that went public in the respective year. For remaining firms I obtain SIC codes and share prices from CRSP. Those firms were matched with each carveout in the sample based on IPO date and 3-digit SIC code (Alford (1992) and Weiner (2005) argue that matching based on 3-digit SIC on average provides the best multiple valuation accuracy).
From the set of matching firms for each carveout I keep five comparable firms that are closest in sales scaled by total assets in the year prior to the IPO. Finally, out of the five selected peers I keep three comparable firms with closest operating income scaled by total assets to the respective carveout. Each carveout in the sample is matched with industry peers with comparable sales and profitability. I matched on industry because this is where I, most likely, can find matching firms with similar risk, profitability and growth. I matched on sales scaled by total assets to control for differences in size. I matched on operating income scaled by total assets to control for differences in prof-itability and to ensure that matching firms are as close as possible to the fundamentals of appropriate carveout. Bhojraj and Lee (2002) argue that adjustment to industry multiples based on firm operating performance (profitability) improve valuation accu-racy. I decided to keep three (instead of only one) best matched companies and compute the average of their multiple (P/S ratio) in order to decrease the effect of a possible idiosyncratic shock on one single company on the IPO day. Table 1.2 compares the fundamentals of the carve-outs and matching firms.
Matching firms share similar sales and operating income distribution characteristics as the carve-outs for the both subsamples, IPO option granters and non granters. How-ever, they trade at different price to sales ratios. The difference is especially pronounced
Table 1.1: Summary sample characteristics
Whole Sample No IPO Options IPO Options
(1) (2) (3)
Observations 227 125 102
Main variables statistics:
first-day Return (%) 17.99% 19.39% 16.27% BS Accruals(t 1) -0.0708 -0.0665 -0.0761 BS Accruals(t) 0.0493 +0.0435 -0.0423* CF Accruals(t 1) -0.0854 -0.0826 -0.0889 CF Accruals(t) -0.0239 -0.0046 -0.0475* DAC(t 1) 0.0177 0.0015 0.0377 DAC(t) 0.0482 0.0694 0.0229*
Grants to Executives (mil.) 0.2510 0 0.5585
Grants to CEO (mil.) 0.1162 0 0.2587
Grants to Directors (mil.) 0.0177 0 0.0395
Company characteristics:
Total Assets(t 1) (mil.) 1,330.57 1,430.04 1,208.67
Sales(t 1) (mil.) 1,147.66 1,056.86 1,258.94
Liabilities/Assets(t 1) 0.85 0.89 0.79
P/Sales 13.63 20.09 5.71*
IPO characteristics:
No of Shares Offered (mil.) 17.18 14.47 20.51
Offer Price 15.41 15.42 15.39
Average Proceeds (mil.) 303.99 288.82 322.59
Money Left on the Table (mil.) 41.11 41.55 40.58
Offer Price Revision (%) 0.11% +1.83% -1.99%
Shares Retained by the Parent (%) 69.79% 72.61% 66.33%
Table 1.2: Characteristics of the carve-outs and matching firms
The sample of carve-outs runs from May 1996 to December 2013. For each carve-out there are three matching firms that are industry peers with most similar sales and profitability. Price-to-Sales ratio of the carve-outs is the product of the offer price and shares outstanding (all share classes) over the reported sales one year prior to the IPO. Price-to-Sales ratio of the matching firms is the average of the three most similar industry peers. For each of the three matching firms Price-to-Sales is computed as a product of the trading price of the respective firm at IPO date times shares outstanding over the sales reported one year prior the cohort IPO year.
Carve-outs Matching Firms
Characteristics mean 25% 50% 75% mean 25% 50% 75%
Whole Sample (227obs.)
Sal es(t 1) T ot al Asset s(t 1) 1.28 0.55 0.98 1.73 1.22 0.62 1.11 1.73 O per at i ng I ncome(t 1) T ot al Asset s(t 1) 0.10 0.06 0.12 0.19 0.10 0.07 0.12 0.16 Pr ice(t ) Sal es(t 1) 13.63 1.11 2.24 6.24 4.49 0.60 1.20 2.65
IPO Options=0 (125 obs.)
Sal es(t 1) T ot al Asset s(t 1) 1.11 0.53 0.89 1.55 1.12 0.58 0.96 1.54 O per at i ng I ncome(t 1) T ot al Asset s(t 1) 0.06 0.03 0.11 0.17 0.09 0.07 0.12 0.15 Pr ice(t ) Sal es(t 1) 20.09 1.39 2.83 8.10 5.78 0.72 1.34 2.59
IPO Options=1 (102 obs.)
Sal es(t 1) T ot al Asset s(t 1) 1.49 0.63 1.27 1.97 1.35 0.67 1.27 1.84 O per at i ng I ncome(t 1) T ot al Asset s(t 1) 0.14 0.08 0.12 0.20 0.12 0.08 0.12 0.17 Pr ice(t ) Sal es(t 1) 5.71 0.84 1.76 3.75 2.91 0.55 0.97 2.83
in the subsample of carve-outs that did not grant IPO options. It seems that they are overvalued compared to their industry peers. This is in the line with my hypothesis that those companies manage earnings in the IPO period and that inflated earnings mislead the market participants resulting in overvaluation compared to the industry peers.
1.3.2 Variables definition
1.3.2.1 Stock option grants
I define an incentive option as IPO option only if the exercise price is equal to the offer price of the IPO. Grant to executives is the number of IPO options (in millions) granted to the top executives of the company including the CEO. Grants to CEO is the number of IPO options (in millions) granted to the CEO. Grants to directors is the number of IPO options granted to the outside directors. I also hand collect the data about the terms under which the agents can exercise the options. In more than 92% of the sample they can start partially exercising these options one year after the offering. Data on IPO options are hand collected from the prospectuses of the initial public offerings. If this information is not available in the prospectuses then I hand collected it from the proxy statements in the year of the IPO.
1.3.2.2 Measures of initial pricing
Following the literature, I define the first-day return as percentage difference of the first-day secondary market closing price and the offer price.
First Day Return = f irst day closing price o f f er priceo f f er price ⇤ 100
Positive first-day return is a result of the following possibilities: either the offer price is set too low or the first-day closing market price is too high or both. In order to be able to decompose the first-day return I need a measure of a “fair” price of the offering. I compute the intrinsic (fair) price of each carveout with method of compatibles using price multiples. I am restricted to use only price-to-sales ratio (P/S) because sales figures are available for all companies. I am not able to use other multiples because a lot of carve-outs in my sample have losses in the year prior to the IPO and a lot of them are underfunded with negative value of their equity. Using other multiples like P/E, P/B, P/EBITDA is practically impossible without losing a lot of observation from the sample (around 20% of the sample). After matching based on sales and operating profit
I have three best matching industry peers for each carveout. For each matching firm (three for each carveout) I compute P/S ratio as follows:
(PS)single match = Market Price⇤Shares OutstandingPrior Fiscal Y ear Sales ; where market price is CRSP stock price for the matching firm at the close of the respective IPO offer date of the carveout. Than I compute the average of three P/S ratios to get one P/S ratio for each carveout:
(P
S)Match =
(P
S)si ngl e mat ch1+(PS)si ngl e mat ch2+(PS)si ngl e mat ch3
3
The intrinsic (fair) value of each carveout is computed by multiplying the average P/S ratio of the three industry peers with prior year fiscal sales of the appropriate carveout:
Intrinsic V alue = (PS)Match⇤ Sales(t 1) ; while intrinsic price of the carveout is: Intrinsic Price = Shares OutstandingIntrinsic V alue
I use the intrinsic (fair) price as a benchmark to compare the offer price and the first-day market price. I decompose the first-day return in its two drivers: offer price undervalu-ation (coming from low offer price) and market overpricing (coming from overoptimistic first-day closing market price):
O f f er Price Undervaluation = Intrinsic Price O f f er PriceO f f er Price ⇤ 100 Market Overpricing = First Day Closing Price Intrinsic PriceO f f er Price ⇤ 100
For clarity about the decomposition I use one recent example taken from my sample of equity carve-outs. Zoetis, Inc. is the world’s largest producer of medicine and vaccinations for pets and livestock. The company was a subsidiary of Pfizer, the world’s largest drug maker. Pfizer officially filed for registration of a Class A stock of Zoetis with the U.S. Securities and Exchange Commission on 10 August 2012. Zoetis’ IPO on 1 February 2013 sold 86.1 million shares for US$ 2.2 billion. Pfizer retained 414 million Class B shares giving it an 83% controlling stake in Zoetis. At the time, Zoetis’ debut was the largest IPO from a U.S. company since Facebook’s $16 billion IPO on 18 May 2012. The offer price of Zoetis’ shares was set at $26 per share (leading underwriters were JPMorgan Chase, Bank of America Merrill Lynch and Morgan Stanley). Shares sharply rose by the end of the first trading day to $35.01 per share. The first-day return of Zoetis’ IPO was 19.27% (35.01 26
26 ⇤100). Zoetis was trading at 3.05 times its reported
sales of $4259 million in 2012 (one fiscal year prior to the IPO). Price-to-Sales ratio
of Zoetis is computed as follows: P
SZoetis = $26⇤(86.1+414)4259 (offer price is multiplied by number of all share classes). The first-day return could be result of either too low offer
price ($26) or too high first-day closing price ($35.01) or even both. I selected Zoetis’ three industry peers based on sales and operating income: Neogen Corp., Biodilivery Sciences Inc. and Integra Life Science Inc. On first of February 2013 (the day of Zoetis’ IPO) they had an average price-to-sales ratio of 3.35. That is slightly higher than Zoetis’ price-to-sales ratio indicating that Zoetis was initially undervalued compared to its industry peers. According to my methodology the fair (intrinsic) price of Zoetis would have been $28.53 per share:
Intrinsic V alue = (PS)Match⇤ Sales(t 1) = 3.35⇤ 4,259 = $14,267.65 million Intrinsic Price = Shares OutstandingIntrinsic V alue = (86.1+414)14267 =$28.53per share
Using the calculated intrinsic price I decompose the first-day return of Zoetis into the part that comes from offer price undervaluation and market overpricing:
O f f er Price Undervaluation = Intrinsic Price O f f er PriceO f f er Price ⇤ 100 = 28.53 26
26 ⇤ 100 = 9.73%
Market Overpricing = F ir st Day M ar k et Pr ice I nt r i nsic Pr ice
O f f er Pr ice ⇤100 = 35.01 28.5326 ⇤100 = 9.54%
The initial return of Zoetis is decomposed into two parts: 9.73 percentage points due to initial undervaluation caused by low offer price and 9.53 percentage points due to market overpricing on the first trading day. The sum of the two components gives exactly 19.27% that is the first-day return of Zoetis. Having in mind the big picture of the paper I will add an info on executives pay of Zoetis and its reporting “habits”. Zoetis granted 550,640 stock options to its executives with an exercise price equal to $26 (the IPO offer price) on first of February 2013 (the IPO date). More than a half of the options (285,306) were granted to the CEO Juan Ramon Alaix. Mr.Alaix joined Pfizer in 2003 and he was appointed as CEO of the division (Zoetis) in July 2012. The IPO options granted to him are subject to cliff vesting in three years. This means that he cannot exercise any of these options until first of February 2016. However he had an incentive to push down the offer price as much as possible resulting in 9.73% undervaluation compared to Zoetis’ industry peers. The total accruals of Zoetis remained almost unchanged between year prior to the IPO and the IPO year. In both years and based on different specifications the accruals are negative (around -0.01) suggesting that Zoetis did not use “creative” accounting techniques to inflate the earnings and window dress the company before going public (documented procedure for an average IPO). Anecdotally, nowadays (two months before the end of the vesting period) Zoetis is trading around $45 per share. Potential profit of Mr.Alaix is around $5.5 million just from the grant of IPO options . This amount is more than twice his
cash compensation (salary and bonus) achieved in 2014. 1.3.2.3 Measures of earnings management (accruals)
Standard measure for earnings management in the literature are accruals. The simplest way to think about the accruals is that they are difference between earnings and cash flows. When this amount is positive for example, it can be a sign (not necessarily) of artificially inflated earnings by use of “creative” legal accounting techniques. One of the most popular way in which managers can engage in “window-dressing” before going public is that they can “borrow” earnings from other periods (future of past periods). If a manager knows that the company will go public next year, he could slow down earnings growth in the year before the IPO by postponing some sales deals for the next year for which cash was received in advance in the pre-IPO year or expensing some future expenses in the year prior to the IPO. This will create an earnings buffer that the managers could use to boost the performance in the IPO year by reporting higher sales or lower expenses that were suppose to be reported in the pre-IPO year. The time-shifting of earnings will be reflected in the financial statements trough the accruals. For example, postponed sales will increase the cash position and the current liabilities in the pre-IPO year and this will lead to lower accruals (see formulas below) and lower earnings in the pre-IPO year. Contrarily, in the IPO year when the sales will be actually reported, current liabilities will decrease and this will increase the accruals i.e. earnings.
There are many methodologies how one can compute the accruals. I use three measures of accruals. The first two measures are total accruals at each firm level that I compute from different statements (balance sheet or cash flow statement).
Balance sheet total accruals are computed with information found in the comparable balance sheets of each carve-out. I hand collect data from balance sheets for two years prior the IPO for each carve-out in order to be able to compute total balance sheet accruals for one year prior to the IPO.
BSAccrualsi, t 1= (4C Ai, t 1 4CLi, t 1 4Cashi, t 1
+4ST DEBTi, t 1 DEPi, t 1)
Assetsi, t 2
where:
4C Ai,t 1 is firm i’s change in the current assets from year t-2 to t-1 that I hand collected
4CLi,t 1 is firm i’s change in the current liabilities from year t-2 to t-1 that I hand collected from balance sheets reported in the prospectus (usual Compustat Item ]5);
4Cashi,t 1 is firm i’s change in cash from year t-2 to t-1 that I hand collected from
balance sheets reported in the prospectus (usual Compustat Item ]1);
4ST DEBTi,t 1 is firm i’s change in short-term debt from year t-2 to t-1 that I hand
collected from balance sheets reported in the prospectus (usual Compustat Item ]34);
DEPi,t 1 is firm i’s depreciation and amortization expense in year t-1 that I hand
col-lected from income statement reported in the prospectus (usual Compustat Item ]14); Assetsi,t 2 is firm i’s total assets in the year t-2 that I hand collected from balance sheet reported in the prospectus (usual Compustat Item ]6).
Following Hribar and Collins. (2002) I hand collect cash flow total accruals directly from the operating part of the cash flow statements reported in the prospectuses as follows:
C F Accr ual si, t 1=
(C HG ARi, t 1+ C H G I N Vi, t 1+ C H G APi, t 1+ C H GT AXi, t 1+ C H GOT Hi, t 1 DE Pi, t 1)
Asset si, t 2
where:
CHGARi,t 1 firm i’s decrease/increase in accounts receivable (usual Compustat Item
]302);
CHGI NVi,t 1 firm i’s decrease/increase in inventory (usual Compustat Item ]303);
CHGAPi,t 1 firm i’s increase/decrease in accounts payable (usual Compustat Item
]304);
CHGT AXi,t 1 firm i’s increase/decrease in taxes payable (usual Compustat Item ]305);
CHGOT Hi,t 1 firm i’s net change in other current assets (usual Compustat Item ]307);
DEPi,t 1 is firm i’s depreciation expense reported in the cash flow statement (usual
Compustat Item ]125);
Assetsi,t 2 is firm i’s total assets in the year t-2 that I hand collected from balance sheet reported in the prospectus (usual Compustat Item ]6).
The third type of accruals that I use as a measure of earnings management are discre-tionary accruals. In fact not all accruals are sign of earnings management, most of them are good mechanism to match revenues and expenses in the same fiscal year. Firstly Jones (1991) decomposes the total accruals in two parts: normal and discretionary. Than Dechow and Sweeney (1995) modified her model and Kothari and Wasley (2005) adjusted it controlling also for the performance of the companies. I estimate discre-tionary accruals using performance-adjusted modified Jones model. Total accruals for
firm i in year t are measured same as balance sheet total accruals (BSAccrualsi,t) in the equation above. The discretionary (abnormal) accruals for firm i in year t are the residuals ⇠i,t from the following regression, that I estimate for each of the 99 two-digit SIC industry groups in each year t.
BSAccrualsi,t = 0J+ 1J(Assets1
i, t 1)+ 2J(4Revi,t 4ARi,t)+ 3JPPEi,t+ 4JRO Ai,t 1+⇠i,t
where:
4Revi,t firm i’s change in revenues (Compustat Item ]12) divided by Assetsi,t 1
(Com-pustat Item ]6) ;
4ARi,t firm i’s change in account receivables (Compustat Item ]2) divided by Assetsi,t 1 ;
PPEi,t firm i’s gross value of property, plant and equipment (Compustat Item ]7) divided
by Assetsi,t 1;
RO Ai,t 1 firm i’s operating income before depreciation (Compustat Item ]13) on assets
in year t-1 ;
I use 2-digit SIC industry groups from the universe of firms in Compustat (IPOs are
excluded) to compute industry-specific parameter estimates ( J). Applying the
indus-try estimates to company data give me firm-specific normal accruals. The difference between company’s total accruals and estimated normal accruals are the discretionary (abnormal) accruals. Residuals of the model are actually my variable of interest i.e. discretionary (abnormal) accruals.
1.3.2.4 Other variables
The literature on IPOs is rich with studies exploring the determinants of the cross section of the first-day return. However most of the studies do not use same control variables. Butler and Kieschnick (2014) provide a benchmark specification and robust evidence on the empirical importance of control variables that should be included in a baseline regression on IPO underpricing. Starting from set of 48 possible controls used in the literature, they identify 15 as robust determinants of IPO initial return that should be included to minimize the risk of omitted variable bias. Most of the control variables that I use in all regressions are based on their finding. I use the following controls in all regressions: Ln of Firm Sales, Total Liabilities to Asset Ratio, Ln of one plus the Ratio of Secondary Shares Retained to Shares Offered, Ln of Offer Price to Sales Ratio, Underwriter Rank, Nasdaq Dummy, Internet IPO Dummy, Average Underpricing in Previous 30 Days, Prior 30 Days Industry Return, Prior 30 Days Standard Deviation
of Industry Return, Prior 30 Day CRSP EW Index, Ln of Industry Market Value to Sales Ratio, Offer Price Revision, Offer Price Revision when Negative, % of IPOs with Positive Price Revisions. The description of the control variables and data sources are in the Appendix of the paper.
1.4 Results
1.4.1 First-day return and earnings management
I start my analysis by exploring the cross-sectional variation of the first-day return in my sample of equity carve-outs over total accruals reported one year prior to the IPO conditioned on IPO options grants. I find this test very interesting because accruals one year prior the IPO are public information at the time of the IPO. I estimate the following equation under different specifications of accruals measures and IPO options grants:
FDRi = 0+ 1IPOoptionsi+ 2(Accrualst 1)i+ 3(Accrualst 1)i⇤ IPOoptionsi+ 40Xi+ "i
where FDRi is the first-day return of company i. (Accrualst 1)i is the total accruals
in one year prior the IPO of company i and IPOoptionsi are different specifications of
IPO options grants. Xi is the battery of control variables that are likely to affect the
first-day return. The variables of interest (first-day return, accruals and IPO option grants) are winsorized at 1% level in order to make sure that the results are not driven by the extremes of the distributions.
According to the earnings management explanation of IPO anomaly issuing firms report high earnings around the IPO by reporting accruals aggressively, inflating the earnings. In order to be able to do the manipulation companies create reserves of earn-ings in pre-IPO period by using more conservative accounting techniques and reporting negative accruals. If the company is manipulating the earnings then total accruals in pre-IPO year predict the cross-sectional variation of the first-day return. Due to the reversal of the accruals that inflate the earnings in the IPO year this relationship is neg-ative. My hypothesis is that executives of equity carve-outs who receive options grants with exercise price equal to the offer price do not have an incentive to window dress the company before going public. They would rather report more realistic or conservative earnings in the IPO period in order to have exercise price of their options as low as possible. This reporting behavior decreases the usual market overoptimism toward the
new issues and leads to lower first-day return. In contrast, for carve-outs that did not grant such compensation packages I observe negative relationship between total accru-als in the pre-IPO year and their first-day return as a sign of earnings manipulation (window dressing) in IPO period. The main results are in Table 1.3.
The first two columns are under specification where IPO options is a binary variable: 1 if anybody in the top executive team received an IPO option and 0 when nobody re-ceived such grants. Third and forth columns are under specification where IPO options is the number of IPO options (in million) granted to the top executives of the carveout company while in the next two columns (5 and 6) it is the number of IPO options granted just to the CEO. Columns 7 and 8 report the cross-sectional regressions where IPO options is the number of options (in million) granted to the board members of the carve-out. In all different specifications of IPO options first columns (column 1, 3, 5 and 7 respectively) are regressions where total accruals are measured from the balance sheet while in the second column (column 2, 4, 6 and 8 respectively) they are measured from the cash flow statement.
In all regressions and for all different specifications of IPO options and total accru-als there is a negative statistically significant relationship between total accruaccru-als and
first-day return for companies that did not grant IPO options (coefficient 2)5 that I
interpret as a sign of earnings management. For the other subset of carve-outs that
grant IPO options to the executives, coefficient of interest is the sum of 2 and 3. In
all regressions both coefficients are statistically significant. The negative relationship
between total accruals in the year preceding the IPO and first-day return ( 2) is offset
by the coefficient 3that has opposite sign. This finding suggests that in the subsample
of equity carveout that grant IPO options there is no evidence of earnings management in the period around the IPO.
Forty-eight companies grant IPO options also to the board members (non-employee directors). For these companies I find a direct positive significant relationship
(coeffi-cient 1) between these grants and the first-day return even in absence of accruals. It
is a sign that these directors might have an influence over the offer price of the IPO. More IPO options grants leads to higher first-day return driven by the lower offer price. They do have an incentive to push down the offer price because it is equal to the strike price in their option packages. The cross-sectional regression of the first-day return on directors IPO option grants unconditioned on the level of accruals is reported in Table
5Coefficient
2 gives us the relationship between accruals and first-day return only for companies