In Vitro Ceramic Scaffold Mineralization: Comparison Between
Histological and Micro-Computed Tomographical Analysis
B
ENJAMINW. T
HIMM,
1O
LIVERW
ECHSLER,
1M
ARCB
OHNER,
2R
ALPHM
U¨LLER,
1and S
ANDRAH
OFMANN11
Institute for Biomechanics, ETH Zurich, Wolfgang-Pauli-Str. 10, 8093 Zurich, Switzerland; and2RMS Foundation, Bischmattstrasse 12, 2544 Bettlach, Switzerland
(Received 3 April 2013; accepted 24 July 2013; published online 6 August 2013)
Associate Editor Kent Leach oversaw the review of this article.
Abstract—The porous structure of beta-tricalcium phosphate (b-TCP) scaffolds was assessed by conventional histomor-phometry and micro-computed tomography (micro-CT) to evaluate the substitutability of time-consuming histomor-phometry by rapid micro-CT. Extracellular matrix mineral-ization on human mesenchymal stem cell seeded b-TCP scaffolds was scanned by means of micro-CT after 6 weeks in cultivation and evaluated morphometrically. For the histo-morphometric analysis, undecalcified sections were prepared in the mediosagittal plane of the cylindrical tissue-engineered constructs. The sections were scanned at a nominal resolu-tion of 8 lm and stained with von Kossa and Toluidine Blue. Pores were analyzed with both methods for morphometrical parameters such as horizontal/vertical diameter and pore/ mineralized tissue area. Results showed highly significant correlations between histomorphometry and micro-CT for pore horizontal length (r = 0.95), pore vertical length (r = 0.96), pore area (r = 0.97), and mineralized tissue area (r = 0.82). Mean percentage differences between histomor-phometry and micro-CT measurements ranged from 1.4% (pore vertical diameter) to 14.0% (area of mineralized tissue). With its high image precision, micro-CT qualifies as an additional tool for endpoint evaluation measurements of mineralized tissue development within tissue-engineered con-structs also in ceramic scaffolds.
Keywords—Tricalcium phosphate, Scaffold, Pore, Micro-computed tomography, Histomorphometry, Image analysis, 3D imaging, Mesenchymal stem cell, Tissue engineering, Tissue-engineered construct.
INTRODUCTION
Since its invention and development, micro-com-puted tomography (micro-CT) has found its way into basic research and clinical applications.1In bone tissue
engineering, micro-CT is increasingly applied to char-acterize and visualize scaffolds in 3D and to image the progress of lesion closure in biomaterial-treated bone defects in in vivo animal models.9,19 Traditionally, histomorphometrical endpoint measurements were applied to analyze bone biopsies in detail. In this regard, Mu¨ller et al.14 showed the comparability of histomorphometry and micro-CT analysis to deter-mine bone volume and surface fraction, trabecular thickness, and separation. Micro-CT was shown to be a precise procedure for the measurement of unpro-cessed bone biopsies by means of fully automated determination of 3D morphometric indices.6,8,13,14,18 As micro-CT is still a relatively new imaging method, established to a large extent for bone analytical pur-poses, it is important to examine and validate its capabilities on solid scaffolds and tissue-engineered constructs.
Ceramics, such as beta-tricalcium phosphate
(b-TCP), are common biomaterials for the recon-struction of injured bone in the field of orthopedic and maxillofacial surgery, due to their favorable biocom-patible qualities.7In vivoimplantation of plain b-TCP or cell-seeded b-TCP has shown promising results in terms of tissue ingrowth and mineralization.19 Micro-CT imaging of bone ingrowth into implanted b-TCP scaffolds as well as b-TCP resorption in vivo has already been demonstrated.19,20 To assess tissue regeneration with scaffolds, mineralization of explanted ceramic scaffolds has traditionally been examined by two-dimensional histological assessment using histological sections and stainings to visualize mineral distribution. Histomorphometry implies sac-rifice of experimental animals and restricts the sample being used for secondary measurements such as mechanical testing due to the destructive nature of the procedure. By using several consecutive 2D sections,
Address correspondence to Sandra Hofmann, Institute for Bio-mechanics, ETH Zurich, Wolfgang-Pauli-Str. 10, 8093 Zurich, Switzerland. Electronic mail: [email protected]
DOI: 10.1007/s10439-013-0877-4
0090-6964/13/1200-2666/0Ó2013 Biomedical Engineering Society
three-dimensionality is calculated on the basis of ster-eology.15The whole method is tied to time-consuming, tedious sample preparation, involving sample embed-ding, potential demineralization, sectioning, and staining of sections. The destructive character is a limiting factor for in vitro tissue-engineered constructs, as they may not be further used for other assessment or even in vivo applications.
To overcome these limitations, the present study focused on the use of micro-CT to non-destructively distinguish bone-like tissue produced by human mes-enchymal stem cells (hMSCs) from b-TCP scaffolds in vitro.
The feasibility of imaging mineralized tissue devel-opment in tissue-engineered constructs also on ceramic scaffolds could generate a new 3D tool for quality assurance by allowing a precise assessment of the mineralized phases of a tissue-engineered construct before implantation. This would be in contrast to the procedures today, where a certain number of samples are analyzed with destructive histomorphometry in addition to the sample that will be implanted. This cross-sectional study design for morphometrical data analysis usually shows high variations and therefore a high uncertainty of the real properties of the implanted material, which renders predictions of successful implant parameters even more difficult.
This manuscript is a methodological description on the application of micro-CT in bone tissue engineering with porous b-TCP scaffolds. It aims at investigating the possibilities and limitations in data compilation and structural analysis of embedded, hMSC-cultivated b-TCP construct sections. HMSCs were differentiated along the osteoblastic lineage to produce bone-like, mineralized extracellular matrix (ECM) filling up the scaffold pores and thereby changing the structural properties measured by micro-CT. Micro-CT thres-holding was applied to distinguish b-TCP scaffold and mineralized tissue phase densities in these tissue-engi-neered constructs. With the intent of establishing micro-CT as a routine method for reliable analysis of scaffolds and tissue-engineered constructs, the results delivered by this method were compared to standard histomorphometry results.
MATERIALS AND METHODS Materials
b-TCP scaffolds (Ø 10 mm, height 3 mm) were kindly supplied by RMS Foundation (Bettlach, Swit-zerland). Scaffolds were produced according to the methods discussed in Bohneret al.4Three different cell media were applied in this study: control medium:
Dulbecco’s modified eagle medium (DMEM) supple-mented with 10% fetal bovine serum (FBS), 1% anti-biotic/antimycotic solution; expansion medium: control medium supplemented with 1 ng mL21basic fibroblast growth factor (bFGF), 1% non-essential amino acids (NEAA) (consisting of 8.9 mg L21 L-alanine, 13.2 mg L21 L-asparagine, 13.3 mg L21 L-aspartic acid, 14.7 mg L21 L-glutamic acid, 7.5 mg L21 glycine, 11.5 mg L21 L-proline, 10.5 mg L21 L-serine); and osteogenic differentiation medium: control medium supplemented with 50 lg mL21 L-ascorbic acid-2-phosphate (AA), 100 nM dexamethasone, 10 mM b-glycerolphosphate (b-GP). DMEM, FBS, antibiotic/ antimycotic, bFGF, NEAA, and 0.25% trypsin–EDTA were obtained from Invitrogen (Basel, Switzerland). AA, dexamethasone, and b-GP were obtained from Sigma-Aldrich (Buchs, Switzerland). All other sub-stances were of analytical or pharmaceutical grade and obtained from Sigma-Aldrich (Buchs, Switzerland). Bone marrow was obtained from Lonza (Lonza Group Ltd., Basel, Switzerland).
b-TCP Scaffold Characterization by Micro-CT Before Cell Seeding
For b-TCP scaffold morphometrical analysis (n = 5 per group), a micro-CT system (micro-CT 40, Scanco Medical, Bru¨ttisellen, Switzerland), equipped with a 5 lm focal spot X-ray tube as a source was used. Micro-CT has already been established as a standard method for scaffold characterization.19 An isotropic, nominal resolution of 6 lm (high resolution mode) was selected. X-ray tube settings were set to 50 kVp and 160 lA, an integration time of 300 ms and two-fold frame averaging was selected (micro-CT hardware, acquisition, and reconstruction parameters: 1000 pro-jections on 180°, 0.5 mm aluminum filter, cone beam reconstruction, Gaussian filtration, beam hardening correction, nominal resolution equals voxel size, Scanco measurement/reconstruction, and analysis software (Version 6)). After Gaussian filtration (filter width (0.8), filter support (1)) to partly suppress noise in the volumes, a threshold of 40% of the maximum grayscale value was applied to segment the scaffold from the pores by a global thresholding procedure. The thresholded images were component labeled to remove noise smaller than 20 voxels within pores. For the subsequent analysis of the scaffold without its cut pores at the scaffold edges, a sub-volume of the originally measured data was selected. The selected volume of interest (4.8 9 4.8 9 2 mm3) was located in the center of the scaffold to measure scaffold structures only. Primary evaluation indices for quantitative morpho-metrical analysis, such as total examined sample volume (TV), the scaffold volume (SV), scaffold volume density
(SV/TV), scaffold porosity (100%—SV/TV), scaffold surface density (SS/TV), and secondary evaluation indices such as pore diameter, pore wall thickness, and pore wall number, as adopted from bone morphometric parameters,5were assessed.
HMSC Isolation and Expansion
HMSC isolation and characterization was
per-formed as previously described.12 HMSCs of passage
three (P3) were used for tissue culture. Tissue Culture in Perfusion Bioreactors In-house customized and produced perfusion bio-reactors made of polysulfone were designed to scan constructs repeatedly in a sterile way by means of micro-CT to monitor the growth of mineralized tissue continuously and non-destructively.10,16Sixteen sterile b-TCP scaffolds were immersed in PBS and transferred into wells of 12-well plates for 24 h. PBS was aspirated and 4 9 106hMSCs suspended in a volume of 100 lL were pipetted on top of each scaffold. Constructs were placed in an incubator at 37°C, 5% CO2, 100%
humidity, and a drop of control medium was applied every 20 min onto each construct for 2 h to keep them moist and allow cell adherence on b-TCP scaffolds. After 2 hours, control medium was added carefully and constructs left in the incubator over night. The following day, hMSC-seeded constructs were fitted into the perfusion bioreactors (one construct per bioreactor) and connected to the medium perfusion system. The bioreactor perfusion system held an amount of 12 mL per bioreactor in total. Constructs were perfused with osteogenic medium or control medium (n = 4 constructs per group), respectively. The peristaltic pump was adjusted to a flow rate of 0.2 mL min21, hMSC-seeded b-TCP scaffolds were perfused with an average velocity of approximately 0.12 mm s21.16 Static control groups were not con-nected to the pump and received 6 mL osteogenic or control medium per bioreactor (n = 4 constructs per group), respectively. To test for spontaneous b-TCP scaffold degradation or mineralization, another 8 sterile, non-cell-seeded b-TCP scaffolds were immersed in PBS and transferred to static bioreactors. Bioreactors (n = 4 per group) were either filled with osteogenic or control medium, respectively. Due to the limit of how many bioreactors can be subjected to flow perfusion in parallel in our system, un-seeded control groups were only run in the static setup. All scaffolds were scanned on a weekly basis by micro-CT for 6 weeks. Medium was exchanged three times per week.
Scaffold Histological Sectioning
Tissue-engineered b-TCP constructs were removed from the bioreactors and fixed in 10% neutral-buffered formalin (Sigma-Aldrich, Buchs, Switzerland) over
night at 4°C. Constructs were embedded in
poly-methylmethacrylate (PMMA) (89.5% methylmethac-rylate (Fluka, Buchs, Switzerland), 0.5% Perkadox 16 (Dr. Grogg Chemie, Stettlen, Switzerland), 10% dib-utylphthalate (Merck Inc., Hohenbrunn, Germany)) under vacuum for 3 days at room temperature for
subsequent 2D histomorphometry. 200 lm thick slices
were mediosagittally cut by means of an inner-hole saw (SP1600, Leica, Heerbrugg, Switzerland), dried, and flattened between flat metal plates over night.
Micro-CT Imaging of Embedded Histological Slices After sectioning, the 200lm thick histological slices were micro-CT scanned again with an inclination of approximately 10° to reduce scanning artifacts. An isotropic, nominal resolution of 8 lm (high resolution mode) was selected. The X-ray tube was operated at 55 kVp and 145 lA, integration time was set to 300 ms and a three-fold frame averaging was applied (same micro-CT hardware, acquisition, and reconstruction parameters as above). A constrained Gaussian filter was applied to partly suppress noise (filter width (0.8) and filter support (1)). Virtual micro-CT scans were then horizontally leveled for further comparison with their corresponding histological slices.
Histological Staining
200lm thick b-TCP sections were stained for cal-cium and cell cytoplasm by von Kossa and Toluidine Blue staining, respectively. For histological staining, PMMA within histological slices was not dissolved to maintain scaffold and mineralized tissue morphology and demineralization was not performed to maintain calcium within the b-TCP scaffold and the mineralized tissue. Scaffold intersections were stained with von Kossa, counterstained with Toluidine Blue and indi-vidually glued onto Perspex slides (Perspex GS Acry-licglas Opal 1013, Wachendorf, Switzerland). To approach a 2D-like section, glued slices were abraded by means of a polishing machine (Planopol V, Struers A/S, Ballerup, Denmark) to a thickness of approxi-mately 80 lm for further trans-Perspex light micro-scopic imaging. Other stainings such as Alizarin Red, Hematoxylin, and Eosin, Masson’s Trichrome or Sir-ius Red or immunohistochemical stains could not be performed as they would require paraffin embedding or treatments under acidic conditions which would have destroyed the sample.
Pore Evaluation of ab-TCP Section After Micro-CT Measurement
For the micro-CT scanned b-TCP section, a global thresholding procedure was applied to segment/bina-rize mineralized tissue from b-TCP scaffold according to Ru¨egseggeret al.17Initial best fit thresholds both for mineralized tissue and b-TCP scaffold were selected by visual estimation based on the mineralized tissue and b-TCP scaffold present on the histologically stained b-TCP slice. To optimize these thresholds, the genuine mineralized tissue visible in the pores of the histologi-cally stained b-TCP section was compared to the vir-tual mineralized tissue of the corresponding micro-CT image slice. Only pores with sharply bounded and clearly visible tissue mineralization on the histologi-cally stained section were selected for analysis (tissue mineralizations with less calcium density clearly visible stained in grey, whereas b-TCP stained in black). Based on latter proposition, the mineralized tissue in 21 pores was histologically and micro-tomographically quantified and plotted for correlation to yield ideal micro-CT thresholds. A maximum of 21 pores on a single slice with clearly identifiable mineralized tissue contours were chosen to gain meaningful results for subsequent correlation studies. To ensure to select the equivalent virtual pore the approximate surface region of the scanned slice was selected and secondly the shapes of the surface pores were matched.
For the histologically stained, approximately 80lm thick b-TCP section, a microscopic image (resolution 0.7 lm pixel21) was taken by means of a reflected light microscope. Tissue mineralizations of the 21 selected pores were manually contoured followed by area quantification using ImageJ 1.43 software (freeware of National Institute of Healthhttp://rsb.info.nih.gov/ij). To contour the same pores on the same section
measured by micro-CT, the corresponding 2D, 8lm
thick micro-CT image slice closest to the section sur-face of each corresponding pore was selected. A screenshot image of each of the 21 selected pores was taken followed by contouring and quantification of virtual pore mineralizations (resolution 8 lm pixel21). Results of both measurement techniques were plotted and the correlation coefficients calculated.
The correlation coefficient was optimized by micro-CT threshold variations for mineralized tissue in steps of ±1% of the maximum grayscale value followed by de novo contouring of the virtual pore mineralizations only followed by correlation coefficient calculations. The latter step was repeated until obtaining the highest correlation coefficient. The same optimization proce-dure was done for the b-TCP scaffold threshold. According to the optimized correlation coefficient, a threshold of 43% of the maximum grayscale value was
evaluated to ideally segment b-TCP scaffold and a threshold of 17% of the maximum grayscale value was evaluated to segment mineralized tissue of the scanned b-TCP sections.
The final thresholds for b-TCP scaffold and miner-alized tissue were used to correlate horizontal and vertical dimensions of pores between the two imaging methods by measuring the longest horizontal and vertical distance from one end of the pore wall to the other end at a non-interconnecting part of the pore walls. Correlation for total pore area was measured by contouring the inner pore boundaries for both histo-logical and micro-tomographical images. ImageJ 1.43 was used to measure pore parameters in all cases.
Statistical Analysis
Quantitative data for correlations of pore properties and mineralized tissue within pores are presented as bivariate linear regressions. Coefficients of correlation (r) and determination (r2) are given for the goodness of fit. Group means have been compared by Student t-tests using SPSS 16.0.1 software (SPSS Inc., Chicago, IL). Quantitative data of mineralized tissue are pre-sented as mean ± standard deviation and a one-way univariate analysis of variance (ANOVA) followed by LSD post hoc assessment was applied to compare groups within the same time point of examination. Perfused constructs with/without osteogenic medium, static constructs with/without osteogenic medium, and control scaffolds with/without osteogenic medium were statistically compared. Values of p < 0.05 were considered significant, and p < 0.01 were considered highly significant. SigmaPlot 11.0 software (SigmaPlot, Systat Software Inc., Erkrath, Germany) was used for plotting graphs.
RESULTS
Characterization of b-TCP Scaffolds BeforeIn Vitro Culture
Micro-CT was used to characterize scaffold mor-phometrical properties (n = 5 scaffolds) (Fig. 1). The scaffolds showed a medium porosity of 53.8 ± 0.6%. Average scaffold surface density (SS/TV) was 9.6 ± 0.2 mm2mm23. The average pore size and pore wall thickness was 273.8 ± 7.1 and 132.0 ± 2.3 lm, respec-tively. 3D micro-CT (Fig.1) and 2D tomography
image (Table 1) measurements for average pore size
differ in value because 3D micro-CT measurements are based on the largest possible volume bubble which defines the volume size of the pore. The pores, how-ever, are rather elliptic, which results in different
average pore diameters for 2D tomography images. The pore wall number averaged at 4.4 ± 0.1 mm21.
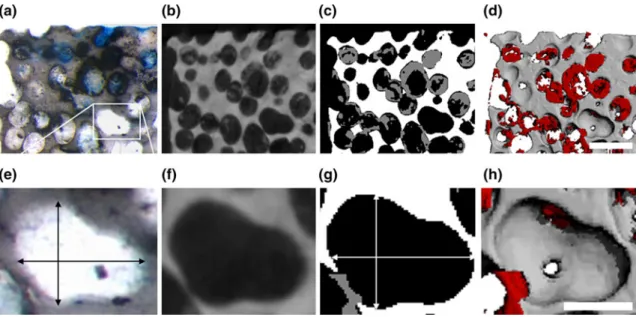
b-TCP Section Imaging and Pore Evaluation Figure2 shows a representative histological section of a stained b-TCP scaffold. Cells were stained blue by Toluidine Blue, the b-TCP scaffold stained gray and mineralized tissue stained black by von Kossa stain, wherein b-TCP and mineralized tissue were clearly dis-tinguishable under the light microscope (less obvious in the shown figures). Single cells stained by Toluidine Blue however were not quantifiable by image analysis. As indicated by white circles, 21 mineralized pores within the section were selected for further pore analysis in which mineralization boundaries within pores could clearly be identified for exact pixel quantification.
A comparison of a histological and the corre-sponding micro-tomographical section of a tissue-engineered construct is shown in Fig.3. The histolog-ically stained section shows cellular distribution within pores, visible by blue coloration, as well as mineral-izations, indicated in black (Figs.3a and 3e). A cor-responding micro-CT image presents the same image plane in gray scale (Figs.3b and 3f), followed by an image where b-TCP scaffold and ECM mineralizations have been segmented from each other in 2D (Figs.3c and3g) and 3D (Figs.3d and3h). The double-headed arrows in Figs.3e and3g indicate the system whereby the pores were horizontally and vertically measured, resulting in Tables1 and2.
A bivariate linear regression analysis based on his-tological and micro-tomographical pore parameters was performed to obtain correlations of pore param-eters between the two imaging methods. Table2shows the results derived from the bivariate linear regression analysis with mean actual and percentage differences
for the morphometric indices. The correlations
between the pore parameters were always significant (p < 0.0001). Coefficients of correlations (r) ranged between 0.82 and 0.97, and coefficients of determina-tion (r2) were calculated accordingly to be between 68 and 94%. Mean actual differences between 9 lm (1.38%) and 12 lm (1.82%) were found for one-dimensional parameters, whereas for two-one-dimensional parameters, such as pore area and mineralized tissue area, mean actual differences between 216 lm2 (214.03%) and 7 lm2 (2.04%) were calculated. The values for pore horizontal and vertical diameter as well pore area were overestimated, whereas the area of mineralized tissue was underestimated by micro-CT. Figure4 shows scatter plots of the relationship between histological and micro-tomographical 2D parameters for all four indices. Table 2summarizes the quantitative results derived from Fig.4.
DISCUSSION
Micro-CT evolved within the last decade to be an important imaging tool for biomedical research. In tissue-engineered constructs it may ideally be used as
FIGURE 1. (a) Micro-CT image of a b-TCP scaffold. (b) Scaffold parameters assessed by micro-CT analysis.
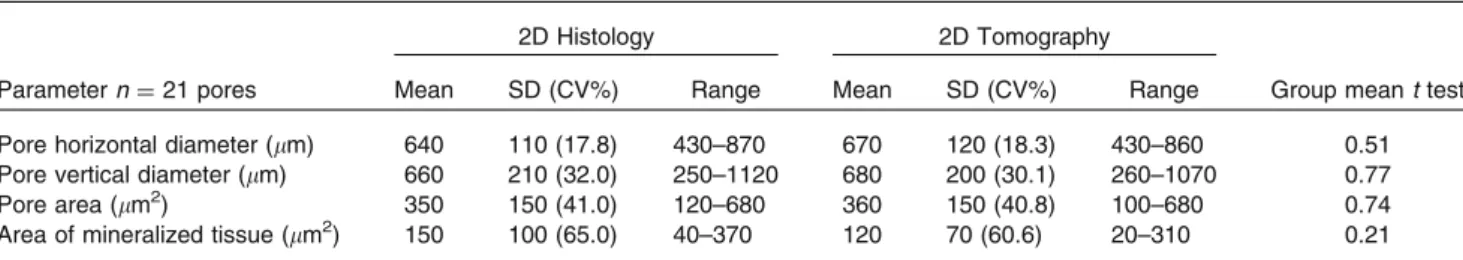
TABLE 1. Basic descriptive statistics of histological and micro-tomographical parameters of 21 b-TCP scaffold pores.
Parameter n = 21 pores
2D Histology 2D Tomography
Group mean t test
Mean SD (CV%) Range Mean SD (CV%) Range
Pore horizontal diameter (lm) 640 110 (17.8) 430–870 670 120 (18.3) 430–860 0.51 Pore vertical diameter (lm) 660 210 (32.0) 250–1120 680 200 (30.1) 260–1070 0.77
Pore area (lm2) 350 150 (41.0) 120–680 360 150 (40.8) 100–680 0.74
a quality control system to allow the qualitative and quantitative measurement of bone-like development at different time points in situ. Time-lapsed examin-ations of ECM mineralization on scaffolds have been reported only recently for X-ray translucent silk fibroin and polycaprolactone scaffolds.10,16 The transparency of the polymer-based scaffolds yielded a very high scaffold-to-mineralized tissue contrast, making segmentation fast and monitoring of the developing mineralized tissue straightforward. As many scaffolds for bone tissue engineering are based on X-ray-opaque materials, such as ceramics, an equivalent micro-CT monitoring system that segments the two phases would be desirable in order to follow
bone-like tissue development simultaneously to scaf-fold development and eventually degradation.
In this study, morphometric indices for b-TCP scaffolds as well as the mineralized tissue engineered by the cells were evaluated with respect to their correlation between histological and micro-tomographical exam-inations. The segmentation of the scaffolds from the newly produced biological tissue presented a challenge due to the similar densities and as partial volume effects (PVE) of the scaffold might interfere with the less dense mineralized tissue produced by the cells. PVEs are implicitly present in micro-CT imaging which cause gray values to differ from their real value and which lead to voxel misallocation depending on the threshold settings.11 This phenomenon is mostly derived from a limited spatial resolution, the size and shape of pores, image sampling, and thickness of slices.11 Another difficulty was the histological sectioning of these con-structs due to the brittleness of b-TCP scaffolds when cut ultra-thin. Many conventional histological stain-ings could not be applied because they require paraffin sectioning with precedent demineralization, a proce-dure that would completely remove the b-TCP of the scaffold and the mineralizations produced by the cells and therefore would interfere with the analysis. Only indices that could be assessed from 2D images in both imaging techniques were considered for the compari-son. Pore diameter and mineralized tissue area within the pore are important to show the degree of pore mineralization, which is a parameter that might also be
FIGURE 2. A 80 lm thick scaffold section derived from a hMSC seeded b-TCP scaffold incubated within a perfusion bioreactor for 6 weeks. The section has been stained by von Kossa and Toluidine Blue stain. Circles indicate pores chosen for pore and mineralized tissue analysis. The vertical arrow indicates the direction of perfusion flow.
FIGURE 3. Comparison of a histological and micro-tomographical section of a tissue-engineered construct cultivated with osteogenic differentiation medium under perfusion conditions. (a) Abraded, 80 lm thick histologic section at day 42 of incubation. Cells are stained in blue with Toluidine Blue, b-TCP scaffold stained in gray and mineralized tissue stained in black by von Kossa stain. (b) Corresponding 2D micro-CT gray scale image. (c) Corresponding 2D micro-CT segmented image, and (d) corresponding 3D micro-CT segmented image of the full, 200 lm thick section. (e–h) Segmentation sequence of a single pore derived from (a, white box), for the subsequent structural analysis of pore indices, such as pore horizontal/vertical diameter (double-headed arrows) and pore area/mineralized area. Scale bar (d): 500 lm; scale bar (h): 250 lm.
relevant for a future expansion of the here presented technique to in vivo studies. Specifically, it might show implant integration and fixation in its surroundings. If a correlation is found in 2D, it is likely that such a correlation also exists in the 3D situation. This might prove advantageous to histological sectioning, where three-dimensionality is calculated solely on the basis of 2D stereology.
To confirm the accuracy of micro-CT for porous b-TCP scaffolds, the microstructure of a total of 21 b-TCP scaffold pores was assessed by conventional histomorphometry and micro-CT morphometry. For method development purposes it was necessary to adapt the threshold to obtain an optimized correlation. Although the selection of pores for correlation pur-poses was subjective, subjectivity was attenuated by
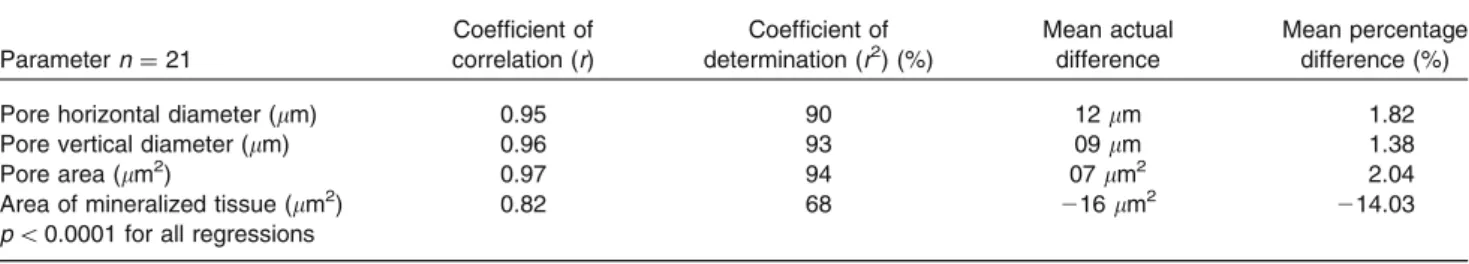
TABLE 2. Bivariate linear regressions between pore parameters assessed either histologically or micro-tomographically.
Parameter n = 21 Coefficient of correlation (r) Coefficient of determination (r2) (%) Mean actual difference Mean percentage difference (%)
Pore horizontal diameter (lm) 0.95 90 12 lm 1.82
Pore vertical diameter (lm) 0.96 93 09 lm 1.38
Pore area (lm2) 0.97 94 07 lm2 2.04
Area of mineralized tissue (lm2) 0.82 68 216 lm2 214.03
p < 0.0001 for all regressions
FIGURE 4. Correlations of histologically derived 2D structural pore indices with the corresponding 2D micro-CT structural pore indices: (a) pore horizontal diameter; (b) pore vertical diameter; (c) pore area; and (d) area of mineralized tissue. A total of 21 pores were examined for the correlations. All regressions were highly significant with p < 0.0001.
aiming for a mathematically high correlation. To find a suitable threshold for b-TCP and mineralized tissue, only pores were selected in which tissue mineralization explicitly took place. The selection of specific, clearly mineralized pores lead to more precise correlation values next to diffusely mineralized and for the human eye undifferentiatable tissue mineralizations. The selected pores were found to be close to the upper scaffold surface due to seeding from top and due to a possibly low porosity/interconnectivity within the scaffold to guarantee a homogeneous distribution of cells which is a common and unfortunately still only partly solved phenomenon in tissue engineering. When comparing the results of histological and micro-CT analyses, high correlations (r = 0.82–0.97), and high accuracy (mean percentage difference: 1.4–14.0%) between the two methods were found for the deter-mination of the primary morphometric parameters. Higher correlations could not be achieved, probably because our study compared the same sample with two different resolutions (0.7 lm with histomorphometry and 8 lm with micro-CT) which automatically results in quantitative differences for primary morphometric parameters.13 The non-perfect horizontal leveling of the virtual slices might have further resulted in small deviations from the ideal corresponding micro-CT image slice. The visual comparison of the b-TCP scaffold, as revealed by corresponding 2D histological and micro-tomographical slices, provided evidence that micro-CT imaging can be effectively adopted as a tool for the analysis of porous b-TCP scaffold mor-phology and architecture. These findings supported earlier findings by Mu¨ller et al.14 who evaluated the trabecular bone architecture by both micro-CT and histology. In that study, 5 lm thick histological slices of trabecular bone biopsies were compared with their corresponding micro-CT slices with a nominal resolu-tion of 14 lm and high correlaresolu-tions between the two methods were found (r-value between 0.84 and 0.93). The mean percentage differences between histology and micro-CT ranged from 2.5 to 6.1%.
In our study, a regression analysis was used to describe the relation between the two measurement
techniques.2 The comparison of group means within
correlations was significant for all measured pore parameters. This means that the methods agreed through the full range; correlations between measure-ments for both techniques were excellent for pore horizontal and vertical diameters and pore area, however decreased for area of mineralized tissue due to PVEs. Horizontal and vertical dimensions were both measured to check for similar r-values (i.e., r = 95 and r = 96, respectively (Figs.4a and 4b)) to show that both horizontal as well as vertical micro-CT val-ues may be used equally for correlation. From our
observations cells did not favor one dimension over the other. By investigating a high number of pores it might be possible to draw conclusions on whether cells favor certain pore sizes over others with regard to the amount of mineralized ECM production. However, such a process would be very time-consuming and ideal pore sizes may not be deduced or only be valid for this exact setup in a static environment. Recently, it has even been postulated that an ideal architecture for
bone scaffolds does not even exist.3 Furthermore,
monitoring of ECM mineralization was conducted in a parallel study using same scaffolds, to follow the increase of mineralization within TCP scaffold pores. The authors observed that mineralized structures were deposited within pores of the scaffold without scaffold degradation over a culture time of 6 weeks (data not shown).
As some voxels at the pore edges were not counted as true b-TCP voxels, pore horizontal and vertical diameters, and pore area were overestimated in com-parison to histomorphometrical analysis, whereas some voxels at the edges of true tissue mineralization were not counted as tissue mineralization, thus latter was underestimated by micro-CT.
One of the aims of this study was to show that micro-CT could be used as a method to assess and analyze porous, tissue-engineered constructs through comparison with histomorphometry of corresponding histological slices. Histomorphometrical analysis is considered to be the gold standard in quantitative morphometry due to its precise staining and high-resolution images.14Our results support our hypothe-sis that a micro-tomographical approach can be applied to assess the scaffold pore architecture if the threshold is optimized beforehand to yield a high correlation. This means that new correlation studies are necessary every time a certain type of a new con-struct or a concon-struct at a different time point in culti-vation is intended to be analyzed morphometrically using CT only. That further means that micro-CT may not be instantly used as a sole method to substitute histomorphometrical analysis automatically. Furthermore, for longitudinal monitoring pores can-not be selected before performing the measurement. The hypothesis is also limited by PVEs, which may interpret thin pore walls as parts of the mineralized tissue, as is visible inFigs. 3f and3g. Thus, despite of a high correlation value, thresholding was not fully able to properly discriminate between scaffold voxels and mineralized tissue voxels, eventually leading to errors in quantifications of mineralized tissue. Because the TCP scaffold can be misinterpreted as mineralized tissue, this might additionally account for a lower correlation coefficient for mineralized tissue in our case. Other factors may also lead to correlation errors,
such as interpolation related errors, that is, when the micro-CT reconstruction angle does not fully coincide with the cutting angle of the microscopic section. This can give rise to an induced mismatch implying larger scatter in the results.11Another issue of concern is the possibility of volume effects due to material staining on another underlying plane which might affect spatial resolution in the case of using an 80 lm slice in optical microscopy. To circumvent latter volume effects, an-other possibility would have been the use of scanning electron microscopy-energy dispersive X-ray spectros-copy (SEM–EDX) in such a study. With a depth res-olution of around 2 lm the spatial resres-olution of SEM– EDX is much finer and calcium phosphate could be easily distinguished from chemical compositions such as C, H, and O atoms, PMMA and organic molecules directly at the slice surface.
Although highly correlating results have been obtained, histomorphometry remains highly relevant for the determination of produced mineralized tissue within scaffold pores as micro-CT does not provide information on cellular dynamics.14 The choice of an appropriate threshold assumes that an adequate his-tological image is available which per se presents a limitation for micro-CT imaging. This implies that micro-CT imaging will not replace histology, but is complementary.
The results of this study present a high degree of accuracy of micro-CT imaging regarding porous b-TCP scaffold architecture/mineralized tissue distri-bution. The study shows that immature poorly min-eralized bone formedin vitrocan be differentiated from b-TCP by a micro-CT analysis. This however would not validate micro-CT for measuring bone formation in vivowhere more mature bone formed would have a greater X-ray absorbance and would be more difficult to differentiate from b-TCP. A main interest would be that one can follow progressive in vitro construct mineralization by progressive micro-CT. We showed that micro-CT can be valuable for endpoint measure-ments where—after fixation of the tissue—high reso-lution (down to 8 lm in our case) can be taken into account as the tissue is dead. On the other hand the method was shown to be rather limited for monitoring studies at a resolution of 18 lm, as one would have to acquire additional histological samples at each time-point to select the appropriate threshold. These find-ings are in contrast to similar monitoring studies on scaffolds with low x-ray contrast, such as polymeric or proteinous scaffolds. There, selecting the appropriate threshold is a straightforward procedure because the newly produced mineralized matrix can be clearly distinguished from the scaffold.
A further focus should try to refine the thresholding procedure for the segmentation of the mineralized
tissue before micro-CT may be used as an image-gui-ded quality control tool. We expect these findings to improve our understanding on the formation of min-eralized ECM by cells seeded within b-TCP scaffolds. Alternatively, the proposed method may be used to assess the status of tissue-engineered constructs at the end of thein vitroculture at a resolution of 18 lm in a sterile way and expand our knowledge on how well tissue-engineered constructs perform after implanta-tion in vivo.
ACKNOWLEDGMENTS
The authors acknowledge funding from the RMS Foundation, Bettlach, Switzerland. We further thank Katarina Ka¨mpf, Sabina Wunderlin, and Kati Zlinsky, Vetsuisse Faculty, University of Zurich, for consulting and assistance in histological processing.
CONFLICT OF INTEREST
All authors have no conflict of interest. No benefits in any form have been or will be received from a commercial party related directly or indirectly to the subject of this manuscript.
REFERENCES 1
Bauer, J. S., and T. M. Link. Advances in osteoporosis imaging. Eur. J. Radiol. 71:440–449, 2009.
2
Bland, J. M., and D. G. Altman. Comparing methods of measurement: why plotting difference against standard method is misleading. Lancet 346:1085–1087, 1995.
3Bohner, M., Y. Loosli, G. Baroud, and D. Lacroix.
Commentary: Deciphering the link between architecture and biological response of a bone graft substitute. Acta Biomater.7:478–484, 2011.
4
Bohner, M., G. H. van Lenthe, S. Gru¨nenfelder, W. Hirsiger, R. Evison, and R. Mu¨ller. Synthesis and char-acterization of porous beta-tricalcium phosphate blocks. Biomaterials26:6099–6105, 2005.
5
Bouxsein, M. L., S. K. Boyd, B. A. Christiansen, R. E. Guldberg, K. J. Jepsen, and R. Mu¨ller. Guidelines for assessment of bone microstructure in rodents using micro-computed tomography. J. Bone Miner. Res. 25:1468–1486, 2010.
6
Chappard, D., N. Retailleau-Gaborit, E. Legrand, M. F. Basle, and M. Audran. Comparison insight bone mea-surements by histomorphometry and microCT. J. Bone Miner. Res.20:1177–1184, 2005.
7El-Ghannam, A. Bone reconstruction: from bioceramics to
tissue engineering. Expert Rev. Med. Devices 2:87–101, 2005.
8
Fajardo, R. J., T. M. Ryan, and J. Kappelman. Assessing the accuracy of high-resolution X-ray computed tomog-raphy of primate trabecular bone by comparisons with
histological sections. Am. J. Phys. Anthropol. 118:1–10, 2002.
9
Gauthier, O., R. Mu¨ller, D. von Stechow, B. Lamy, P. Weiss, J. M. Bouler, et al. In vivo bone regeneration with injectable calcium phosphate biomaterial: a three-dimen-sional micro-computed tomographic, biomechanical and SEM study. Biomaterials 26:5444–5453, 2005.
10
Hagenmu¨ller, H., S. Hofmann, T. Kohler, H. P. Merkle, D. L. Kaplan, G. Vunjak-Novakovic, et al. Non-invasive time-lapsed monitoring and quantification of engineered bone-like tissue. Ann. Biomed. Eng. 35:1657–1667, 2007.
11Kerckhofs, G., J. Schrooten, T. Van Cleynenbreugel, S. V.
Lomov, and M. Wevers. Validation of x-ray microfocus computed tomography as an imaging tool for porous structures. Rev. Sci. Instrum. 79:013711, 2008.
12
Meinel, L., V. Karageorgiou, S. Hofmann, R. Fajardo, B. Snyder, C. Li, et al. Engineering bone-like tissue in vitro using human bone marrow stem cells and silk scaffolds. J. Biomed. Mater. Res. A71:25–34, 2004.
13
Mu¨ller, R., M. Hahn, M. Vogel, G. Delling, and P. Ru¨eg-segger. Morphometric analysis of noninvasively assessed bone biopsies: comparison of high-resolution computed tomogra-phy and histologic sections. Bone 18:215–220, 1996.
14
Mu¨ller, R., H. Van Campenhout, B. Van Damme, G. Van Der Perre, J. Dequeker, T. Hildebrand, et al. Morpho-metric analysis of human bone biopsies: a quantitative structural comparison of histological sections and micro-computed tomography. Bone 23:59–66, 1998.
15
Parfitt, A. M., C. H. Mathews, A. R. Villanueva, M. Kleerekoper, B. Frame, and D. S. Rao. Relationships between surface, volume, and thickness of iliac trabecular bone in aging and in osteoporosis. Implications for the microanatomic and cellular mechanisms of bone loss. J. Clin. Invest.72:1396–1409, 1983.
16
Porter, B. D., A. S. Lin, A. Peister, D. Hutmacher, and R. E. Guldberg. Noninvasive image analysis of 3D construct mineralization in a perfusion bioreactor. Biomaterials 28:2525–2533, 2007.
17Ru¨egsegger, P., B. Koller, and R. Mu¨ller. A
microtomo-graphic system for the nondestructive evaluation of bone architecture. Calcif. Tissue Int. 58:24–29, 1996.
18Thomsen, J. S., A. Laib, B. Koller, S. Prohaska, L.
Mosekilde, and W. Gowin. Stereological measures of trabecular bone structure: comparison of 3D micro com-puted tomography with 2D histological sections in human proximal tibial bone biopsies. J. Microsc. 218:171–179, 2005.
19
van Lenthe, G. H., H. Hagenmu¨ller, M. Bohner, S. J. Hollister, L. Meinel, and R. Mu¨ller. Nondestructive micro-computed tomography for biological imaging and quanti-fication of scaffold-bone interaction in vivo. Biomaterials 28:2479–2490, 2007.
20
von Doernberg, M. C., B. von Rechenberg, M. Bohner, S. Gru¨nenfelder, G. H. van Lenthe, R. Mu¨ller, et al. In vivo behavior of calcium phosphate scaffolds with four different pore sizes. Biomaterials 27:5186–5198, 2006.