Daniel M. Mueller*, Arnold von Eckardstein and Lanja Saleh
Quantification of teicoplanin in plasma by LC-MS
with online sample clean-up and comparison with
QMS
®
assay
Abstract
Background: Teicoplanin is a glycopeptide antibiotic used
for the treatment of infections caused by Gram-positive bacteria. There is a good correlation between trough levels and clinical outcome, therefore therapeutic drug monitor-ing is recommended. Here we present a liquid chroma-tography-mass spectrometry (LC-MS) method with online extraction based on turbulent flow chromatography for the quantification of the five main components of teico-planin, A2–1, A2–2, A2–3, A2–4, and A2–5.
Methods: After online extraction, analytical
chromatogra-phy was performed on a Hypersil Gold C8 column under acidic conditions. As mass spectrometer, a Q Exactive hybrid instrument was used. Samples were prepared by adding internal standard and subsequent centrifuga-tion. Patient samples (n = 125) that had previously been analyzed using a commercially available immunoassay (QMS® teicoplanin) were re-analyzed by LC-MS.
Results: The imprecision was < 6.9%, inaccuracy between
99.6% and 109%, for both, within- and between-day analy-sis. The method was shown to be free of matrix effects in the relevant time ranges and was compared to a commercially available immunoassay, QMS® teicoplanin from Thermo
Fisher Scientific. The LC-MS assay produced comparable results to the QMS® assay, the correlation coefficient was
0.856 (95% confidence interval 0.800–0.896). LC-MS yielded lower concentrations than the immunoassay as could be demonstrated by the bias of −1.16 mg/L (95% confidence interval −1.90–0.43 mg/L) in the Bland-Altman analysis.
Conclusions: This specific, automated, LC-MS assay for
teicoplanin is suitable for therapeutic drug monitoring.
Keywords: liquid chromatography-mass spectrometry
(LC-MS); online extraction; teicoplanin; therapeutic drug monitoring; turbulent flow chromatography.
*Corresponding author: Dr sc. Daniel M. Mueller, Institute for
Clinical Chemistry, University Hospital Zurich, Raemistrasse 100, 8091 Zurich, Switzerland, Phone: +41 44 2552290,
Fax: +41 44 2554590, E-mail: [email protected]
Arnold von Eckardstein and Lanja Saleh: Institute for Clinical
Chemistry, University Hospital Zurich, Zurich, Switzerland
Introduction
Teicoplanin, discovered back in the 1970s of the last century, is an antibiotic drug belonging to the class of glycopeptides [1]. It was isolated from fermentation broth of an actinomyces species, Actinoplanes teichomyceticus, and is not a pure compound but a mixture of five main components, teicoplanins A2–1, A2–2, A2–3, A2–4, and A2–5 (cf. structure in Figure 1), and one more polar compo-nent, teicoplanin A3, which is the degradation product of teicoplanin A2 [2, 3]. The difference between the five main constituents, A2–1 to A2–5, which account for 90%–95% of the total product [2], is the length, saturation and branch-ing of the fatty acid part of the structure of teicoplanin [3]. Teicoplanin inhibits peptidoglycan synthesis and therefore interacts with bacterial cell wall synthesis of Gram-positive bacteria [2]. During peptidoglycan synthe-sis a part of the structure binds to the terminal D-Ala-D-Ala groups of the muramylpentapeptide, inhibiting further synthesis of the bacterial cell wall [4].
Currently, teicoplanin is registered in most European countries for the intravenous treatment of infections of the heart, bones and joints, skin and soft tissues, airways, and also sepsis. Teicoplanin is also orally applied for the treatment of pseudomembraneous colitis caused by
Clostridium difficile [5, 6].
The correlation between trough levels of teicoplanin and the clinical outcome is supported by several studies [7, 8]. Several authors have highlighted the importance of therapeutic drug monitoring to ensure therapeutic con-centrations of teicoplanin [9–11]. Typically, trough plasma levels < 10 mg/L are regarded as sub-therapeutic; 10–20 mg/L are targeted for ordinary Gram-positive infections; 20–60 mg/L are targeted for severe staphylococcal infec-tions, and ≥ 60 mg/L are regarded as toxic [12].
Several analytical methods are available for thera-peutic drug monitoring (TDM) of teicoplanin in serum or plasma: fluorescence polarization immunoassays (FPIA) [13], homogeneous turbidimetric immunoassays [14], high-performance liquid chromatography (HPLC) [15–18], and liquid chromatography coupled to mass spectrometry
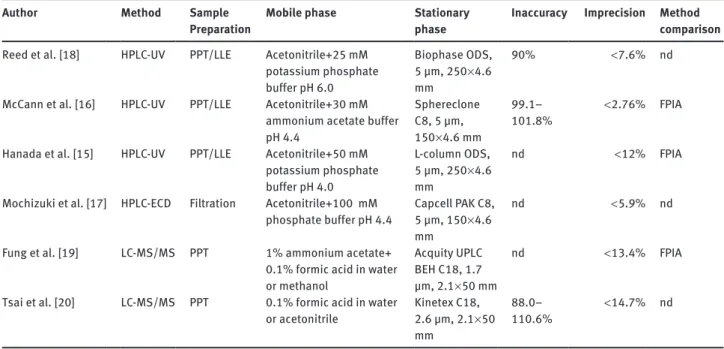
(LC-MS) [19, 20], all of them having their advantages and disadvantages. Compared with immunological methods, chromatographic methods usually are less susceptible to interferences. An overview of the chromatographic methods for the determination of teicoplanin since 1995 can be seen in Table 1. Among the chromatographic
techniques, LC-MS is currently regarded as gold standard because of its superior specificity compared with HPLC with conventional detection. The main disadvantage of LC-MS and chromatographic methods in general, however, is the high manual work load compared to immunoassays, especially for sample preparation. Therefore, we aimed to N H R O O N H O HO O N H O N H O HO O NH OH OH OH OH OH O O OH N H O OH HO OH O NH O Cl O O HO HO OH O O Cl NH O NH2 HO A O T O T O T O T O T B C D E F
Figure 1 Structure of teicoplanin.
(A) Core structure; (B) teicoplanin A2–1; (C) teicoplanin A2–2; (D) teicoplanin A2–3; (E) teicoplanin A2–4; (F) teicoplanin A2–5. R, rest group, displayed under (B–F), T, teicoplanin core structure, displayed under (A).
Table 1 Chromatographic methods published in English for the determination of teicoplanin published since 1995. Author Method Sample
Preparation Mobile phase Stationary phase Inaccuracy Imprecision Method comparison
Reed et al. [18] HPLC-UV PPT/LLE Acetonitrile+25 mM potassium phosphate buffer pH 6.0 Biophase ODS, 5 µm, 250 × 4.6 mm 90% < 7.6% nd McCann et al. [16] HPLC-UV PPT/LLE Acetonitrile+30 mM
ammonium acetate buffer pH 4.4 Sphereclone C8, 5 µm, 150 × 4.6 mm 99.1– 101.8% < 2.76% FPIA Hanada et al. [15] HPLC-UV PPT/LLE Acetonitrile+50 mM
potassium phosphate buffer pH 4.0 L-column ODS, 5 µm, 250 × 4.6 mm nd < 12% FPIA Mochizuki et al. [17] HPLC-ECD Filtration Acetonitrile+100 mM
phosphate buffer pH 4.4 Capcell PAK C8, 5 µm, 150 × 4.6 mm
nd < 5.9% nd Fung et al. [19] LC-MS/MS PPT 1% ammonium acetate+
0.1% formic acid in water or methanol
Acquity UPLC BEH C18, 1.7 µm, 2.1 × 50 mm
nd < 13.4% FPIA Tsai et al. [20] LC-MS/MS PPT 0.1% formic acid in water
or acetonitrile Kinetex C18, 2.6 µm, 2.1 × 50 mm
88.0–
110.6% < 14.7% nd LLE, liquid/liquid extraction; nd, not done; PPT, protein precipitation.
minimize the manual work load needed for sample prep-aration and developed an LC-MS method for the quan-tification of teicoplanin in human plasma with online extraction based on turbulent flow chromatography. As the mass spectrometer, a new hybrid instrument consist-ing of a quadrupol mass filter and a high-resolution Orbit-rap, a so called Q Exactive, was used.
Materials and methods
Chemicals and reagents
Teicoplanin and vancomycin were purchased from Sigma-Aldrich (Buchs, Switzerland). HPLC grade ammonium acetate was purchased from Scharlau (Taegerig, Switzerland), formic acid (purum p.a.) from Merck (Darmstadt, Germany), and zinc sulfate monohydrate (purum p.a.) from Sigma-Aldrich (Buchs). Commercial calibrators and qual-ity controls were obtained from Thermo Fisher Scientific/Microgenics (Passau, Germany).
All solvents were of LC-MS grade. Methanol and 2-propanol were purchased from Seelze GmbH (Seelze, Germany), acetonitrile from Romil (Cambridge, UK), and acetone from Merck (Darmstadt). Purified water was obtained using a central water purification instal-lation (Burckhalter AG, Worblaufen, Switzerland).
LC-MS analysis
As the mass spectrometer, a Q Exactive hybrid instrument was used (Thermo Fisher Scientific, Reinach, Switzerland), controlled by Tune (version 2.2 SP1) and XCalibur software (version 2.2 SP 1.48; all Thermo Fisher Scientific).
As the ionization interface, electrospray ionization (ESI) was used with the following parameters: sheath gas 60 arbitrary units (AU), aux gas 20 AU, sweep gas 5 AU, and spray voltage 4 kV. The capillary temperature was maintained at 270°C.
Detection was done in the negative full-scan mode with a reso-lution of 70,000 full width at half maximum (FWHM; calculated for m/z 200). For quantification, extracted ion chromatograms with a window of 30 ppm of the doubly charged formic acid adduct of the teicoplanins and the doubly charged ion of vancomycin were used. The following calculated exact masses were used: m/z 960.76880 for teicoplanin A2–1, m/z 961.77594 for teicoplanin A2–2 and A2–3, m/z 968.78412 for teicoplanin A2–4 and A2–5 and m/z 722.70886 for the internal standard vancomycin. The masses of teicoplanin A2–1 to A2– 5 were summed up for calibration and calculation of the results. Data analysis was performed by LCQuan (version 2.7.0 SP1.28, Thermo Fisher Scientific).
The HPLC system consisted of a transcend TLX-1 HTLC online extraction system, equipped with two Accela 600 pumps, an HTC PAL autosampler and a valve interface module with built-in switch-ing valves, all controlled by Aria software (version 1.6.2, all Thermo Fisher Scientific).
The following eluents were used: 10 mmol/L ammonium acetate in water + 0.1% (v/v) formic acid (eluent A), 10 mmol/L ammonium
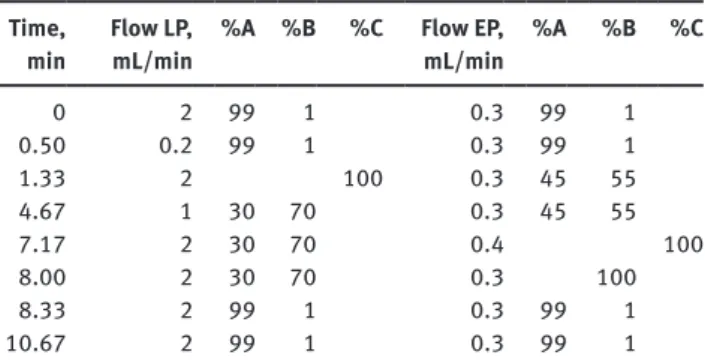
Table 2 LC-gradient used in detail. The gradient shape was linear.
The following eluents were used: 10 mmol/L ammonium acetate in water + 0.1% (v/v) formic acid (eluent A), 10 mmol/L ammonium acetate in methanol/acetonitrile 50/50 v/v + 0.1% (v/v) formic acid (eluent B), acetone/acetonitrile/2-propanol 1/1/1 v/v/v (eluent C).
Time,
min Flow LP, mL/min %A %B %C Flow EP, mL/min %A %B %C
0 2 99 1 0.3 99 1 0.50 0.2 99 1 0.3 99 1 1.33 2 100 0.3 45 55 4.67 1 30 70 0.3 45 55 7.17 2 30 70 0.4 100 8.00 2 30 70 0.3 100 8.33 2 99 1 0.3 99 1 10.67 2 99 1 0.3 99 1 EP, eluting pump, used for the analytical chromatography; LP, loading pump, used for the online extraction; %A, %B, %C, composition of the eluents.
acetate in methanol/acetonitrile 50/50 v/v + 0.1% (v/v) formic acid (eluent B), acetone/acetonitrile/2-propanol 1/1/1 v/v/v (eluent C). For turbulent flow chromatography online extraction, a Cyclone column (50 × 0.5 mm) was used. Analytical separation was achieved on a Hypersil Gold C8 column (100 × 3 mm, 3 µm particle size). Chromatog-raphy was performed at room temperature (approximately 24°C), and the LC flow was diverted into waste between 0 and 1.5 min and 8 and 10.7 min, using a divert valve. The LC method is summarized in Table 2.
Sample preparation
One hundred µL of a commercial calibrator, a commercial quality control or a patient sample were crushed with 100 µL of a precipitat-ing solution consistprecipitat-ing of methanol/acetonitrile/aqueous zinc sulfate 0.1 mol/L 80/10/10 v/v/v containing the internal standard vancomy-cin at a concentration of 0.1 g/L. Samples were thoroughly vortexed and centrifuged at 11700 × g for 10 min at 4°C. The clear supernatant was transferred into autosampler vials, which were stored in the cooled sample stack at 10°C until analysis. Thirty microliters were injected into the system for LC-MS analysis.
Method validation
The commercially available six calibrators ranging from 0 to 100 mg/L were prepared as described above. The standard curves were plotted as the summed up peak area ratio of the teicoplanins A2–1 to A2–5 to the internal standard versus the concentration using a quadratic fit.
Blank matrix samples from six different sources were analyzed to test for the specificity of the method.
All three quality control levels were analyzed five times on the same day to calculate within-day inaccuracy and imprecision as well as on five different days to calculate between-day inaccuracy and imprecision. Imprecision was additionally determined using pooled patient samples, which were analyzed five times on the same day to calculate within-day imprecision as well as on five different days to calculate between-day imprecision.
To estimate the limit of quantification, a signal-to-noise ratio of at least 10 achievable on five different days was taken.
Matrix effects were evaluated using the post-column infusion method described by Bonfiglio et al. [21]. An aqueous solution con-taining teicoplanin and vancomycin, each at a concentration of 20 mg/L, was infused into the column effluent at a flow rate of 10 µL/ min. Concurrently, six samples prepared as described above – with the exception of a precipitation solution without internal standard – containing neither teicoplanin nor vancomycin have been injected by the autosampler. The selected samples included hemolytic, icteric and lipemic samples. Resulting chromatograms were examined for regions showing ion suppression or enhancement.
Samples were stored according to the instructions by the com-mercial, CE-marked kit up to maximum 7 days between 2 and 8°C. Therefore, sample stability was not evaluated separately. Post-prepa-ration stability was tested by re-injecting previously prepared stand-ards stored in the cooled autosampler stack (10°C) and comparing the calculated area ratios to the ones of freshly prepared standards.
Method comparison with QMS
®teicoplanin
assay
Teicoplanin was measured with a commercially available homoge-neous particle-enhanced turbidimetric immunoassay (QMS® teico-planin, Thermo Fisher Scientific/Microgenics, Passau, Germany),
performed on a Roche cobas 8000 clinical-chemistry autoanalyzer (Roche Diagnostics, Rotkreuz, Switzerland). The method was used as the reference method for the newly developed LC-MS method.
In total 125 patient samples sent to the laboratory for the quan-tification of teicoplanin were archived after routine analysis by immunoassay according to the kit manufacturer’s instructions for a maximum of 7 days at 2–8°C before anonymization and re-analysis with LC-MS. A total of seven proficiency testing samples from Instand (Düsseldorf, Germany) and UK NEQAS (Sheffield, UK), already ana-lyzed with the immunological method, were also re-anaana-lyzed using the new method.
Results
LC-MS analysis
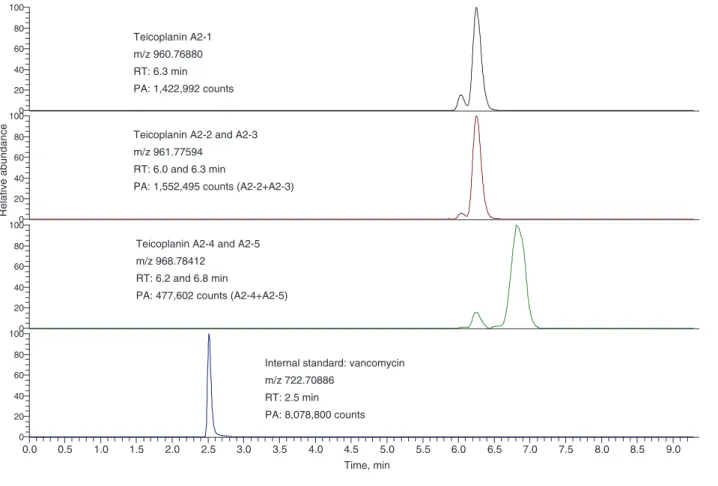
A representative chromatogram of teicoplanin is shown in Figure 2. For illustrative purposes, teicoplanin A2–1, A2–2 and A2–3, A2–4 and A2–5, and vancomycin are depicted on separate mass traces. Distinction between A2–1, A2–2 and A2–3, A2–4 and A2–5, was possible because of their dif-ferent mass-to-charge ratio. As described in the Methods
0.0 0.5 1.0 1.5 2.0 2.5 3.0 3.5 4.0 4.5 5.0 5.5 6.0 6.5 7.0 7.5 8.0 8.5 9.0 Time, min 0 20 40 60 80 1000 20 40 60 80 1000 20 40 60 80 100 Relative abundance 0 20 40 60 80 100
Teicoplanin A2-2 and A2-3 m/z 961.77594
RT: 6.0 and 6.3 min
PA: 1,552,495 counts (A2-2+A2-3) Teicoplanin A2-1
m/z 960.76880 RT: 6.3 min PA: 1,422,992 counts
Teicoplanin A2-4 and A2-5 m/z 968.78412
RT: 6.2 and 6.8 min
PA: 477,602 counts (A2-4+A2-5)
Internal standard: vancomycin m/z 722.70886
RT: 2.5 min PA: 8,078,800 counts
Figure 2 Representative chromatogram of teicoplanin A2–1 to A2–5.
For illustrative purposes, teicoplanin A2–1, A2–2 and A2–3, A2–4 and A2–5, and vancomycin are depicted on separate mass traces. m/z, mass-to-charge ratio, PA, peak area count; RT, retention time.
section, teicoplanin A2–1 to A2–5 were summed up for calibration. Retention times were between 6.0 and 6.8 min for the teicoplanins and 2.5 min for vancomycin.
Method validation
Calibration was reproducible with correlation coefficients for the quadratic fits consistently > 0.995 in the between-day analysis. Carryover was always < 1% in the blank sample analyzed immediately after the highest calibrator (100 mg/L) in the between-day analysis.
In the six blank matrix samples, no background signal was observed, demonstrating good specificity of high-resolution mass spectrometry.
The results for inaccuracy and imprecision deter-mined with both, the commercially available internal quality control material and pooled patient samples, are summarized in Table 3. Using the commercially available internal quality control material, maximal imprecision amounted to 3.66% and inaccuracy ranged between 104% and 109% for the within day-analyses; for between-day analyses, the numbers for imprecision and inaccuracy read < 2.40% and 99.6–105%, respectively. Using pooled patient samples, the imprecision was < 3.87% for within-day and < 6.88% for between-within-day analysis.
Defined by a signal-to-noise ratio of 10, the limit of quantification was estimated to be 1 mg/L.
In none of the six analyzed samples for the evaluation of matrix effects, ion suppression or enhancement was detected in the relevant time ranges where either one of the teicoplanins or vancomycin eluted.
Table 3 Inaccuracy and imprecision data of the method for within-
and between-day analysis.
Concentration, mg/L Inaccuracy, % Imprecision, % Within-day 10.4 106 (n = 6) 3.66 (n = 6) (commercial QC) 35.8 109 (n = 6) 2.58 (n = 6) 76.6 104 (n = 6) 1.68 (n = 6) Within-day 7.52 – 3.87 (n = 5) (pooled patient samples) 22.0 – 3.68 (n = 5) Between-day 10.4 101 (n = 5) 2.40 (n = 5) (commercial QC) 35.8 105 (n = 5) 1.75 (n = 5) 76.6 99.6 (n = 5) 2.01 (n = 5) Between-day 7.52 – 6.88 (n = 5) (pooled patient samples) 22.0 – 5.67 (n = 5)
The table is split into values determined using the commercially available internal quality control (QC) material and values determined using pooled patient samples.
Post-preparation stability experiments showed that prepared standards stored in the cooled autosampler stack were stable for at least 3 days, deviating < 15% com-pared with freshly precom-pared standards.
Method comparison with QMS
®Teicoplanin
assay
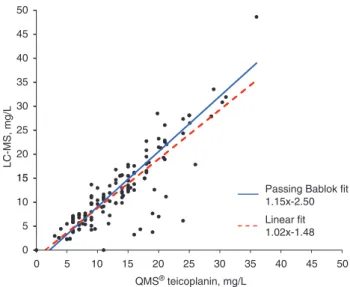
A linear regression analysis as well as a Passing-Bablok fit of the immunological QMS® and the newly developed
LC-MS methods can be seen in Figure 3. The coefficient of correlation was 0.856 (95% confidence interval: 0.800– 0.896). Teicoplanin concentrations measured with LC-MS were a bit lower than those obtained with the immuno-logical method. Upon Bland-Altman analysis the bias amounted to −1.16 mg/L (95% confidence interval: −1.90– 0.43 mg/L) (Figure 4).
The proficiency testing samples which were re-ana-lyzed with the new LC-MS method were within the accept-ance range of the testing schemes. The mean bias of the LC-MS method compared to the mean of the immunologi-cal methods was −8.29%.
Discussion
In the clinical routine laboratory practice, teicoplanin is usually measured by immunoassays [10]. The general dis-advantage of immunoassays used for TDM is their suscepti-bility to interferences and cross-reactions. In addition and
40 45 50 30 35 15 20 25 LC-MS, mg/L 5 10 15
Passing Bablok fit 1.15x-2.50 Linear fit 1.02x-1.48 0 0 5 10 15 20 25 30 35 40 45 50 QMS® teicoplanin, mg/L
Figure 3 Passing-Bablok (solid line) and linear fit (dotted line) for
the patient sample comparison (n = 125) between the immunologi-cal method, QMS® teicoplanin, and the newly developed LC-MS method.
more specifically, teicoplanin immunoassays have been reported to suffer from high imprecision especially at low concentrations around 10 mg/L which is the clinical deci-sion cut-off [22]. To overcome these problems, alternative methods may be used, e.g., chromatography techniques. Previously, teicoplanin was measured by HPLC, usually UV detection [16, 23–25]. However, LC-MS is increasingly avail-able for TDM in clinical laboratories, as it offers superior specificity and sensitivity [26]. In this paper, we describe the successful development and validation of an LC-MS based method that allows the quantification of teicoplanin in patient samples under clinical routine conditions.
In clinical routine immunoassays are usually used for the TDM of teicoplanin, which was also the case in our laboratory before, therefore we have chosen to compare our newly developed LC-MS method to an immunoassay. The comparability between this immunoassay, the QMS®
teicoplanin, and our newly developed LC-MS method is moderate. However, the correlation coefficient r = 0.856 (r2 = 0.73) observed by us resembles the previously reported
correlation between teicoplanin measurements by another LC-MS method and FPIA (r2 = 0.86) [19]. Possible
reasons for the relatively poor correlations include differ-ent cross-reactivities of the antibodies with the differdiffer-ent teicoplanins as well as interferences with the immunoas-say. Another influencing factor is the high imprecision of the used immunoassay, especially in the lower therapeu-tic concentration range ( < 20 mg/L), where we analyzed most of the patient samples in this method comparison.
Differences in results measured with different methods are a well-known phenomenon in clinical chemistry,
15 5 10 -5 0 Identity -15 -10 Bias (-1.16) 95% Limits of agreement (-9.31 to 6.98) -20 0 10 20 30 40 50 Difference (LCMS -QMS ® teicoplanin), mg/L
Mean of QMS® teicoplanin and LC-MS, mg/L
Figure 4 Bland-Altman plot for the patient sample comparison
(n = 125) between the immunological method, QMS® teicoplanin, and the newly developed LC-MS method.
Depicted is also the theoretical line of identity (solid line), the calculated bias (dotted line) as well as the 95% limits of agreement (dashed line).
either for endogenous (e.g., cortisol [27], or Vitamin D [28]), or exogenous compounds (e.g., cyclosporine [29]). Therefore, care has to be taken to clearly separate both methods on the clinical reports in order to enable correct trend analyses, which was done for our newly developed LC-MS method.
However, a more independent comparison of system-atic differences between methods is only possible by exter-nal quality control schemes. The mean bias of our LC-MS method versus immunological methods was only −8.29%.
In our study like in a previous one [25] the correlations between immunological and chromatographic measure-ments are closer when the sum of all teicoplanins rather than the main component, teicoplanin A2–2 is taken as the comparator (data not shown). Summing up of the peak areas of all teicoplanins is possible because the sub-composition of teicoplanin is regulated by governmental bodies and therefore always similar [30]. The teicoplanin preparation used for the commercial calibrators complies with this regulation. The most likely reason for the better correlation between immunological and chromatographic measurements when using the sum of all teicoplanins rather than only the main component is the cross-reac-tivity of the antibodies used in immunological methods, which makes the assay not specific for a distinct teicopla-nin. In agreement with other authors [25], we decided to integrate the peak areas of all teicoplanins for the meas-urement of total teicoplanin, A2–1 to A2–5, because the thereby obtained stronger correlation with the immu-nological method facilitates the introduction of the new method into clinical practice. However, our method, like another previously described chromatographic method [23], shows a systematic negative bias compared with the immunological method.
Compared to the immunological methods, the main advantage of our newly developed LC-MS method is the much better precision in the lower, therapeutically impor-tant range. The imprecision of the QMS® teicoplanin assay,
implemented on the Roche cobas® 8000, was as high as
21.1% for the within-day assay and 9.5% for the between-day assay at a concentration of 8.0 mg/L. With variations below 3.7% at a concentration of 10.4 mg/L (cf. Table 3) the intra- and inter-assay imprecisions of the LC-MS method were much lower.
To the best of our knowledge, there are currently only two other published applications of LC-MS to TDM of teicoplanin [19, 20]. Our method is the first method using online extraction based on turbulent flow chromatog-raphy. This technique allows advanced automation and minimizes error- and imprecision-prone manual handling steps. A further advantage of this technique towards the
protein precipitation step used by Fung et al. [19] and Tsai et al. [20] is the higher purity of the extract which reduces the susceptibility of the method to matrix effects. In fact we noticed during method development that protein pre-cipitation alone does not eliminate matrix effects affect-ing the peaks of interest. By contrast, the application of the method with online extraction presented in this paper to more than 200 “real world” clinical samples has never raised any suspicion of matrix effects. As our method acquires data by full scan mode, it will detect such matrix effects much better than LC-MS methods using multiple reaction mode (MRM) on a triple quadrupole mass spec-trometer, which nowadays are frequently applied to TDM. Regarding the huge number of potential endo- and exogenous interferences, the analysis of only six matrix samples from independent sources cannot be considered as proof of specificity, although still recommended by the FDA guidance for bioanalytical method validation [31]. However, the high resolution of 70,000 (FWHM), the high mass of the analytes and the ionization in negative ionization mode drastically reduce the risk of interferences. In our experi-ence, the specificity of a resolution of 70,000 (FWHM) is at least comparable with the specificity of, e.g., a triple stage quadrupole mass spectrometer operated in the MRM mode.
Compared with the triple stage quadrupole apparatus available in our laboratory (TSQ Quantum Access Max, Thermo Fisher Scientific), the Q Exactive was much more sensitive for the quantification of teicoplanin. Due to the fact that acquisition is performed in full-scan compared to MRM, a key advantage of the Q Exactive is its increased flexibility which is especially useful during method development or for troubleshooting of specific samples complicated by interferences or matrix effects. The main drawback of this technology is its price, which is still sub-stantially higher than that of a comparable triple stage quadrupole instrument. Therefore, it is not yet widely used in TDM laboratories. However, in our opinion, due to its flexibility and sensitivity, the Q Exactive is a welcome addition for work also in a routine clinical TDM laboratory.
Post-preparation stability experiments showed that teicoplanin was stable for at least 3 days stored in the cooled autosampler stack, a fact which is very beneficial for application of the assay in a routine laboratory.
Compared with the method of Fung et al. [19] and Tsai et al. [20], our method shows a better precision ( < 6.9% vs. < 13.4% for Fung et al. [19] and < 12.6% for Tsai et al. [20] for between-day analysis). However, the run time of our method (using HPLC) is significantly longer compared with the method of Fung et al. [19] (using UPLC): 10.7 min vs. 2.8 min. The runtime of the method of Tsai et al. [20] is with 7.5 min in the same range as that of our method. Both
our method and the one described by Fung et al. [19] have a lower limit of quantification of 1 mg/L. The method of Tsai et al. [20] indicates lower limits of quantification (0.14–0.32 mg/L, depending on the sub-component of teicoplanin). However, it is questionable whether this is clinically rel-evant, as therapeutic ranges are significantly higher.
Using a suitable internal standard for the determina-tion of teicoplanin is still problematic, as described also by Fung et al. [19]. LC-MS allows the use of stable isotope labeled compounds as the ideal internal standards. However, to the best of our knowledge, as yet there is no labeled teicoplanin commercially available. The choice of our internal standard, vancomycin is not optimal, as van-comycin is also therapeutically used. However, because vancomycin and teicoplanin belong to the same group of antibiotics, it is not reasonable to use them concomi-tantly. There are some situations where the therapy may be changed from vancomycin to teicoplanin. However, TDM is only recommended in the steady-state of teicopla-nin dosage, leaving usually enough time for vancomycin to be excreted completely from the body. Nevertheless, the peak of the internal standard must always be examined very carefully and the peak area count compared to the one of the standards and quality control in order to detect patient samples containing relevant concentrations of vancomycin. If relevant concentrations of vancomycin are detected, results must be calculated without the use of the internal standard, which is also indicated on the laboratory report. Another analytical problem is the dif-ference in retention time between vancomycin and the teicoplanins. However, as could be demonstrated by the matrix effects experiments, there is for both time ranges no relevant matrix effect, which would be the major cause for differences in measurement variations between vanco-mycin and the teicoplanins. We also tested other potential internal standards for the determination of teicoplanin. Due to their structural difference some led to excessive imprecision. Additional differences in polarity led to even larger deviations in the retention time between the inter-nal standard and the teicoplanins as compared to van-comycin. To conclude, we developed an automated and specific LC-MS method using online extraction for the TDM of teicoplanin. Compared to a commercially avail-able immunoassay, QMS® teicoplanin, the LC-MS method
yields systematically lower levels of teicoplanin. The new LC-MS method proved its suitability for TDM of teicopla-nin both upon clinical application and proficiency testing. In our clinical laboratory, we switched TDM of teicoplanin to the newly described LC-MS method because of its supe-rior performance regarding imprecision, especially in the lower, therapeutically relevant range.
Conflict of interest statement
Authors’ conflict of interest disclosure: The authors
stated that there are no conflicts of interest regarding the publication of this article.
Research funding: None declared.
Employment or leadership: None declared. Honorarium: None declared.
Received November 12, 2013; accepted December 12, 2013; previ-ously published online January 17, 2014
References
1. Parenti F, Beretta G, Berti M, Arioli V. Teichomycins, new antibiotics from Actinoplanes teichomyceticus Nov. Sp. I. Description of the producer strain, fermentation studies and biological properties. J Antibiot (Tokyo) 1978;31:276–83. 2. Somma S, Gastaldo L, Corti A. Teicoplanin, a new antibiotic
from Actinoplanes teichomyceticus nov. sp. Antimicrob Agents Chemother 1984;26:917–23.
3. Borghi A, Antonini P, Zanol M, Ferrari P, Zerilli LF, Lancini GC. Isolation and structure determination of two new analogs of teicoplanin, a glycopeptide antibiotic. J Antibiot (Tokyo) 1989;42:361–6.
4. Reynolds PE. Structure, biochemistry and mechanism of action of glycopeptide antibiotics. Eur J Clin Microbiol Infect Dis 1989;8:943–50.
5. Swissmedic Drug Information Database. Available from: www. swissmedicinfo.ch. Accessed on 22 June, 2013.
6. European Medicines Agency. Available from: http://www.ema. europa.eu/ema/. Accessed on 22 June, 2013.
7. Harding I, MacGowan AP, White LO, Darley ES, Reed V. Teicoplanin therapy for Staphylococcus aureus septicaemia: relationship between pre-dose serum concentrations and outcome. J Antimicrob Chemother 2000;45:835–41. 8. MacGowan A, White L, Reeves DS, Harding I. Retrospective
review of serum teicoplanin concentrations in clinical trials and their relationship to clinical outcome. J Infect Chemother 1996;2:197–208.
9. Boulamery A, Venisse N, Le Guellec C. Level of evidence for therapeutic drug monitoring of teicoplatin. Therapie 2011;66:45–50.
10. Begg EJ, Barclay ML, Kirkpatrick CM. The therapeutic monitoring of antimicrobial agents. Br J Clin Pharmacol 2001;52(Suppl 1):35S–43S.
11. Wilson AP. Clinical pharmacokinetics of teicoplanin. Clin Pharmacokinet 2000;39:167–83.
12. Tobin CM, Lovering AM, Sweeney E, MacGowan AP. Analyses of teicoplanin concentrations from 1994 to 2006 from a UK assay service. J Antimicrob Chemother 2010;65:2155–7.
13. Rybak MJ, Bailey EM, Reddy VN. Clinical evaluation of
teicoplanin fluorescence polarization immunoassay. Antimicrob Agents Chemother 1991;35:1586–90.
14. Dailly E, Fraissinet F, Deslandes G, Bouquie R, Jolliet P. Evaluation of the QMS(R) Teicoplanin Immunoassay (ThermoFisher Scientific) on Cobas(R) 8000 System (Roche Diagnostics) and comparison to fluorescence polarization immunoassay for the determination of teicoplanin concen-trations in human plasma. J Clin Lab Anal 2013;27:96–8. 15. Hanada K, Kobayashi A, Okamori Y, Kimura T, Ogata H. Improved
quantitative determination of total and unbound
concen-trations of six teicoplanin components in human plasma by high performance liquid chromatography. Biol Pharm Bull 2005;28:2023–5.
16. McCann SJ, White LO, Keevil B. Assay of teicoplanin in serum: comparison of high-performance liquid chromatography and fluorescence polarization immunoassay. J Antimicrob Chemother 2002;50:107–10.
17. Mochizuki N, Ohno K, Shimamura T, Furukawa H, Todo S, Kishino S. Quantitative determination of individual teicoplanin components in human plasma and cerebrospinal fluid by high-performance liquid chromatography with electrochemical detection. J Chromatogr B Analyt Technol Biomed Life Sci 2007;847:78–81.
18. Reed MD, Yamashita TS, Myers CM, Blumer JL. The pharma-cokinetics of teicoplanin in infants and children. J Antimicrob Chemother 1997;39:789–96.
19. Fung FH, Tang JC, Hopkins JP, Dutton JJ, Bailey LM, Davison AS. Measurement of teicoplanin by liquid chromatography-tandem mass spectrometry: development of a novel method. Ann Clin Biochem 2012;49:475–81.
20. Tsai IL, Sun HY, Chen GY, Lin SW, Kuo CH. Simultaneous quantification of antimicrobial agents for multidrug-resistant bacterial infections in human plasma by ultra-high-pressure liquid chromatography-tandem mass spectrometry. Talanta 2013;116:593–603.
21. Bonfiglio R, King RC, Olah TV, Merkle K. The effects of sample preparation methods on the variability of the electrospray ionization response for model drug compounds. Rapid Commun Mass Spectrom 1999;13:1175–85.
22. Bourget P, Lesne-Hulin A, Sertin A, Maillot A, Alaya M, Martin C. Fluorescence polarization immunoassay: does it always represent a reliable method to monitor treatment with teicoplanin? Comparison with data obtained by high-performance liquid chromatography. Int J Pharmaceut 1997;146:174.
23. Awni WM, St Peter WL, Guay DR, Kenny MT, Matzke GR. Teicoplanin measurement in patients with renal failure: comparison of fluorescence polarization immunoassay, microbi-ological assay, and high-performance liquid chromatographic assay. Ther Drug Monit 1991;13:511–7.
24. Bourget P, Bouton V, Lesne-Hulin A, Amstutz P, Benayed M, Benhamou D, et al. Comparison of high-performance liquid chromatography and polyclonal fluorescence polarization immunoassay for the monitoring of midazolam in the plasma of intensive care unit patients. Ther Drug Monit 1996;18:610–9.
25. Davani S, Berard M, Royer B, Kantelip JP, Muret P. Comparison of fluorescence polarization immunoassay and high-performance
liquid chromatography methods for assay of teicoplanin: can correlation be improved? Pathol Biol (Paris) 2004;52:584–8. 26. Adaway JE, Keevil BG. Therapeutic drug monitoring and LC-MS/MS.
J Chromatogr B Analyt Technol Biomed Life Sci 2012;883–4: 33–49.
27. Taylor RL, Machacek D, Singh RJ. Validation of a high-throughput liquid chromatography-tandem mass spectrometry method for urinary cortisol and cortisone. Clin Chem 2002;48:1511–9.
28. Roth HJ, Schmidt-Gayk H, Weber H, Niederau C. Accuracy and clinical implications of seven 25-hydroxyvitamin D methods compared with liquid chromatography-tandem
mass spectrometry as a reference. Ann Clin Biochem 2008;45:153–9.
29. Soldin SJ, Steele BW, Witte DL, Wang E, Elin RJ. Lack of specificity of cyclosporine immunoassays. results of a College of American Pathologists Study. Arch Pathol Lab Med 2003;127:19–22. 30. Assessment report – Teicoplanin. Available from: http://
www.ema.europa.eu/docs/en_GB/document_library/
Report/2013/04/WC500142229.pdf. Accessed on 21 March, 2013. 31. FDA. Guidance for Industry, Bioanalytical Method Validation.
Available from: http://www.fda.gov/downloads/Drugs/ GuidanceComplianceRegulatoryInformation/Guidances/ UCM070107.pdf. Accessed on 25 October, 2013.