Tracking of Fluorescently Labeled Polymer Particles Reveals Surface
E
ffects during Shear-Controlled Aggregation
Stefano Caimi,
†Alberto Cingolani,
†Baptiste Jaquet,
†Marc Siggel,
†Marco Lattuada,
‡and Massimo Morbidelli
*
,††Department of Chemistry and Applied Bioscience, Institute for Chemical and Bioengineering, ETH Zurich, 8093 Zurich, Switzerland
‡Department of Chemistry, University of Fribourg, Chemin du Musée 9, 1700 Fribourg, Switzerland
ABSTRACT: Surface chemistry is believed to be the key
parameter affecting the aggregation and breakage of colloidal
suspensions when subjected to shear. To date, only a few works dealt with the understanding of the role of the physical
and chemical properties of the particles’ surface upon
aggregation under shear. Previous studies suggested that
surface modifications strongly affect polymer particles’
adhesion, but it was very challenging to demonstrate this
effect and monitor these alterations upon prolonged exposure
to shear forces. More importantly, the mechanisms leading to
these changes remain elusive. In this work, shear-induced aggregation experiments of polymer colloidal particles have been
devised with the specific objective of highlighting material transfer and clarifying the role of the softness of the particle’s surface.
To achieve this goal, polymer particles with a core−shell structure comprising fluorescent groups have been prepared so that the
surface’s softness could be tuned by the addition of monomer acting as a plasticizer and the percentage of fluorescent particles
could be recorded over time via confocal microscopy to detect eventual material transfer among different particles. For the first
time, material exchange occurring on the soft surface of core−shell polymer microparticles upon aggregation under shear was
observed and proved. More aptly, starting from a 50% labeled/nonlabeled mixture, an increase in the percentage of particles
showing afluorescent signature was recorded over time, reaching a fraction of 70% after 5 h.
1. INTRODUCTION
The process of aggregation and breakage of polymer particles under shear, which is a very relevant operation in the
production of many polymeric materials,1 is highly influenced
not only by the physical parameters of the system (i.e., solid
and volume fraction, shear regime, and particles’ size)2−6 but
also by the surface chemistry and properties of the particles
themselves.7−10 Our ability to quantitatively describe the
behavior of aggregating particles exposed to shear forces is only limited to simple systems, behaving strictly as non-deformable sticky spheres. As soon as the particles present complex surface features, such as advanced functionality and
composition, the core−shell architecture, and the presence of
plasticizers that soften the particles’ shells, they show
characteristic and peculiar behaviors difficult to rationalize.7A
particularly relevant example is surface nanoroughness, which
has already been shown to strongly affect polymer particles’
adhesion.11,12Shear aggregation experiments carried out in our
group on certain polystyrene particles have led us to hypothesize that, upon aggregation, their surface roughness was changing as a function of time, leading to completely
different time evolutions of clusters’ morphology and to
progressively decrease the average cluster sizes, instead of
commonly encountered steady-state conditions.9 Indeed, the
increase in surface roughness leads to weaker bonds among particles within clusters, thus progressively increasing their
breakage rate with time. Despite the importance of such effects,
it is generally challenging to experimentally demonstrate not only the presence of surface roughness but even more a
modification of this parameter upon prolonged exposure to
shear forces. More importantly, the mechanisms that lead to these changes remain elusive. One of the proposed mechanisms is plastic deformation, but what causes it still needs to be fully understood. Along with this line, molecular dynamic simu-lations have highlighted the possibility of some material transfer between particles as a result of repeated aggregation/breakage
events, with small chunks of polymer being torn off from the
surface and transferred to other particles.13 Moreover, the
phenomenon of chain exchange at a molecular level has been
previously observed in different systems.14,15In this work, we
have devised a novel and elegant strategy to experimentally prove the deformation of polymer particles exposed to shear forces, causing their aggregation and subsequent breakage. The surface alteration mechanism of suitably engineered colloidal
particles was revealed by means offluorescent microscopy. This
technique has the potential to accurately visualize colloidal clusters when they are made of large enough primary
particles.16 Two sets of experiments were performed in this
http://doc.rero.ch
Published in "Langmuir 33 (49): 14038–14044, 2017"
which should be cited to refer to this work.
work. First, small polymer colloidal nanoparticles with slightly cross-linked polystyrene shell, swollen with styrene (STY), which acts as a softener, were exposed to shear-controlled aggregation under fully destabilized conditions. It was found that the system did not reach a stable steady-state size, as commonly observed with hard particles, but showed a decrease in the average cluster size over time while keeping a constant fractal dimension (i.e., maintaining the cluster structure unaltered) and never reaching a steady-state condition. Among the various factors hypothesized to explain this behavior, an alteration of the surface, owing to the softness of the outer layer induced by the monomer, seemed the most
plausible and consistent with our previous findings.9 In the
second set of experiments, a different system was used, consisting of much larger particles, visible through an optical microscope, featuring an architecture similar to the smaller
particles, but incorporating afluorescent monomer. Using this
second system and working with a mixture of fluorescently
labeled and nonlabeled particles, we took advantage of fluorescence to monitor the surface alteration of the particles. In particular, we tracked whether some polymer could be displaced from a particle to another upon repeated aggregation and breakage events by simply recording the percentage over
time of particles showing fluorescence. It was demonstrated
that substantial material exchange occurs between particles if their surface is sufficiently soft, which indeed is the case only in the presence of swelling monomer. Not surprisingly, the presence of a soft layer around the particles was also found to
promote their adhesion upon contact.17Keeping in mind that
material exchange might not be the only mechanism responsible for surface alterations of polymer particles, this
work proves for the first time that material exchange takes
place, thus providing a novel insight into the importance of particle architecture and surface properties on shear aggrega-tion.
2. EXPERIMENTAL SECTION
2.1. Materials. Divinylbenzene (DVB), STY, rhodamine B (Rh B), azobis(isobutyronitrile) (AIBN), sodium dodecyl sulfate (SDS), potassium peroxydisulfate (KPS), polyvinylpyrrolidone (PVP; 40k MW), dicyclohexylcarbodiimide (DCC), 4-(dimethylamino)-pyridine (DMAP), 2-hydroxyethyl methacrylate (HEMA), magnesium chloride, and acetonitrile were purchased from Sigma-Aldrich and used without further purification. Ethanol was purchased from Fluka and used without further purification. Ultrapure water was prepared by a Millipore Synergy water purification system. Nuclepore filters with 0.45μm pore size for dialysis were purchased from Whatman.
2.2. Synthesis of Colloidal Core−Shell Polymer Nano-particles. The synthesis of the polymer nanoparticles was carried out in a LabMax Automatic Reactor from Mettler-Toledo equipped with a 4 L jacketed glass reactor. The preparation involved two steps: core synthesis and shell covering. The former was made of 20% cross-linked particles of STY and DVB, produced via semibatch emulsion polymerization, whereas the latter was obtained by a seeded emulsion polymerization, using 20% cross-linked particles as a seed, forming a 1% cross-linked shell around the core.
2.2.1. Synthesis of the Core. A mixture of water and surfactant (SDS) was initially charged into a glass reactor, and the temperature was set at 70°C using the oil heating jacket [initial charge (IC) as reported inTable 1]. When the reactor temperature reached the set point (in approximately 25 min), a solution of water and initiator (KPS) was injected through a septum directly into the reactor [initiator solution (IS)]. To guarantee starved conditions, an emulsion of STY, DVB, water, and surfactant was fed over the reaction time using a syringe pump [continuous feed (CF) as reported inTable 1]. A solution of water and KPS was continuously fed using a second
syringe pump, to guarantee the constant presence of the initiator [initiator feed (IF)]. When the reaction time was over, the system was kept at 70°C for 1 h, to ensure complete conversion of the monomer. The monomer conversion and the particle size evolution were followed by gravimetric analysis and dynamic light scattering (DLS), respectively. The exact quantities of the chemicals used in the particle synthesis are reported inTable 1.
2.2.2. Synthesis of the Shell. To form a soft shell onto the core particles, the latter was added a second time into the LabMax together with water and surfactant (IC as reported inTable 2). The previously
synthesized latex worked as a seed for the second polymerization step. When the reactor temperature reached the set point of 70°C, a water solution of initiator KPS was added to the jacketed reactor (IS). During the reaction time, a mixture of STY and DVB was fed to achieve a radially homogeneous cross-link density18(CF as reported in Table 2). Again, the monomer conversion and the average particle size were determined by gravimetric analysis and DLS, respectively. The exact quantities of the chemicals used in the synthesis of the shell are reported inTable 2.
2.3. Synthesis and Purification of the Rh B-HEMA Precursor. The synthesis method was adapted from the study of Cova et al.19The Rh B-HEMA precursor was synthesized by Steglich esterification. In a flask, 4 g of Rh B was dissolved in 80 mL of acetonitrile. After full dissolution, 1.3 g of HEMA was added to the reaction mixture under stirring. In a secondflask, 1.72 g of DCC and 52 mg of DMAP were mixed in 80 mL of acetonitrile and added dropwise to the solution within 20 min. The reaction was run for 24 h at 40 °C. The crude product was filtered to remove the precipitated byproduct. The obtained solution was then purified by preparative chromatography using a C18 reversed-phase column and acetonitrile/water mixture as the mobile phase. The purity of the product was confirmed by mass spectroscopy (LC−ESI−TOF) identifying a peak at 555 m/z. This
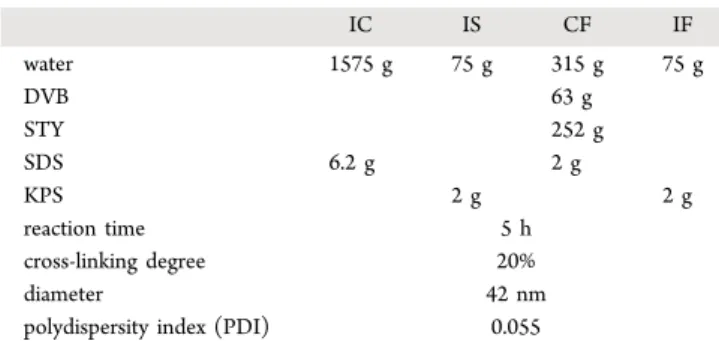
Table 1. Recipe for the Synthesis of the Corea,b
IC IS CF IF water 1575 g 75 g 315 g 75 g DVB 63 g STY 252 g SDS 6.2 g 2 g KPS 2 g 2 g reaction time 5 h cross-linking degree 20% diameter 42 nm
polydispersity index (PDI) 0.055
aAll numbers are target values; the actual ones may vary by less than 1%.bIC = initial charge, IS = initiator solution, CF = continuous feed, and IF = initiator feed.
Table 2. Recipe for the Synthesis of the Shella,b
IC IS CF water 1295 g 50 g DVB 0.8 g STY 79.7 g SDS 1 g KPS 1.5 g core latex 723 g reaction time 5 h cross-linkage degree 1% diameter 54 nm PDI 0.030
aAll numbers are target values, the actual ones may vary by less than 1%.bIC = initial charge, IS = initiator solution, and CF = continuous feed.
precursor has been used to produce the fluorescent shell on the micron-sized particles.
2.4. Synthesis of Core−Shell Polymer Microparticles. 2.4.1. Synthesis of the Core. The synthesis method was based on the work by Lee and Wi.20Accordingly, 1.5 g of PVP was dissolved in 102.6 g of ethanol in a 500 mL round-bottomflask and heated to 70 °C. Furthermore, 0.15 g of AIBN was dissolved in 15 g of STY and added to the reaction mixture upon reaching the target temperature. The reaction was left at 70 °C for 24 h under continuous stirring. When a conversion of 80% was reached, the mixture was cooled to room temperature. At this point, 1.43 g of DVB, corresponding to 20% of the converted amount of STY, was mixed with 0.075 g of AIBN and added to 58 g of the seed reaction product. The mixture was left for 6 h under stirring at room temperature. After completion, the mixture was added to a 250 mL three-neck round-bottomflask and heated to 70°C for several hours, until conversion reached values above 95%. Thefinal size was approximately 2 μm in diameter. Scanning electron microscopy (SEM) pictures and optical microscopy confirmed very high monodispersity of the prepared particles.
2.4.2. Synthesis of the Shell. To grow the shell on the polymer microparticles, 50 g of the previously produced suspension of cross-linked core particles was added to a plastic wide neck bottle. Under stirring, 100 mL of water was dripped into the solution over 20 min using an addition funnel. The resulting mixture was added to a Millipore dialysis chamber with a 0.45 micron Whatman Nuclepore membrane. Millipore water was rinsed through the chamber at 0.8 bar until the surface tension of the permeated solution reached the one of pure water, equal to 71.97 mN/m at 25 °C, to ensure complete removal of PVP from the dispersion. The dialyzed particles were transferred to a 250 mL round-bottomflask and heated to 70 °C. After charging 0.01 g of KPS, 30μL of the monomer mixture (STY with 1% DVB) was added successively every 30 min over 4 h to increase the particle size by about 100 nm. In the case of the synthesis of a fluorescent shell, the Rh B-HEMA precursor was added to the previous mixture. The precursor was dissolved in 5 mL of acetonitrile and put into a smallflask and completely dried from the solvent, using a rotary evaporator. The conventional monomer mixture used in the previous case was used to redissolve the precursor. Effective inclusion of the Rh B-HEMA precursor within the polymer was assessed by UV measurements of the supernatant after precipitation of the particles. The absence of any signal confirmed complete incorporation. Moreover, to verify with more accuracy that the dye was bound to the polymer chains, some particles were centrifuged out of the aqueous solution, dried, redispersed, and swollen with an organic solvent (isopropanol). After precipitation of the polymer particles, the supernatant was newly analyzed by means of UV spectroscopy, and again no trace of dye was found. An increase in size of the particles was determined via small-angle light scattering (SALS) measurements and SEM pictures. Moreover, the absence of an unwanted nucleation, leading to a second small nanoparticles population, was confirmed by DLS.
2.5. Processing of the Particles. 2.5.1. Dilution and Swelling. The synthesized nanoparticles’ latex has been diluted with degassed Millipore water down to a specific dry mass fraction (5 × 10⁻⁵). This mixture has been used either as it is or it is swollen with additional hydrophobic monomer (i.e., STY), whose amount is calculated as a percentage of the solid content of the latex. The obtained solution has been left under mild agitation overnight at 200 rpm before further processing.
The microparticles’ dispersion has been diluted in degassed Millipore water from the previous mixture to reach a mass fraction of 5× 10⁻⁴. In the case of swelling, pure STY equal to half of the saturation concentration in water has been added to the mixture. The system was left to equilibrate overnight. The repartition of the monomer between the water and the hydrophobic polymer phase allows for swelling of the outer, slightly cross-linked shell on the surface of the particles. Experiments were run using either fully nonfluorescent or an equal mixture of fluorescent and nonfluorescent particles.
2.5.2. Stirred Tank Reactor. The diluted latex has been aggregated using a 2 L cylindrical stirred tank reactor equipped with a 60 mm Rushton impeller and four metallic cylindrical baffles. The solution has been fed into the reactor through an opening, and the tank has been firmly closed. Significant attention has been dedicated to the removal of any bubble of air inside the reactor, to avoid aggregation at the interface between the suspension and air. To prevent air from entering the reactor when sampling, a part of the excess polymer solution was pumped in a vertical tube (1.5 m high) connected to the reactor. The stirring velocity is set at 500 rpm, which corresponds to a maximum shear rate of 17 300 s−1and an average one in the range of 900−1700 s−1, evaluated from the scaling for the maximum dissipation rate proposed by Soos et al.21To destabilize the system, 60 mL of a 2 M solution of MgCl2was added to the reactor through an opening in the bottom plate. Owing to the strong shear forces produced by the stirrer, the primary particles start aggregating in a shear-controlled regime, which is not driven by the Brownian motion but is controlled by the extent of the applied shear.
2.6. Characterization Methods. 2.6.1. Monomer Conversion. The monomer conversion is determined from the dry mass fraction of the sample. A small aliquot of the sample (about 1 cm3) was spread over quartz sand and heated at 120°C in air using a HG53 Moisture Analyzer from Mettler-Toledo.
2.6.2. Dynamic Light Scattering. The average size of the nanoparticles was determined by DLS using a Zetasizer Nano ZS from Malvern.
2.6.3. Static Light Scattering. To compute the size and the fractal dimension of the aggregated nanoparticles’ clusters and the average size of the microparticles as well as of their aggregated clusters, a small-angle static light scattering instrument, Mastersizer 2000 from Malvern Instruments equipped with a laser havingλSALS= 633 nm, was used. The radius of gyration ⟨Rg(t)⟩ was obtained by fitting the structure factor in a Guinier plot, as reported in Harshe et al.22 The fractal dimension dfwas extracted from the Guinier plot, by measuring the slope of the curve in the power-law region, using the relation⟨S(q)⟩ ∝ q−df.
2.6.4. Microscopy. The microparticles and their clusters were analyzed using a SEM instrument (Gemini 1530 FEG from Zeiss), with afield-emission gun operated at 5 kV. The coating of the samples was performed using platinum. Optical microscopy was performed using a Leica SP8-AOBS confocal microscope. An argon laser at 550 nm was used for the excitation of the samples, and the emitted light was collected using a HyD detector. Bright-field images were collected in parallel using a photomultiplier tube detector.
2.6.5. Image Analysis. The image analysis was performed on the picture taken with a confocal microscopy using ImageJ software. At least 2000 microparticles were evaluated for each measurement. For each picture, the average area in terms of the number of pixels occupied by the nonclustered polymer microparticles was evaluated. The obtained value was used, together with the total occupied area, to compute the total number of polymer microparticles present as individuals, noncluster objects, and aggregated in clusters, in the case of both nonfluorescent and fluorescent particles.
3. RESULTS AND DISCUSSION
3.1. Shear-Controlled Aggregation. In our shear-controlled aggregation experiments, a colloidal suspension of primary particles is fed into a stirred tank reactor, and an electrolyte solution is added to fully destabilize the system. However, owing to the presence of the stirrer, the aggregation process is not driven by the Brownian motion but is controlled by the magnitude of the applied shear. Accordingly, the
aggregation rate is highly affected by the stirring velocity.5The
destabilization of the system owing to the electrolyte addition cancels the repulsive energy barrier, thus leading to primary particles aggregating at a much faster rate into their primary energy minimum. The stirrer creates velocity gradients that drive particles and clusters against each other, thus increasing
the frequency of their encounters. On the other hand, clusters may also break under the action of hydrodynamic stresses
caused by the presence of shear forces.5 Consequently, it is
expected that the system reaches and preserves a steady-state condition, determined by an equilibrium between the
aggregation and breakage rates.6The critical parameter defining
the region of shear-controlled aggregation is the Peclet number (Pe) which expresses the ratio between the shear and the
Brownian forces and is defined according to the equation
πμγ = ̇ Pe R k T 3 p3 B (1)
whereμ is the solvent viscosity; γ̇ is the shear rate; Rpis the
radius of the primary particles; kBis Boltzmann’s constant; and
T is the absolute temperature.10
3.2. Aggregation of Nanoparticles. The study of the aggregation of particles in a shear-controlled regime has been carried out using the polymer nanoparticles with a core−shell structure, synthesized through the procedure described in the
Experimental Section. The soft shell of the polymer particles allows for swelling by the additional monomer (STY), which is used as a plasticizer that lowers the glass transition temperature
of the polymer domain,23 thus making it very soft at the
operating temperature. The addition of highly concentrated (2 M) magnesium chloride solution ensures full screening of the surface charges located at the particles’ surface. The system is left under agitation for some hours, and the morphology evolution of the clusters, in terms of the radius of gyration
(⟨Rg⟩) and fractal dimension (df), is monitored. As the latter is
obtained via power-law regression of the scattering structure
factor, only variations in the range of ±0.1 are appreciable.
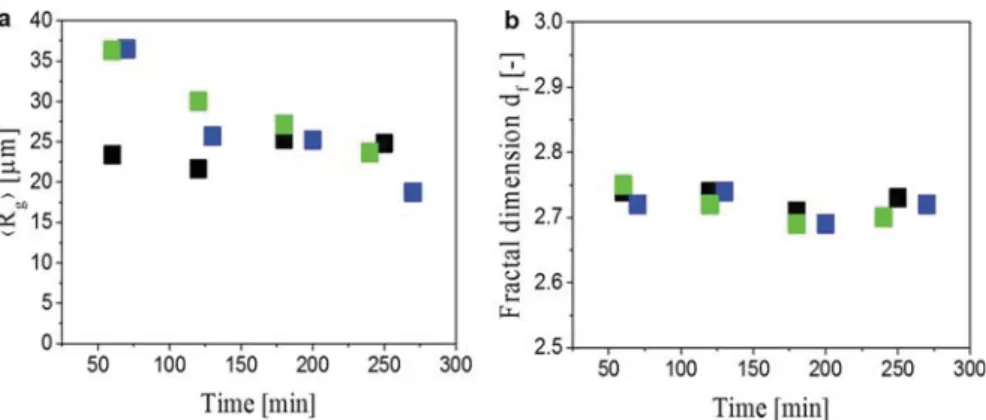
Figure 1reports the average cluster size and fractal dimension as a function of the aggregation time for the samples swollen with 0, 10, and 20% of the additional monomer.
As can be seen fromFigure 1a, the average cluster size for the
nonswollen clusters presents no appreciable variations with time after about 50 min and reaches a constant value of
approximately 25μm (black squares). This is in agreement with
the results obtained by Harshe et al.22and Soos et al.,5which
show that the interplay between aggregation and breakage reaches an equilibrium and that the average cluster size remains steady in time. Owing to the high Pe number, as soon as the cluster is broken into smaller fragments, it promptly aggregates with other polymer particles or clusters to reach the same constant average size. On the other hand, in the case of primary particles swollen with 10 and 20% STY, the average size of the
clusters continuously decreases with time. In particular, the average size of the sample swollen with 10% STY is measured
to vary from 36 μm after 70 min to 19 μm after 270 (blue
squares). Similarly, the size of the sample swollen with 20% of
the additional monomer decreases from 36μm after 60 min to
23μm after 240 (green squares). In addition,Figure 1b shows
that the fractal dimension remains constant at a value of approximately 2.7, which is virtually identical to that obtained for clusters made of nonswollen particles in the case of
shear-induced aggregation and breakage processes.22
The observed decrease of the aggregate size with time is in contrast to the available literature, and accepted explanations for this trend are still missing. Consistent with that
hypothesized in a previous work,9 the observed trend could
be the result of some alterations on the surface of the swollen
primary particles, which eventually affect the bond strength
among particles and consequently the rate of breakage. More
specifically, after the particles undergo many cycles of
aggregation and breakage, their surface could become more irregular and less homogeneous. The experimental evidence indicates that this process should be related to the morphology of the primary particles that are made of a hard core surrounded by a shell that is softened through monomer swelling. One possible mechanism consistent with these observations is that the surface alteration of the primary
particles occurs through material exchange among different
particles upon collision and breakage. These alterations may
affect the surface adhesion of the particles and consequently the
breakage rate because less energy is required to separate them. It is worth noting that the observed behavior cannot be simply due to the fact that the system is not yet at equilibrium conditions because a destabilized system under shear-controlled aggregation regime typically reaches equilibrium between aggregation and breakage within about 60 min, at least for
the particle concentration used in these experiments.5
3.3. Aggregation of Microparticles. To confirm whether
the hypothesized material exchange process occurs, aggregation and breakage have been investigated using the microparticles produced according to the procedure reported in the
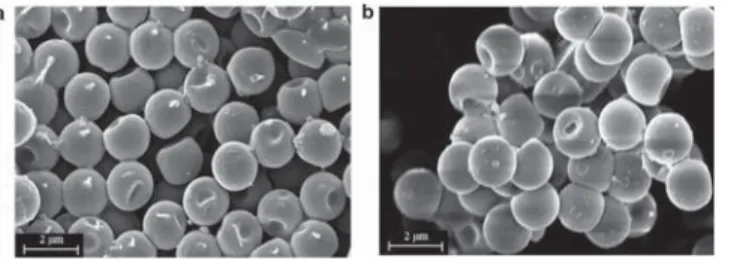
Experimental Section. These particles exhibit the same architecture as the nanoparticles: they have a hard core of 2 μm diameter, composed of polystyrene cross-linked with 20% DVB, and a soft outer shell of 100 nm, again made of polystyrene but only 1% cross-linked. The morphology of the microparticles before and after the growth of the shell is shown in Figure 2. Note that the microparticles present dimples that probably result from the swelling and cross-linking procedure
Figure 1. Time evolution of the average cluster size (a) and fractal dimension (b) for different swelling ratios (black squares: nonswollen; blue: 10% swollen; and green: 20% swollen) during the shear-controlled aggregation of nanoparticles.
used to produce their shell, as reported and discussed earlier in
the literature.24,25
Furthermore, some particles have been madefluorescent by
the addition of the Rh B-HEMA precursor in the monomer mixtures used to synthesize the shell so that they can be
visualized with afluorescent confocal microscope. Their
shear-controlled aggregation has been investigated by introducing an
equal mixture of fluorescent and nonfluorescent particles into
the stirred tank, following the same procedure as for the nanoparticles. Again, the experiments have been run without and with the addition of further STY to swell and thus soften
the particles’ outer shell. The number of fluorescent
micro-particles before and after aggregation, present both as single entities and grouped in clusters, has been determined by the
image analysis. Figure 3 shows the confocal pictures of the
microparticles, before and after applying the fluorescent filter.
This allows visualizing all particles (Figure 3a) or only the
fluorescent ones (Figure 3b). The two pictures are
super-imposed in Figure 3c, in which it is possible to count the
number of microparticles presenting fluorescent.
3.3.1. Aggregation of Nonswollen Microparticles. Non-swollen microparticles were aggregated under shear and
monitored for several hours. The ⟨Rg⟩ values of the formed
clusters measured by SALS measurements are shown inFigure
4 (red squares). It can be observed that already after 1 h a
steady state of the average size is reached, which remains constant over the 5 h experimental time. Remarkably, this
equilibrium value for⟨Rg⟩ is considerably smaller than that in
the case of nanoparticles. This observation can be understood considering the number of particles present in each cluster, which can be estimated through the equation
= ⎛⟨ ⟩ ⎝ ⎜⎜ ⎞⎠⎟⎟ i k R R d g p f (2)
where k is the fractal prefactor, a number whose value typically
ranges between 1 and 1.2;26,27 ⟨Rg⟩ is the average radius of
gyration; Rpis the radius of the primary particles; and dfis the
fractal dimension of the colloidal aggregates. It results that the
number of nanoparticles aggregated in a cluster is on the order
of 107, whereas that of the microparticles is limited to 4−5.
Because aggregation is a second-order kinetic process, a smaller number of particles imply a lower aggregation rate, whereas
breakage, being afirst-order kinetic process, is unaffected by a
lower number of particles. It is, therefore, reasonable to expect
a different equilibrium condition, dominated by the relative
higher breakage contribution. Moreover, the breakage process
is also strongly influenced by the size of the particles. For the
same cluster size, in fact, a cluster made of micron-sized particles contains a lower number of particles and consequently a lower number of bonds among them. Given this relatively weaker bond strength compared to the hydrodynamic stress acting on the particles, it is reasonable to assume that, when subjected to shear, their clusters can rebreak into much smaller
units, including individual particles.28 To determine any
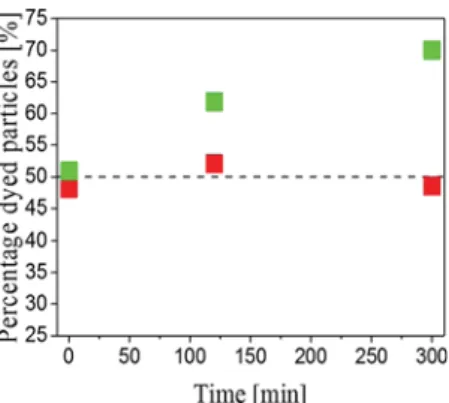
alteration on their surface, the percentage of fluorescent
particles was monitored as a function of time as shown in
Figure 5(red squares). The fact that this value does not change over 5 h allows to conclude that, in this case, no material exchange occurs among the surfaces of the primary particles.
3.3.2. Aggregation of Swollen Microparticles. The same experiment has been repeated using particles whose shell has
been swollen with STY. The values of⟨Rg⟩ were determined via
light scattering and shown in Figure 4 as a function of time
(green squares). It is seen that the gyration radius reaches the
value of 3μm within the first hour and then remains constant.
Noticeably, it seems not to decrease over time, as in the case of the nanoparticles. This aspect is again due to the low number of
particles present in each cluster, which makes it difficult to
observe a significant decrease in the average cluster size in time
when dealing with microparticles. In any case, it is a fact that
Figure 2. Particles without shell (a) and after shell growth (b).
Figure 3. Micrographs of the microparticles in transmission mode (a), in fluorescent confocal mode (b), and their superposition (c).
Figure 4. Average ⟨Rg⟩ as a function of time for different microparticles. In particular, black squares refer to nonswollen core microparticles, red squares to nonswollen core−shell microparticles, and green squares to swollen core−shell microparticles.
the interplay between aggregation and breakage controls the
process. Anew, the proportion of fluorescent particles was
measured. As shown inFigure 5, the percentage offluorescent
particles clearly increases over time, moving from the initial 50% to approximately 62% after 2 h and eventually to 70% after
5 h (green squares). This experiment shows that thefluorescent
polymer chains, initially present only on the surface of fluorescent particles, are displaced and can also be found on
the surface of nonfluorescent particles. In particular, this
material exchange occurs only when the shell of the particles is
sufficiently soft, that is, when the particles are swollen by STY.
It is therefore reasonable that a similar mechanism occurs even in the case of nanoparticles and might be responsible for the unexpected progressive decrease in the average cluster size.
3.3.3. Aggregation of the Microparticles without Shell. For the sake of completeness, the highly cross-linked polystyrene microparticles without shell were aggregated under shear. Interestingly, under the same conditions, they were unable to
aggregate over the 4 h time course of the experiment (Figure
4). This behavior further confirms the extreme importance of
the surface of the particles in colloidal aggregation. More aptly, a softer surface, in this case, owing to a 1% cross-linked polystyrene shell of 100 nm, was observed to promote aggregation, whereas a harder one, composed of highly cross-linked polystyrene (20%), makes it impossible for the microparticles to form stable clusters in the tested conditions. They surely collide, but due to their rigidity, weak bonds are formed, which are easily broken by shear forces.
4. CONCLUSIONS
In this work, shear-induced aggregation experiments of various polymer colloidal particles have been carried out, with the
specific objective of clarifying the role of the softness of the
particle shell on the outcome of the aggregation. In particular, in a previous work, we hypothesized that the surface of sufficiently soft particles could be deformed as a result of the repeated aggregation and breakage events, leading to an increase in surface roughness. This effect could be sufficiently pronounced to lead to exchange of material from one particle surface to another. To prove the presence of such material
exchange, specially designed polymer particles with a core−
shell structure and having thefluorescence group incorporated
into their shell have been prepared. To tune the softness of the polymer shell, some STY monomer was added, which acts as a
plasticizer. For thefirst time, material exchange occurring on
the surface of the core−shell polymer microparticles, when
softened by monomer addition, upon aggregation under shear was proven and highlighted. This was achieved by aggregating a
1:1 mixture of thefluorescent and nonfluorescent particles and
by monitoring the increase in the number of particles exhibiting fluorescence as a function of time. An increase in the
percentage of particles showing a fluorescent signature was
recorded over time, reaching a fraction of 70% after 5 h. The consequences of our work are far-reaching. It is reasonable to assume this phenomenon to be responsible for the unusual behavior observed on similar nanoparticles under the same conditions (swollen shell). Indeed, the slow but progressive decrease in the size of the formed clusters over time upon shear-controlled aggregation, without substantial change in fractal dimension and without reaching steady-state conditions, might be due to surface alterations and increased roughness on the polymer domain induced by the material
transfer. These modifications can affect the surface adhesion
among the particles and lead to a restructuring of the clusters toward continuously new steady-state conditions between aggregation and breakage.
It is worth noticing that material exchange, which has been
proven for the first time in this work, might not be the only
phenomenon controlling the unusual behavior observed in the shear-controlled aggregation of nanoparticles, but we believe
that it represents a very important effect; the full consequences
of it need to be further ascertained and deepened.
■
AUTHOR INFORMATION Corresponding Author *E-mail:[email protected]. ORCID Stefano Caimi: 0000-0003-3898-559X Baptiste Jaquet: 0000-0002-3920-9173 Marco Lattuada: 0000-0001-7058-9509 Author ContributionsS.C., A.C., and B.J. contributed equally. The manuscript was written through contributions from all authors. All authors have
given approval to the final version of the manuscript.
Notes
The authors declare no competing financial interest.
■
ACKNOWLEDGMENTSFinancial support from the Swiss National Science Foundation is gratefully acknowledged (grant numbers 200020_165917 and PP00P2_159258). Moreover, the authors are very thankful to Ernesto Scibona for the confocal microscopic pictures and Michele Zanini and Anna Beltzung for the SEM images.
■
REFERENCES(1) Elgebrandt, R. C.; Romagnoli, J. A.; Fletcher, D. F.; Gomes, V. G.; Gilbert, R. G. Analysis of shear-induced coagulation in an emulsion polymerisation reactor using computational fluid dynamics. Chem. Eng. Sci. 2005, 60, 2005−2015.
(2) De Boer, G. B. J.; Hoedemakers, G. F. M.; Thoenes, D. Coagulation in Turbulent Flow: Part 1. Chem. Eng. Res. Des. 1989, 67, 301−307.
(3) Serra, T.; Casamitjana, X. Structure of the Aggregates During the Process of Aggregation and Breakup Under a Shear Flow. J. Colloid Interface Sci. 1998, 206, 505−511.
(4) Serra, T.; Casamitjana, X. Effect of the shear and volume fraction on the aggregation and breakup of particles. AIChE J. 1998, 44, 1724− 1730.
Figure 5. Percentage of fluorescent core−shell microparticles as a function of time (red squares: nonswollen particles and green squares: swollen particles).
(5) Soos, M.; Moussa, A. S.; Ehrl, L.; Sefcik, J.; Wu, H.; Morbidelli, M. Effect of shear rate on aggregate size and morphology investigated under turbulent conditions in stirred tank. J. Colloid Interface Sci. 2008, 319, 577−589.
(6) Ehrl, L.; Soos, M.; Morbidelli, M. Dependence of Aggregate Strength, Structure, and Light Scattering Properties on Primary Particle Size under Turbulent Conditions in Stirred Tank. Langmuir 2008, 24, 3070−3081.
(7) Israelachvili, J. N. Intermolecular and Surface Forces, 3rd ed.; Academic Press: London, 2011.
(8) Sciortino, F.; Zaccarelli, E. Reversible gels of patchy particles. Curr. Opin. Solid State Mater. Sci. 2011, 15, 246−253.
(9) Moussa, A. S.; Lattuada, M.; Conchúir, B. Ó.; Zaccone, A.; Morbidelli, M.; Soos, M. Flow-Induced Aggregation and Breakup of Particle Clusters Controlled by Surface Nanoroughness. Langmuir 2013, 29, 14386−14395.
(10) Lazzari, S.; Nicoud, L.; Jaquet, B.; Lattuada, M.; Morbidelli, M. Fractal-like structures in colloid science. Adv. Colloid Interface Sci. 2016, 235, 1−13.
(11) Hodges, C. S.; Cleaver, J. A. S.; Ghadiri, M.; Jones, R.; Pollock, H. M. Forces between Polystyrene Particles in Water Using the AFM: Pull-off Force versus Particle Size. Langmuir 2002, 18, 5741−5748.
(12) Hodges, C. S.; Looi, L.; Cleaver, J. A. S.; Ghadiri, M. Use of the JKR Model for Calculating Adhesion between Rough Surfaces. Langmuir 2004, 20, 9571−9576.
(13) Quesnel, D. J.; Rimai, D. S.; Demejo, L. P. Molecular Dynamic Simulation of Adhesional Release of Particles from Surfaces. J. Adhes. 1998, 67, 235−257.
(14) Eiser, E.; Molino, F.; Porte, G.; Pithon, X. Flow in micellar cubic crystals. Rheol. Acta 2000, 39, 201−208.
(15) Vermant, J.; Solomon, M. J. Flow-induced structure in colloidal suspensions. J. Phys.: Condens. Matter 2005, 17, R187−R216.
(16) Pawley, J. B. Handbook of Biological Confocal Microscopy, 2nd ed.; Springer: New York, 2006.
(17) Klein, J.; Briscoe, W. H.; Chen, M.; Eiser, E.; Kampf, N.; Raviv, U.; Tadmor, R.; Tsarkova, L. Polymer Brushes and Surface Forces. In Polymer Adhesion, Friction, and Lubrication; Zeng, H., Ed.; John Wiley & Sons: Hoboken, 2013.
(18) Brandrup, J.; Immergut, E. H.; Grulke, E. A. Polymer Handbook; John Wiley & Sons: New York, 1999.
(19) Cova, L.; Bigini, P.; Diana, V.; Sitia, L.; Ferrari, R.; Pesce, R. M.; Khalaf, R.; Bossolasco, P.; Ubezio, P.; Lupi, M.; Tortarolo, M.; Colombo, L.; Giardino, D.; Silani, V.; Morbidelli, M.; Salmona, M.; Moscatelli, D. Biocompatible fluorescent nanoparticles for in vivo stem cell tracking. Nanotechnology 2013, 24, 245603−245613.
(20) Lee, K.-C.; Wi, H.-A. Synthesis of crosslinked polystyrene particles by seeded batch polymerization with monomer absorption. Trans. Nonferrous Met. Soc. China 2011, 21, s153−s159.
(21) Soos, M.; Kaufmann, R.; Winteler, R.; Kroupa, M.; Lüthi, B. Determination of Maximum Turbulent Energy Dissipation Rate generated by a Rushton Impeller through Large Eddy Simulation. AIChE J. 2013, 59, 3642−3658.
(22) Harshe, Y. M.; Lattuada, M.; Soos, M. Experimental and Modeling Study of Breakage and Restructuring of Open and Dense Colloidal Aggregates. Langmuir 2011, 27, 5739−5752.
(23) Chow, T. S. Molecular Interpretation of the Glass Transition Temperature of Polymer-Diluent Systems. Macromolecules 1980, 13, 362−364.
(24) Kim, S.-H.; Hollingsworth, A. D.; Sacanna, S.; Chang, S.-J.; Lee, G.; Pine, D. J.; Yi, G.-R. Synthesis and Assembly of Colloidal Particles with Sticky Dimples. J. Am. Chem. Soc. 2012, 134, 16115−16118.
(25) Sacanna, S.; Korpics, M.; Rodriguez, K.; Colón-Meléndez, L.; Kim, S.-H.; Pine, D. J.; Yi, G.-R. Shaping colloids for self-assembly. Nat. Commun. 2013, 4, 1688.
(26) Friedlander, S. K. Smoke, Dust, and Haze Fundamentals of Aerosol Dynamics, 2nd ed.; Oxford University Press: New York, 2000.
(27) Sorensen, C. M.; Roberts, G. C. The Prefactor of Fractal Aggregates. J. Colloid Interface Sci. 1997, 186, 447−452.
(28) Bäbler, M. U. A Collision Efficiency Model for Flow-Induced Coagulation of Fractal Aggregates. AIChE J. 2008, 54, 1748−1760.