HAL Id: hal-00781954
https://hal.archives-ouvertes.fr/hal-00781954
Submitted on 28 Jan 2013HAL is a multi-disciplinary open access
archive for the deposit and dissemination of sci-entific research documents, whether they are pub-lished or not. The documents may come from teaching and research institutions in France or
L’archive ouverte pluridisciplinaire HAL, est destinée au dépôt et à la diffusion de documents scientifiques de niveau recherche, publiés ou non, émanant des établissements d’enseignement et de recherche français ou étrangers, des laboratoires
Microstructure in sheared non-Brownian concentrated
suspensions
Frédéric Blanc, Elisabeth Lemaire, Alain Meunier, François Peters
To cite this version:
Frédéric Blanc, Elisabeth Lemaire, Alain Meunier, François Peters. Microstructure in sheared non-Brownian concentrated suspensions. Journal of Rheology, American Institute of Physics, 2013, 57 (1), pp.273. �hal-00781954�
Microstructure in sheared non-Brownian concentrated
suspensions
Fr´ed´eric Blanc,Elisabeth Lemaire,Alain Meunier,Fran¸cois Peters CNRS, Universit´e de Nice, LPMC-UMR 6622, 06108 Nice Cedex 2, France
October 16, 2012
Abstract
The shear-induced microstructure in non-Brownian suspensions is studied. The Pair Distribution Function in the shear plane is experimentally determined for particle volume fractions ranging from 0.05 to 0.56. Transparent suspensions made of PMMA particles (172µm in diameter) dispersed in a fluorescent index matched Newtonian liquid is sheared in a wide gap Couette rheometer. A thin laser sheet lights the shear plane. The particle positions are recorded and the pair distribution function (PDF) in the shear plane is computed. The PDF at contact is shown to be anisotropic, with a depleted area in the receding side of the reference particle. The angular position of the depleted zone, close to the velocity axis at low particle concentration, is tilted toward the dilatation axis as the volume fraction is increased. At high concentrations (larger than 0.45), the shape of the PDF changes qualitatively with a secondary depleted area in the compressional quadrant of the main flow and a probability peak in the velocity direction.
These experimental results are in good agreement with numerical simulations in Stokesian Dynamics where the interaction force between particles has been tuned to reproduce the particle roughness effects.
1
Introduction
This study is focussed on shear-induced microstructure of non-Brownian concentrated sus-pensions at small Reynolds number. Several experimental [Gadala-Maria and Acrivos (1980); Blanc et al. (2011b)], numerical [Sierou and Brady (2002); Yeo and Maxey (2010a)] and theoretical studies [Batchelor and Green (1972); Brady and Morris (1997)] have shown that the rheology of suspensions is closely linked to the spatial distribution of particles, the so-called microstructure [Gadala-Maria and Acrivos (1980); Blanc et al. (2011b)]. Indeed, when particles are added to a Newtonian fluid, besides the quite well documented increase of the shear viscosity, a drastic change of the rheological behavior, including normal stress differences is observed. The concept of shear-induced microstructure has been introduced for the first time by Gadala-Maria and Acrivos (1980) to explain the transient rheological response of concentrated suspensions under shear reversal (see also [Kolli et al. (2002); Narumi et al. (2002); Blanc et al. (2011b)]). The suspensions were sheared in a cylindrical Couette rheometer and the authors observed that if shearing was stopped and restarted in the opposite direction, the viscosity underwent a step-like decrease, passed through a mini-mum and increased again to reach the value it had before the shear reversal. Gadala-Maria and Acrivos proposed to explain this viscosity response by a shear-induced asymmetric arrangement of the particles that is destroyed when the flow is reversed and next rebuilt in the mirror arrangement. The hypothesis made by Gadala-Maria and Acrivos motivated the study of Parsi and Gadala-Maria (1987), seven years later, who measured directly the relative arrangement of the particles located near the top layer of a concentrated suspen-sion sheared in a Couette cell. The observations of Parsi and Gadala-Maria confirmed the hypothesis of Gadala-Maria and Acrivos and showed that the pair distribution func-tion (PDF) of a concentrated suspension, φ= 0.4 in volume fracfunc-tion, was anisotropic and fore-and-aft asymmetric. This asymmetry had not been observed by Husband and Gadala-Maria (1987) in dilute suspensions (φ = 0.01 − 0.05) for which the authors found an excess of particle pairs aligned in the velocity direction. Later, Rampall et al. (1997) obtained a qualitatively different result with a particle depletion in regions aligned with the flow and
a fore-and-aft asymmetry. This result has been confirmed by a recent experiment [Blanc et al. (2011a)] and is also in agreement with a model based on pair trajectories of rough spheres [Blanc et al. (2011a); Da Cunha and Hinch (1996); Rampall et al. (1997); Wilson and Davis (2000)].
The experimental determination of the particle arrangement inside more concentrated suspensions is rather difficult because it requires a very accurate refractive index matching between the particles and the fluid. To our knowledge, there is only one paper due to Gao et al.(2010) that reports experimental results on the microstructure inside a non-Brownian concentrated suspension. They used confocal laser scanning microscopy to measure the 3D-PDF in a suspension of micron size particles at a volume fraction of 32%. The pH of the water-based suspending fluid was adjusted in order to weaken the colloidal forces and the applied shear rate was sufficiently high for the Peclet number to be large (Pe=1700), i.e. thermal effects to be weak. They observed an anisotropy of the PDF in the shear plane which is qualitatively reproduced by numerical simulations in Stokesian Dynamics.
The numerical studies on the shear-induced microstructure started with the work of Bossis and Brady (1984) who used the Stokesian Dynamics method to study the particle arrangement in a monolayer. Later, 3D simulations were performed either using Stokesian Dynamics [Drazer et al. (2004); Sierou and Brady (2002)] or Force Coupling Method [Abbas et al.(2007); Yeo and Maxey (2010a,b)]. They all showed that the PDF of a concentrated non-Brownian suspension is anisotropic and fore-aft asymmetric with a larger number of pairs oriented on the approaching side of the reference particle than on the receding side. These numerical results were confirmed by a theoretical study proposed by Brady and Morris (1997) who analyzed the influence of a repulsive interparticle force of hard-sphere type and of residual Brownian motion on the PDF.
In this paper, we present an experimental and a numerical study of the shear-induced microstructure in non-Brownian suspensions at low Reynolds number (Re ≤ 10−2) and high Peclet number (P e ≃ 109). Our main motivation for carrying out the numerical study is to have available numerical results that could be directly compared to the measurements. The
simulation parameters have been chosen to fit the experimental conditions (same volume fractions, similar particle roughness, same sampling of the plane to calculate the PDF). In section 2, we describe the particle visualization technique used to measure the pair dis-tribution function in suspensions made of PMMA particles, 172µm in diameter, dispersed in a Newtonian fluid at several solid concentrations ranging from 5% to 56%. After the description of the suspensions, we present the experimental device that we used to shear the suspensions and to measure the particle center location in the shear plane. Section 3 summarizes the main features of the Stokesian Dynamics method used to compute the pair distribution functions and presents the numerical results. The experimental results are presented in section 4. At last, a discussion of the results and a comparison between the measurements and the computations are proposed in section 5.
2
Experimental method
2.1 Materials
The suspensions are made of non-colloidal spherical particles of polymethylmetacrylate immersed in a Newtonian mineral oil. The particle volume fraction ranges between 0.05 and 0.56. The particles (Arkema BS510) were sieved to diameters between 160 µm and 180 µm. We used a wet-sieving technique where the particles are dispersed in a water/surfactant mixture to prevent cluster formation. This technique has been found much more efficient than usual dry-sieving. After sieving, the particles are rinsed several times with deionized water and then dried in a vacuum oven overnight at 60◦C. The batch polydispersity is
measured by light microscopy (Zeiss, Axio Scope A1) and image analysis. The particle size distribution is obtained from a numerical disk detection process using the Hough transform (see section 6). The mean particle radius is a=86 ±4 µm. The surface roughness of the particles has been measured using an atomic force microscope. The measurements were carried out on six different particles over a 10µm × 10µm area. The main roughness height is around 20 nm, with isolated bumps, approximately 200 nm in height. The particle and
suspending liquid refractive index is 1.49 and their density is 1.18 g.cm−3. The suspending liquid is a mineral oil (Cargille Laboratories, Immersion Liquid Code 11295101160) that has been specially designed to match the refractive index and the density of PMMA in order to perform direct optical visualization inside the suspensions and to prevent any sedimentation [Blanc et al. (2011c)]. To allow particle visualization, a slight amount of a fluorescent dye (Nile Blue A) is dissolved in the fluid which is heated to 50◦C to this purpose. Then the
died fluid is filtered through a 7µm membrane filter in order to remove the undissolved part of the dye. To improve the index matching, the temperature is controlled and the best matching is obtained at 37◦C. At this temperature, the suspending liquid has been
found to be fully Newtonian and its viscosity has been measured to be η0 = 0.85 P a.s.
The suspensions were directly made in the flow cell cup which can be easily removed from the rheometer. The particles are poured in the liquid and the paste is stirred by hands with a thin stem. The cell is then placed in a vacuum chamber to remove air bubbles from the suspension. The viscosity variation as a function of the particle volume fraction has been found to be quite well described by the empirical relation proposed by Zarraga et al. (2000). η η0 = e−2.34φ ! 1 −φφm"3 with φm = 0.57 2.2 Experimental set-up
The experimental facility is described in detail in [Blanc et al. (2011c)] and a schematic drawing is proposed on fig. 1-(a). The present section summarizes the main points. The suspension is sheared in a transparent wide-gap Couette cell mounted on a controlled-stress rheometer (Haake Mars II, Thermo Scientific). Both cylinders are made in PMMA to prevent any optical refraction at the cell/suspension interface. The gap width is 5 mm (roughly 60a), the inner and external cylinder radii are respectively Ri = 19 mm and
Ro = 24 mm, and their height is 60 mm. The vertical surfaces of the cylinders that are in
suspension. Nevertheless, the cylinder roughness is much smaller than the particles and as it it will be mentioned in section 5, for the highest solid concentrations, a particle banding is observed near the walls, that is responsible for the apparent slip of the suspension. The stator front face has been polished in the form of a flat rectangular window that lets an horizontal laser sheet (Lasiris TEC Laser 635 nm, 35mW, Stockeryale) enter the gap between the cylinders [Blanc et al. (2011b)]. The laser sheet thickness has been measured in the gap and found to be 30 µm±6 µm [Blanc (2011)]. A CCD camera (Pixelink PLB 741 U, 1280×1024 pixels) is positioned under the cup bottom whose both external and internal surfaces have been polished. An optical high pass filter (λHP = 650 nm) is placed in front
of the camera, so that only the fluorescing light is detected. The camera is trigged, together with the laser sheet, by an external oscillator in order to record sequential images of the illuminated suspension. Since the particle diameter is larger than the laser sheet thickness, the particles intercepted by the laser plane appear as black disks on the pictures (see Fig. 1-(b)). To improve image quality, the whole apparatus is placed in a thermostated box, and the temperature is set to T=37◦C. At this temperature, the particle and liquid optical
indices are closely matched and the suspension is highly transparent. For that reason, we have been able to image the particles more than one centimeter deep in the suspension. Fig. 1-(b) shows a typical image, obtained 10 mm above the bottom of the stator for a suspension of volume fraction Φ = 0.56. All the measurements described below have been performed at this height, that is twice the gap, where the bottom end effect on the velocity profile has been shown to be negligible [Blanc et al. (2011c)].
To shear the suspension, a constant torque is applied to the inner cylinder in such a way that it rotates at about 1 rpm. Actually, the angular velocity, Ω varies from an experiment to another and its exact value is given in table 2 (section 4). Owing to this order of magnitude for Ω and to the suspension characteristics given in the previous subsection, we can calculate the Peclet and the Reynolds numbers:
! Camera Optical filter Laser sheet 19 mm 24 mm 60 mm Thermostated box 10 mm (a) (b) Rotor Stator 8a 8a 8a 8a A B
Figure 1: (a)-Experimental set-up. (b)-Typical image obtained 10 mm above the bottom of the cup for a suspension of volume fraction Φ = 0.56. The zones A and B (section 2.3) delimit the working areas for the calculation of the pair distribution functions. Zone A contains the particles that are used as reference particles (particles (1)) for the PDF calculation and the particles (2) are either in zone A or in zone B. The boundary of zone B is spaced from the cylinder surfaces by a minimum distance of (3a).
P e = kT (Ro−Ri) 6πη0aΩRout ∼109 Re = ρΩRi(Ro−Ri) η ∼10 −5−10−2 (1)
Here the shear rate is computed from the theoretical expression for a newtonian liquid. It may differ a bit due to wall slip and the onset of migration. Anyway, as will be shown below (figure 4), the PDF does not change over a wide range of shear rate.
2.3 PDF numerical calculation
We extract the particles center position and radius from each frame using a particle de-tection process that is explained in detail in the appendix. The position is measured with a resolution of approximately 0.1 pixel, and the radius is given as an integer number of pixels. Once the particles detected, the apparent pair distribution function, g2D(ρ, θ) in
(i) Two zones are defined on the image (Fig. 1-b). Zone A contains the reference particles (1). From the center of each of them, the position vectors of all other particles (2) situated in zones A and B, ρ12, are computed in the local frame of reference of the considered particle (1). The distance between particles (1) and (2) is denoted by ρ, and the angle of ρ12from the mean flow direction at particle (1) by θ (Fig.2-a). Zone B surrounds zone A and is defined in such a way that it is large enough to prevent spurious finite size effects on the calculation of the PDF. In addition, it is far enough from the flow cell walls to avoid physical edge effects. The width of zone B is 8a and it is separated from the walls by an arbitrarily chosen distance 3a. In such conditions, it has been controlled that the PDF is well normalized and tends to 1 as ρ increases. At last, it has also been checked, that the PDF does not depend (except for statistical fluctuations) on the size of zone A (section 5 and [Blanc (2011)]).
(ii) The (ρ, θ) plane is sampled: ∆ρ = 1 px (i.e. approximately 7.10−2 a) and ∆θ = 2π/80 rad. The number N (ρ, θ) of pair separation vectors in the area (ρ − ∆ρ/2, ρ + ∆ρ/2; θ − ∆θ/2, θ + ∆θ/2) is determined.
(iii) The calculation of the 2D-PDF is straightforward :
g2D(ρ, θ) = # 1 n0S N (ρ, θ) N1ρ∆ρ∆θ $ (2)
where N1 is the number of reference particles (1) and n0S is the average surface
number density of particles. The PDF presented below are the result of an averaging over a large number of images that depends on the particle volume fraction of the suspension and that is given in table 2 (section 4).
Actually, the detected particles do not lie exactly in the plane of the laser sheet (Fig.2b). As a consequence, if the larger distance of a particle from the laser sheet is denoted by zmax,
g2D(ρ, θ) is the integral of the real 3D PDF, g(r, θ, z), over an interval [−2 zmax, 2 zmax] in
the z direction. As zmax increases, g2D(ρ, θ) deviates further from the exact 3D PDF
Figure 2: (a) Pair position vector relative to the local mean flow direction in the shear plane. (b) More distant particles appear as disks of smaller radius rk. Only the spheres whose
center is located between −zmax and +zmax from the laser sheet are taken into account in
the 2D-PDF calculation. For two such particles (p) and (k): −2zmax < zp−zk < 2zmax.
disks appear (Fig.2b), it is possible to reduce zmax upon selecting only the particles that
appear as the largest disks on the image, so that g2D(ρ, θ) is a good approximation of
g(r, θ, z = 0) 1 in the shear plane [Blanc (2011); Rampall et al. (1997)]. For an infinitely thin laser sheet, and monosized particles, the relation between zmax, the radius a and the
smallest considered apparent radius rmin is straightforward:
zmax=
% a2−r2
min (3)
However, this determination of zmax suffers several errors and incertitudes. The laser
sheet thickness has to be considered, as should be the particle size distribution width (±5%). In addition, the C.H.T. procedure is expected to lower the measured particle size, since it first extracts the edge of the disks using the gradient of the intensity profile. Finally, it gives the radius (in pixels) as an integer, with an incertitude of 0.5 px. All these reasons
1
make the exact relation between the measured apparent radii rkand the particle positions
zk a bit tricky and approximative. Nevertheless, in the following, we will compare the
experimental PDF to numerical simulations, and we will need a practical way to estimate zmax from different values of rmin. We have chosen to measure directly this relation from
the suspension images. For each set of images, i.e. each suspension sample, and each value of rmin, the particles whose radius is larger or equal to rmin are counted, and the
corresponding mean surface density ns(rmin) is extracted. The value zmax(rmin) can be
computed from the mean volume fraction φ as:
zmax=
2nsπa3
3φ (4)
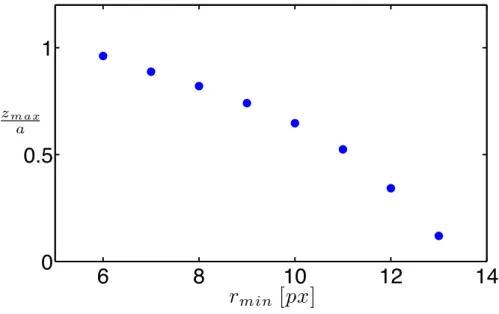
The variation of zmax as a function of rmin is displayed in Fig. 3 for a suspension, φ=0.35
in volume fraction. It should be noted that this relation between zmax and rmin varies
a little from one experiment to the other, certainly due to small variations in the optical settings.
6
8
10
12
14
0
0.5
1
r
min[px]
zm ax aFigure 3: Experimental measurement of the largest distance of the particle from the laser plane zmax as a function of the smallest apparent radius considered rmin. φ=0.35.
3
Numerical simulation method
Numerical simulations were carried out using the Stokesian Dynamics method. The Stoke-sian Dynamics is used here to simulate the flow of a suspension of spherical particles in a viscous fluid submitted to an imposed simple shear at zero Reynolds number. It is now widely used, and details on the method can be found in [Bossis and Brady (1984); Brady and Bossis (1988)]. The advantage of the Stokesian Dynamics is to take into account both the many-body nature of the hydrodynamic interactions between particles and the strong lubrication forces between two close particles. As the experimental Peclet number is very large (P e ∼ 109), we did not include Brownian motion in the computation and we simulate suspensions at infinite Peclet number. In the present work, we consider a monodisperse system of 125 particles in a cubic box with periodic boundaries. Because the system is periodic, the long range part of the hydrodynamic interactions are computed with the help of Ewald summation. In order to take into account the particle roughness estimated to be ǫra = 3 10−3a in the experiment, we introduce a repulsive force between the particles in
the simulated system. The repulsive force between the spheres is directed along the line of centers. It is normalized by the factor 6πη ˙γa2 (where ˙γ is the imposed shear rate) and depends on the normalized surface separation ǫ = r/a − 2 as written in Eq. 5:
F = F0
e−τ.ǫ
1 − e−τ.ǫ if ǫ ≤ ǫr
F = 0 if ǫ >ǫr
(5)
We have chosen this electrostatic-like force because it is able to balance the viscous force and stop the radial relative motion of particles when their surfaces approach at a distance approximately equal to the roughness. Thus the parameters F0 and τ are empirically
chosen such that the normalized minimum distance of approach between particle surfaces is close to ǫr whatever the volume fraction probed in this study. We took τ =2000 and
F0 = 3.4 104 for the first type of force (f7). With those values, the normalized intensity
hydrodynamic force between two spheres alone in shear flow with their centers aligned in the compressional direction and their surface ǫra apart. We found a normalized minimum
distance of approach of 3.0 10−3 at φ = 0.1 and 2.6 10−3 at φ = 0.55. This is satisfactory
but the small roughness and the strength of the repulsive force may lead to high relative velocity, requiring a very short integration time step and thus a quite long computation time. The main results have been obtained with the force f7, but we have used another set of parameters too, in order to change the particle roughness (force f11). Then the normalized distance of closest approach turned out to be nearly 1.5 10−2. The parameters F0 and τ for both force types are gathered in table 1.
Table 1: Interaction potential parameters
Potential F0 τ ǫr
f7 3.4 104 2000 3 10−3 f11 2.7 1014 2000 1.5 10−2
4
Results
In this section, we study the influence of the particle volume fraction on the pair distribution function. The volume fraction ranges from 0.05 to 0.56. In [Blanc et al. (2011a)] we presented a high resolution PDF of a semi dilute suspension (Fig.5 Φ = 0.05). The PDF was shown to be anisotropic and fore-aft asymmetric with a depleted area in the recession quadrant. Furthermore, a tail-like high particle concentration zone is observed in the recession quadrant that is not present in the approach quadrant. This fore-aft asymmetry was quantitatively explained by the particle roughness which modifies the particle pair trajectories [Blanc et al. (2011a); Da Cunha and Hinch (1996)]. The comparison between the PDF from the experiments and from a model based on rough particle pair trajectories allowed us to estimate the minimum approach distance between particles, ǫra, which is also
the characteristic height of the roughness measured using an AFM is 200 nm (section 2.1). As the volume fraction increases, the model based on pair trajectories does not hold any more since multibody interactions have to be accounted for and the experimental results presented below will be compared to numerical simulations.
Fig. 5 shows experimental 2D-PDF for various volume fractions. These measurements were performed without preshearing, over deformations small enough that shear-induced concentration variations are not too large. To evaluate this point, we selected three criteria:
(i) the rotor angular velocity is constant (the expected outward migration would result in an increase of the rotor speed)
(ii) the volume fraction, estimated upon counting the particles, is nearly constant in the gap.
(iii) the PDF does not depend on the size of zone A, except for statistical noise.
These criteria are completely fulfilled for φ ≤ 0.45. For φ = 0.50 and φ = 0.55, shear-induced particle migration is very fast, as pointed out in [Ovarlez et al. (2006)] and the PDF must be measured during the very first moments following the application of the torque. From particle counting at the end of the PDF measurement, the concentration is estimated to vary between 0.48±0.02 near the bob and 0.53±0.02 near the cup for φ = 0.5 and between 0.53±0.02 and 0.57±0.02 for φ = 0.55. In spite of these variations, that are weak in the central zone A (see figure 11), criterion (iii) turns out to be fulfilled.
Tab. 2 summarizes the experimental parameters used in each experiment. These pa-rameters are the result of a compromise between the need to limit shear-induced migration effects and to acquire as many images as required for good statistics. At last, one can notice that the bob angular velocity is not constant from one experiment to another but we veri-fied that PDF does not depend on the shear rate (at least in the range 0.05 s−1! ˙γ ! 1 s−1
or 0.1 rpm ! Ω ! 2 rpm). This is shown on figure 4 where the angular variation of the pair distribution function integrated over the interval 1.77 " ρ/a " 2.11 (see Eq.(7) below) is displayed for different angular velocities. This observation is also very important for the
validity of the measurements reported in this paper since the shear rate is not constant in the gap. For a Newtonian fluid, the shear rate is approximately 1.5 times larger near the inner cylinder than near the outer one.
−
π2−
π40
π4 π20
.5
1
1
.5
2
2
.5
3
θ
< g >
ρ0.05 rpm
0.56 rpm
2.46 rpm
Figure 4: ρ-integrated PDF for different shear rate values. The radial integration interval is 1.77 " ρ/a " 2.11. Φ=0.40. zmax/a ≈0.5.
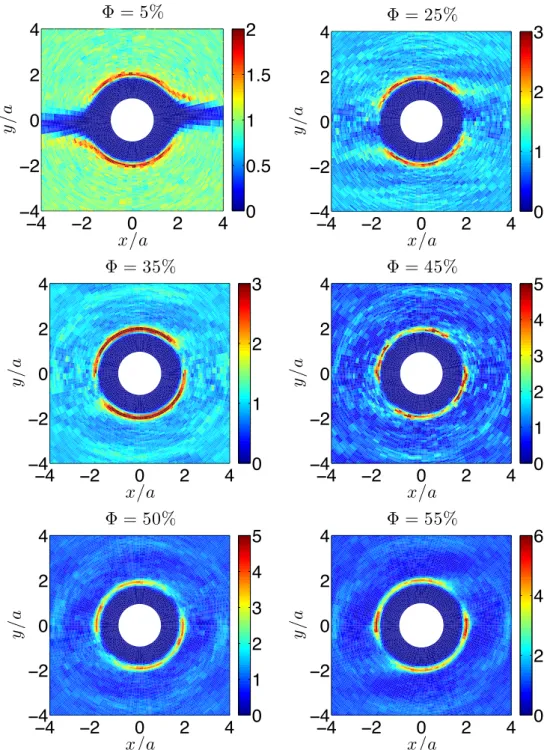
The variation of g(ρ, θ) with the particle fraction is displayed in Fig.5. Whatever the particle volume fraction, the PDF shows a strong pair correlation zone near ρ/a = 2 in the compressional quadrant (xy < 0) and a depleted zone in the extensional quadrant. As the particle concentration increases, the depleted zone that is close to the velocity direction θ = 0 for φ = 0.05, rotates toward the dilatation axis direction θ = π/4. For Φ ≥ 0.45 a secondary depletion zone appears in the compressional quadrant near θ = 3π/4 and simultaneously, a high pair correlation zone emerges near the mean flow direction. The higher is the particle concentration, the more pronounced the peak measured around θ = 0. The same qualitative features can be observed on the PDF from the numerical simulations
!!
!"
#
"
!
!!
!"
#
"
!
x/a
y
/
a
Φ = 5%
#
#$%
&
&$%
"
!! !" # " ! !! !" # " ! x/a y / a Φ = 25% # $ " % !! !" # " ! !! !" # " ! x/a y / a Φ = 35% # $ " % !! !" # " ! !! !" # " ! x/a y / a Φ = 45% # $ " % ! & !! !" # " ! !! !" # " ! x/a y / a Φ = 50% # $ " % ! & !! !" # " ! !! !" # " ! x/a y / a Φ = 55% # " ! $Figure 5: Experimental PDF for different values of the volume fraction. xy < 0 defines the compressional quadrant. θ = 0 is the ambient velocity direction. zmax/a ≈ 0.6 for all
Table 2: Experimental parameters. Suspensions were sheared at a rotor speed Ω. Nimage
is the number of images during the experiment. f is the frame sampling frequency.
Φ Ω (rpm) Nimages f (Hz) 0.05 1 50000 1/60 0.10 1 1000 1/60 0.15 1 1000 1/60 0.20 1 1000 1/60 0.25 1.1 320 8 0.30 0.29 1600 8 0.35 0.3 1600 8 0.40 0.56 320 2 0.45 0.5 360 6 0.50 0.1 880 6 0.53 2 68 0.1 0.55 1 480 8 0.56 2 67 0.1 shown in Fig. 6.
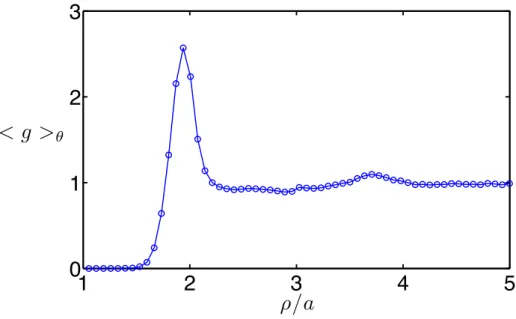
A more quantitative comparison between the experimental measurements and the sim-ulations of the PDF at contact (ρ/a ≈ 2) requires some care due to the particle size dispersion. Indeed, Fig.7 shows the variation of the PDF averaged over the angle θ:
< g >θ= 1 2π & 2π 0 g(ρ, θ)dθ (6)
The width of the peak at contact can be estimated to 0.25a, that is 12% of its radial position, and should be compared to the particle size dispersion, i.e. approximately 10%. Since no size dispersion has been taken into account in the simulations, it is not possible to compare the detailed radial variation of the experimental and numerical PDF around the peak position. As a consequence, in order to characterize the angular dependence of the PDF at contact, we have chosen to consider only the average of g(ρ, θ) over a ρ-interval ∆ρav that is larger than the width of the peak, i.e. ∆ρav=7px≈ 0.44 a.
< g >ρ= 1 ρ∗∆ρ av & ρ∗+∆ρav/2 ρ∗−∆ρav/2 ρ′ g(ρ′ , θ)dρ′ (7)
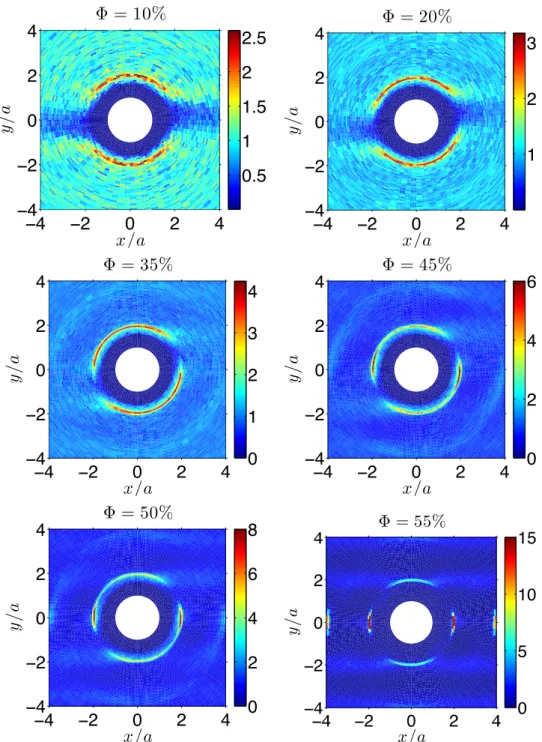
!! !" # " ! !! !" # " ! x/a y / a Φ = 10% #$% & &$% " "$% !! !" # " ! !! !" # " ! x/a y / a Φ = 20% $ " % !! !" # " ! !! !" # " ! x/a y / a Φ = 35% # $ " % ! !! !" # " ! !! !" # " ! x/a y / a Φ = 45% # " ! $ !! !" # " ! !! !" # " ! x/a y / a Φ = 50% # " ! $ % !! !" # " ! !! !" # " ! x/a y / a Φ = 55% # $ %# %$
Figure 6: PDF from the numerical simulations. xy < 0 define the compressional quadrant. θ= 0 is the ambient velocity direction. zmax/a=0.6
1
2
3
4
5
0
1
2
3
ρ/a
< g >
θFigure 7: PDF averaged over the angle θ. φ = 0.35. zmax/a ≈ 0.5
where ρ∗ is chosen to maximize < g >
θ (Eq.6) and may fluctuate (±1px) from one PDF to
another due to statistical noise.
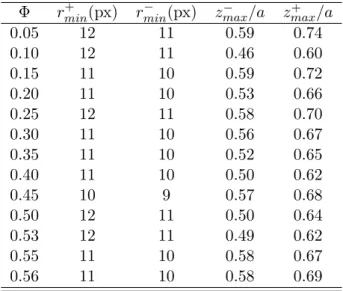
Another issue in the comparison between experimental and numerical PDF is the choice of zmax/a. The angular PDF at contact < g >ρ from the simulated suspensions have been
computed with the same value of zmax/a = 0.6 whatever the particle volume fraction.
Most of the time, this value does not correspond exactly to an integer value of rmin in
the experiment (Fig.3). For that reason, the experimental angular PDF at contact is computed for the two values of rmin, denoted by r
±
min, such that the corresponding zmax
enclose 0.6a. The values of rmin± and z∓
max/a for all volume fractions are gathered in table
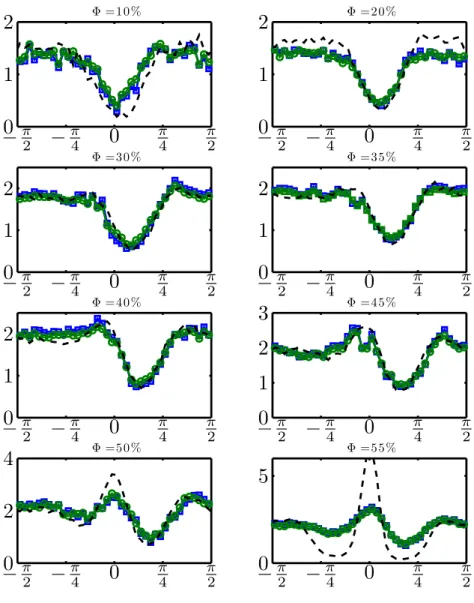
3, and Fig. 8 displays the angular variation of < g >ρ from the simulations, together
with the experimental PDF. The PDF measurements are in good agreement with the numerical computations up to φ = 0.45%. At φ = 0.55, the discrepancy is concomitant with the arrangement of the suspension particles in strings in the simulation (but not in the experiment), that could originate in the small size of our simulation box (see the discussion in section 5). Those strings result in the peaks at x/a = ±4 and the horizontal clear strips
Table 3: Values of rmin± and z∓
max/a used in computing the experimental angular PDF
displayed in fig.8
Φ rmin+ (px) r−
min(px) zmax− /a zmax+ /a
0.05 12 11 0.59 0.74 0.10 12 11 0.46 0.60 0.15 11 10 0.59 0.72 0.20 11 10 0.53 0.66 0.25 12 11 0.58 0.70 0.30 11 10 0.56 0.67 0.35 11 10 0.52 0.65 0.40 11 10 0.50 0.62 0.45 10 9 0.57 0.68 0.50 12 11 0.50 0.64 0.53 12 11 0.49 0.62 0.55 11 10 0.58 0.67 0.56 11 10 0.58 0.69 at y/a = ±2; ±4 in Fig.6.
In order to measure the overall rotation of the PDF, the angular position θ∗ of the
primary minimum of the angular PDF < g >ρ (θ) is determined upon fitting a second
order polynomial to 5 points across the minimum. Since the experimental PDF for rmin+ and r−
min are very close to each other, the average of the two angles θ∗ is computed for each
volume fraction. Fig. 9 shows the evolution of θ∗ with the particle volume fraction. Two
numerical curves are also displayed, that correspond to force types f7 and f11, that yield the distance of closest approach of two particles at φ=0.1 respectively equal to 3.10−3a (i.e.
the particle roughness in the experiment) and 1.5.10−2a. Concerning the experimental data, for concentrations larger than a characteristic volume fraction Φc ≈0.13 , θ∗ grows
almost linearly to reach π/4 when Φ tends to Φm. Below Φc, θ∗ seems to be constant. The
agreement between the experimental and numerical data (f7) is satisfactory. As expected, the comparison between the PDF from the simulation using (f7) and (f11) evidences that an increase of the roughness height results in the increase of the angle θ∗. We note that
Φ =10%
−
π 2−
π 40
π 4 π 20
1
2
Φ =20%−
π 2−
π 40
π 4 π 20
1
2
Φ =30%−
π 2−
π 40
π 4 π 20
1
2
Φ =35%−
π 2−
π 40
π 4 π 20
1
2
Φ =40%−
π 2−
π 40
π 4 π 20
1
2
Φ =45%−
π 2−
π 40
π 4 π 20
1
2
3
Φ =50%−
π 2−
π 40
π 4 π 20
2
4
Φ =55%−
π 2−
π 40
π 4 π 20
5
Figure 8: Angular PDF < g >ρ for different values of the volume fraction Φ. θ < 0 define
the compressional quadrant. θ = 0 is the ambient velocity direction. Radial integration range 1.7 < ∆ρav/a < 2.2. Dashed line: numerical simulations (force f7, zmax/a=0.6).
Circle and square: experimental measurements for r−
minand rmin+ with zmax(rmin+ ) < 0.6a <
Φ θ∗ 0 0.1 0.2 0.3 0.4 0.5 0.6 0 π 16 π 8 3π 16 π 4 E xp num − f 7 num − f 11
Figure 9: Angular position of the main depletion zone as a function of the particle volume fraction. Circle: experimental measurements. For Φ < Φc ≈ 0.13, θ∗ ≈ 4.5◦. Square:
numerical data. Solid line: distance of closest approach at φ = 10% : 3.10−3a. Dashed line: distance of closest approach at φ = 10% : 1.5.10−2a. Dashed dotted line: estimation of the characteristic volume fraction φc ≈0.13
5
Discussion
As recalled in section 4, the PDF of the dilute suspension (Φ=0.05) displayed in Fig.5 has been discussed in a previous paper [Blanc et al. (2011a)] where it has been shown to be in quantitative agreement with a model based on the trajectories of a rough particle pair in a simple shear flow. The particle roughness is responsible for eliminating the closed orbit trajectories [Blanc et al. (2011a)], making the PDF anisotropic. Moreover, it breaks the reversibility, with respect to shear reversal, of the trajectories that drive the particles in contact and thus makes the PDF asymmetric with respect to the plane (*∇v, *∇ ×*v). As noted in section 4, the increase of the volume fraction up to 0.45 mainly results in a rotation of the PDF toward the recession axis of the ambient flow. The experimental measurements evidence two regimes, separated by a characteristic concentration Φc. The
very weak variation of θ∗
below Φc turns to a linear increase above it. This behavior clearly
recalls the experimental measurements of normal stress differences reported by Boyer et al. (2011) and later by Dbouk (2011). These papers show a linear variation of the normal stress differences normalized by the shear stress as a function of the particle volume fraction above a characteristic value φc. This similarity illustrates the strong connection that prevails
between microstructure and rheology.
Concerning the influence of particle roughness, as already shown by Drazer et al. (2002) in their numerical study on dilute suspensions, the increase of the roughness is expected to result in the increase of the angle θ∗. We plan to check this trend upon changing the
roughness of the particles that we used in the present study. The induced variation of the normal stress differences should also be measured, in order to explore the possible connection between the PDF orientation and the normal stress differences.
Above Φ=0.45, the emergence of a secondary depletion area and of a peak in the velocity direction constitute a striking feature. The peak indicates a strong probability of pairs aligned in the velocity direction. The question arises if these doublets are the consequence of a wall influence or not. Indeed, above this same volume fraction Φ=0.45, near the the cell walls, an organization of the particles parallel to walls is observed. Such
0
20
40
0
1
2
3
4
R/a
Φ/ ¯
Φ
Figure 10: Concentration profile normalized by its mean value as a function of the normal-ized distance from the rotor. ¯Φ=0.53
a layering clearly appears in Fig. 10 where the concentration profile deduced from particle counting is displayed for a Φ=0.53 suspension. However, this layering, that is due to the wall smoothness at the particle scale, extends only over five particle diameters from the walls, that is significantly smaller than the gap width (30 diameters). Moreover, the lack of higher order peak in the velocity direction even for the largest probed volume fractions precludes a large scale organization in the center of the gap. Finally, we have checked that the measured PDF does not depend on the size of window A in which the origin particles (1) are chosen. This is shown in Fig. 11 where the angular PDF < g >ρ of a suspension,
0.53 in volume fraction, is displayed for different radial thickness of the centered window A. There is not any significant variation, suggesting that the PDF at contact is quite uniform over the gap, except near the walls. Nevertheless, to precise the influence of the wall on this peak from an experimental point of view, it would be necessary to repeat the measurements for different gap width values, what we plan to do as soon as possible. At present, it seems to us that numerical studies have not allowed to rule out the wall as an explanation for
−
π2−
π40
π40
.5
1
1
.5
2
2
.5
3
3
.5
−
π2−
π40
π4 π20
.5
1
1
.5
2
2
.5
3
3
.5
−
π2−
π40
π40
.5
1
1
.5
2
2
.5
3
3
.5
−
π2−
π40
π40
.5
1
1
.5
2
.5
3
3
.5
θ
< g >
ρ∆ =8 a
∆ = 16a
∆ = 32a
∆ = 44a
Figure 11: Influence of the radial width ∆ of window A on the PDF. Window A is centered on the middle of the gap. Φ=0.53. zmax/a ≈ 0.6
the peak in the velocity direction at contact. Indeed, our own simulations in Stokesian Dynamics clearly evidence the peak and the secondary depletion area, even though no real walls are included in the simulation geometry. We note that this behavior has already been reported in previously published Stokesian Dynamics simulations [Morris and Katyal (2002)] for moderate P´eclet number (Pe=1000). However, we think that the periodicity of the simulation geometry together with the relatively small number of particles (125 in our simulations and 242 in [Morris and Katyal (2002)]) might have similar consequences as real walls, as already suggested by Morris and Katyal (2002). This effect is expected to be even more important in our simulation, considering that the computation cell size at the largest volume fractions is about 10a, i.e. the typical width of the structured layer observed in the experiments. Numerical results obtained with more particles (1000) at Pe = ∞ have been
published [Sierou and Brady (2002)], but the authors did not present large volume fraction PDF (Φ > 0.4) in the plane of shear. They report string formation for Φ >0.5 (that we observe in our simulations at φ = 0.55 but not in our experiments) and even crystallization
in the plane (*∇v, *∇ ×*v), but they do not allude to any single peak in the velocity direction. On the other hand, simulation in Force Coupling Method have been published at Pe= ∞,
where the sheared suspension is confined between solid walls [Yeo and Maxey (2010a)]. The authors clearly evidenced a peak in the velocity direction for the largest volume fraction (Φ =0.4), together with a strong structuration at the walls. They changed the gap width Ly from 10a to 30a, and compared both the PDF and the stress in the central (core) region
of the gap and near the walls. They found that the layered structure at the wall was connected with a smaller viscosity. They report a small variation of the core viscosity as Ly
increases from 20a to 30a. Unfortunately, they did not study the possible variation of the core PDF with the gap width. We think that some experiments and numerical simulations with different gap width values should clarify this point. It is all the more interesting if we recall a striking feature that has already been noted by Morris and Katyal (2002): the shear-induced self diffusion coefficients from experiments and simulations increases with the volume fraction up to Φ ≈0.45 and then turns to a plateau. This could be connected with the high probability of aligned particles pair in the velocity direction. Indeed, the particles inside such pairs are expected to weakly interact with each other, since the ambient flow does not tend to bring them together. This may result in weaker shear-induced diffusion coefficients.
6
Concluding remarks
The pair distribution function of non-Brownian suspensions in a simple shear flow has been measured for a wide range of particle concentration (0.05 ≤ Φ ≤ 0.56). For all particle concentrations, the PDF has been shown to be fore-and-aft asymmetric with a strong pair correlation zone at contact in the approach side of the reference particle and a depletion of pairs in the receding side. At low particle volume fraction, the depleted area is close to the velocity direction and is tilted as the particle concentration is increased. Actually, for moderate particle volume fractions (lower than 0.45) the increase of the particle concen-tration mainly results in a rotation of the PDF around the vorticity axis. This trend has
been quantified by the measurement of the angle θ∗, where the PDF is minimum. Above a
characteristic volume fraction, approximately equal to 0.13, θ∗ has been shown to increase
almost linearly. At very high concentrations (Φ ≥ 0.45), new features appear such as a sec-ondary depleted area in the compressional quadrant and a probability peak in the velocity direction.
In a previous paper [Blanc et al. (2011a)], we showed that the experimental PDF, obtained for a dilute suspension (Φ = 0.05) compared very well with a simple model based on rough particle pair trajectories. In the present paper, the particle roughness has been introduced as a normal repulsive force between particles in Stokesian Dynamics simulations to compute the PDF at higher particle concentration. The numerical results are in very good quantitative agreement with the experimental measurements as long as the particle volume fraction is lower than 45%. For higher concentrations, the simulations show the same qualitative behavior as the measurements (i.e. a secondary depleted zone and a probability peak in the velocity direction) but in a more pronounced way. This difference may be explained by the effect of the flow cell size that could be more important in the numerical simulations than in the experiments.
Appendix: Particles detection process
A particle appears on a frame as a black disk, whose radius is a function of the distance from the laser plane. As it will appear in the next section, we need the positions of the particle centers in the laser plane and their apparent radii. Both can be measured using a process based on a Circular Hough Transform (CHT) [Duda and Hart (1972); Kimme et al. (1975)]. The Matlab CHT script used in this study was originally developed by Tao Peng and can be found on the web2. Fig.12 displays an image of a suspension, 0.55 in volume fraction, on which the detected circles are superimposed. The process can be broken down into the following steps:
2
300
400
500
600
0
50
100
150
200
250
Non detected particle Rejected spurious detection
Figure 12: False color image of detected particles in a 0.55 suspension. Cross : centre. Circle : detected edge. Arrow : examples of non detected particles and false detection corrected by step (iii) of the detection process. Length in pixel.
(i) The raw image intensity profile I0(x, y) is normalized by a reference profile denoted
by Ib(x, y). Ib(x, y), that is obtained from I0(x, y) using a Gaussian low-pass filter, 50
pixels in width, follows the slow spatial evolution due to the non uniform laser sheet illumination in the gap. As a consequence, the large spatial scale intensity level and contrast of the normalized intensity profile If(x, y) = II0b(x,y)(x,y) are quite uniform over
the frame.
(ii) A CHT is then applied to If(x, y). The radii rk are determined with a resolution of 1
pixel, and the center coordinates (ak, bk) with a resolution of approximately 1/10 px.
(iii) Non proper detections often occur in empty zones between particles (see fig. 12). To limit these spurious detections, and since real particles appear as black disks, we reject centers (ak, bk) that do not check the threshold condition I0(ak, bk) < Ithr, where Ithr
is empirically set.
The previous algorithm can generate some errors that we tried to estimate. First, some particles on the frame are sometimes not detected. For a few frames, we visually checked the detected particles against the picture. The proportion of missed particle was found to be less than 3%. The spurious detections (i.e. particles that do not exist) that occur after step (iii) of the previous algorithm are rare, less than 1%. The statistical error on the center positions measurement was assessed by the application of the CHT procedure to a reference image in which one hundred of circles was randomly positioned. We found an accuracy of 0.1 pixel in the center position determination. Furthermore, a relative error of about 30% occurred for truncated circles appearing near the edges of the image. We therefore excluded particles detected in this region to compute the pair distribution function. The accuracy of the radius measurement was estimated by computing the apparent radii distribution from 2420 frames taken of a concentrated suspension, 0.55 in volume fraction. It was compared to the theoretical radii distribution produced by a planar cut through a random monodisperse spheres arrangement [Blanc (2011); Pomeau (1983)]. It was found that the numerical process undervalued radius length of about 1 pixel relative to the expected value.
We note that no circle of radius less than 6 pixels is detected, but, as we will see, it does not affect the PDF calculation.
References
Abbas, M., E. Climent, and O. Simonin, “Fully coupled simulations of non-colloidal monodisperse sheared suspensions,” Chemical Engineering Research and Design 85, 778– 791 (2007).
Batchelor, G. and J. Green, “The determination of the bulk stress in a suspension of spherical particles to order c2,” Journal of Fluid Mechanics 56, 401–427 (1972).
Blanc, F., Rh´eologie et microstructure des suspensions concentr´ees non browniennes, Ph.D. thesis, Universit´e de Nice. France (2011).
Blanc, F., F. Peters, and E. Lemaire, “Experimental signature of the pair trajectories of rough spheres in the shear-induced microstructure in noncolloidal suspensions,” Physical Review Letters 107, 208302 (2011a).
Blanc, F., F. Peters, and E. Lemaire, “Local transient rheological behavior of concentrated suspensions,” Journal of Rheology 55, 835–854 (2011b).
Blanc, F., F. Peters, E. Lemaire et al., “Particle image velocimetry in concentrated sus-pensions: Application to local rheometry,” Applied Rheology 21, 23735 (2011c).
Bossis, G. and J. Brady, “Dynamic simulation of sheared suspensions. i. general method,” The Journal of chemical physics 80, 5141–5154 (1984).
Boyer, F., O. Pouliquen, and ´E. Guazzelli, “Dense suspensions in rotating-rod flows: normal stresses and particle migration,” Journal of Fluid Mechanics 1, 1–21 (2011).
Brady, J. and G. Bossis, “Stokesian dynamics,” Annual review of fluid mechanics 20, 111– 157 (1988).
Brady, J. and J. Morris, “Microstructure of strongly sheared suspensions and its impact on rheology and diffusion,” Journal of Fluid Mechanics 348, 103–139 (1997).
Da Cunha, F. and E. Hinch, “Shear-induced dispersion in a dilute suspension of rough spheres,” Journal of Fluid Mechanics 309, 211–223 (1996).
Dbouk, T., Rheology of concentrated suspensions and shear-induced migration, Ph.D. thesis, Universit´e de Nice. France (2011).
Drazer, G., J. Koplik, B. Khusid, and A. Acrivos, “Deterministic and stochastic behaviour of non-brownian spheres in sheared suspensions,” Journal of Fluid Mechanics 460, 307– 335 (2002).
Drazer, G., J. Koplik, B. Khusid, and A. Acrivos, “Microstructure and velocity fluctuations in sheared suspensions,” Journal of Fluid Mechanics 511, 237–263 (2004).
Duda, R. and P. Hart, “Use of the hough transformation to detect lines and curves in pictures,” Communications of the ACM 15, 11–15 (1972).
Gadala-Maria, F. and A. Acrivos, “Shear-induced structure in a concentrated suspension of solid spheres,” Journal of Rheology 24, 799–814 (1980).
Gao, C., S. Kulkarni, J. Morris, and J. Gilchrist, “Direct investigation of anisotropic sus-pension structure in pressure-driven flow,” Physical Review E 81, 041403 (2010).
Husband, D. and F. Gadala-Maria, “Anisotropic particle distribution in dilute suspensions of solid spheres in cylindrical couette flow,” Journal of Rheology 31, 95–110 (1987).
Kimme, C., D. Ballard, and J. Sklansky, “Finding circles by an array of accumulators,” Communications of the ACM 18, 120–122 (1975).
Kolli, V., E. Pollauf, and F. Gadala-Maria, “Transient normal stress response in a concen-trated suspension of spherical particles,” Journal of Rheology 46, 321–334 (2002).
Morris, J. and B. Katyal, “Microstructure from simulated brownian suspension flows at large shear rate,” Physics of Fluids 14, 1920–1937 (2002).
Narumi, T., H. See, Y. Honma, T. Hasegawa, T. Takahashi, and N. Phan-Thien, “Transient response of concentrated suspensions after shear reversal,” Journal of Rheology 46, 295– 305 (2002).
Ovarlez, G., F. Bertrand, and S. Rodts, “Local determination of the constitutive law of a dense suspension of noncolloidal particles through magnetic resonance imaging,” Journal of Rheology 50, 259–292 (2006).
Parsi, F. and F. Gadala-Maria, “Fore-and-aft asymmetry in a concentrated suspension of solid spheres,” Journal of Rheology 31, 725–32 (1987).
Pomeau, Y., “Sur un probl`eme de st´er´eologie.” Annales de l’institut Henri Poincar´e (A) Physique th´eorique 38, 75–80 (1983).
Rampall, I., J. Smart, and D. Leighton, “The influence of surface roughness on the particle-pair distribution function of dilute suspensions of non-colloidal spheres in simple shear flow,” Journal of Fluid Mechanics 339, 1–24 (1997).
Sierou, A. and J. Brady, “Rheology and microstructure in concentrated noncolloidal sus-pensions,” Journal of Rheology 46, 1031–1056 (2002).
Wilson, H. and R. Davis, “The viscosity of a dilute suspension of rough spheres,” Journal of Fluid Mechanics 421, 339–367 (2000).
Yeo, K. and M. Maxey, “Dynamics of concentrated suspensions of non-colloidal particles in couette flow,” Journal of Fluid Mechanics 649, 205–231 (2010a).
Yeo, K. and M. Maxey, “Simulation of concentrated suspensions using the force-coupling method,” Journal of Computational Physics 229, 2401–2421 (2010b).
Zarraga, I., D. Hill, and D. Leighton Jr, “The characterization of the total stress of con-centrated suspensions of noncolloidal spheres in newtonian fluids,” Journal of Rheology 44, 185–220 (2000).