Essays on the Organizational Consequences of
On-line Behavior of Audiences
by
Rebeka Johnson
Thesis submitted in partial fulfillment of the requirements for the degree of Doctor of Philosophy
Institute of Management (IMA)
Università della Svizzera Italiana (USI), Lugano, Switzerland August 2015
ABSTRACT
Over the past 2 decades, internet use has become increasingly more a part of our every-day lives. We communicate with our friends and colleagues using the internet, we work using the internet, we also shop using the internet. We learn and increase our knowledge from information available on the internet. While on the one hand, we advance from the instant access to online contexts individualistically, on the other hand we participate as members of a community for example when we share our experiences online.
The ever growing use of the internet and its flourish in new segments of our daily life brings significant changes not only to us, the individuals, but also to the organizations. In the past decade, there has been a shift in the field of organizational theory considering the environment of organizations. Current approaches extend the horizon of the classical view proclaiming that organizational environment is not only constituted by rival organizations but also their audience members. Several studies found evidence that audience members’ perceptions and behavior in-fluence organizational success. For example, category-spanning organizations on average suffer from social and economic disadvantages in markets because they cannot meet the expectations of their audiences. This shift towards understanding the effect of audience responses on the orga-nizational outcome motivates my dissertation. More specifically, I study how individuals on-line behavior affects organizations. I analyze three aspects of internet mediated communication and their consequences to the organization.
Firstly, I address the need to compare how traditional face-to-face communication compares to the modern email communication (Chapter 2). Studies tend to take it for granted, that on-line information exchange mirrors it’s off-line counterpart at the work place. Although, there are great advantages in the availability of email data, as it retains communication in its completeness, it does not fully correspond to previously studied relations, like friendship or advice seeking. The characteristics of on-line communications also differ from off-line information exchange. Employees respect divisional and hierarchical boundaries in face-to-face conversations while these boundaries are blurred out within the email exchange .
Secondly, I analyze a special type of on-line behavior, the on-line word-of-mouth communication among audience members (Chapter 3). Online reviews play an increasingly important role in shaping organizational performance. Drawing conclusions on how customers perceive quality and typicality of a producer and how it manifests in on-line ratings increase the predictability of producer success.
Thirdly, I approach audience behavior from a collective behavior perspective (Chapter 4). Specifically, I analyze audience dynamics with threshold models. Doing so I address the micro level mechanism of how audience behavior creates certain macro level patterns of producer success rather than assuming that they are simple aggregates of individual characteristics.
Contents
1 Introduction 1
1.1 Background . . . 1
1.1.1 Attention shift to the audience members . . . 1
1.1.2 On-line behavior . . . 3
1.2 Motivation . . . 5
1.3 Outline of the thesis . . . 5
2 A comparison of email networks and off-line social networks: A study of a medium-sized bank* 9 2.1 Introduction . . . 10
2.2 Data . . . 11
2.3 Analyses: Comparison of survey-base and email-based social networks . . . 19
2.3.1 Network correlations and descriptive statistics of the networks . . . 19
2.3.2 Comparison of the networks along centrality measures . . . 20
2.3.3 Analyzing the networks with Exponential Random Graphs . . . 20
2.3.4 Results of the exponential random graph models . . . 23
2.3.5 Can emailing behavior be explained with off-line social networks? . . . 26
2.3.6 Possible explanations for the findings . . . 27
2.4 Discussion . . . 29 3 Contrasting alternative explanations for the consequences of category spanning:
A study of restaurant reviews and menus in San Francisco* 34
3.1 Introduction . . . 35
3.2 Theoretical background and hypotheses . . . 38
3.2.1 The producer-side: How category spanning affects average quality . . . 40
3.2.2 The audience-side: Category spanning, typicality, and audience evaluations 42 3.2.3 The interaction between category spanning and quality: How high-quality organizations can benefit from category spanning . . . 44
3.2.4 Distinguishing the “food court” and the “fusion” type of category spanning . 46 3.3 Empirical setting, data sources, and data operationalization . . . 47
3.3.1 Restaurant ratings . . . 47
3.3.2 Restaurant menus . . . 48
3.3.3 Using the Zagat Guide to assess quality . . . 49
3.3.4 Quality, typicality, and price as dimensions of value . . . 50
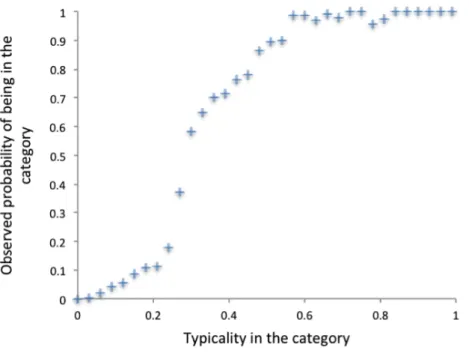
3.3.5 Assessing restaurant typicality . . . 51
3.3.6 Distinguishing “food court” and “fusion” type of category spanning . . . 57
3.4 Results . . . 58
3.4.1 Variables . . . 58
3.4.2 The main effect of category spanning . . . 60
3.4.3 Quality as a mediator of the negative effect of category spanning . . . 62
3.4.4 Typicality as a mediator of the negative effect of category spanning . . . 63
3.4.5 Robustness checks . . . 66
3.5 Discussion . . . 69
3.5.1 Limitations and future research . . . 71
3.6 Appendix . . . 81
4 The dynamics of project popularity from a collective behavior prospective: A study of creative crowdfunding 83 4.1 Introduction . . . 84
4.2 Theory and hypotheses . . . 88
4.2.1 Social valuation and the MusicLab experiment . . . 88
4.2.2 Social influence in audience members’ choices . . . 91
4.2.3 Threshold model of interdependent decisions . . . 92
4.2.4 Relationship between product attributes and individual thresholds . . . 94
4.2.5 Relation between social influence and objective conditions . . . 95
4.3 Empirical setting . . . 96 4.3.1 Crowdfunding . . . 96 4.3.2 Kickstarter.com . . . 98 4.4 Backer-level analysis . . . 100 4.4.1 Variables . . . 100 4.4.2 Results . . . 103 4.5 Project-level analysis . . . 109 4.5.1 Variables . . . 109 4.5.2 Results . . . 110 4.6 Conclusions . . . 121 4.7 Discussion . . . 122 5 Conclusions 129 5.1 Summaries of chapter results and contributions . . . 129
5.1.1 Chapter 2 . . . 130
5.1.2 Chapter 3 . . . 131
List of Tables
2.1 Demographic composition of the three departments included in the analysis, and
their comparison with the whole organization. . . 13
2.2 Survey questions . . . 17
2.3 Density of the networks and network correlations with QAP standard errors . . . . 19
2.4 Spearman Correlations among Centrality Measures of the Employees . . . 21
2.5 Result of the ERG models for the survey-based networks . . . 23
2.6 Result of the ERG models for three different operationalizations of the email data . 24 2.7 Result of the ERG models for the email networks, with the friendship, advice, and information flow networks as covariates . . . 26
3.1 Descriptive statistics and Pearson correlations for the main variables (N=56,605) . . 60
3.2 Ordered logit regressions on Yelp ratings . . . 61
3.3 Linear regressions on Zagat food quality scores . . . 62
3.4 The relationship between Zagat food quality scores and Yelp ratings (ordered logit regressions) . . . 63
3.5 The effect of category spanning on typicality (linear regression) . . . 64
3.6 The effect of typicality, quality, and category spanning on Yelp ratings (ordered logit regressions) . . . 67
4.1 Descriptive statistics of the backer profile . . . 105
4.2 Pairwise correlation of the backer profile . . . 106
4.4 Descriptive statistics of the project profile . . . 111 4.5 Pairwise correlations of the project profile . . . 112 4.6 Negative binomial regression on the project’s daily popularity . . . 113
List of Figures
2.1 Visualization of the all email, friendship, advice seeking, and information flow
net-works. . . 15
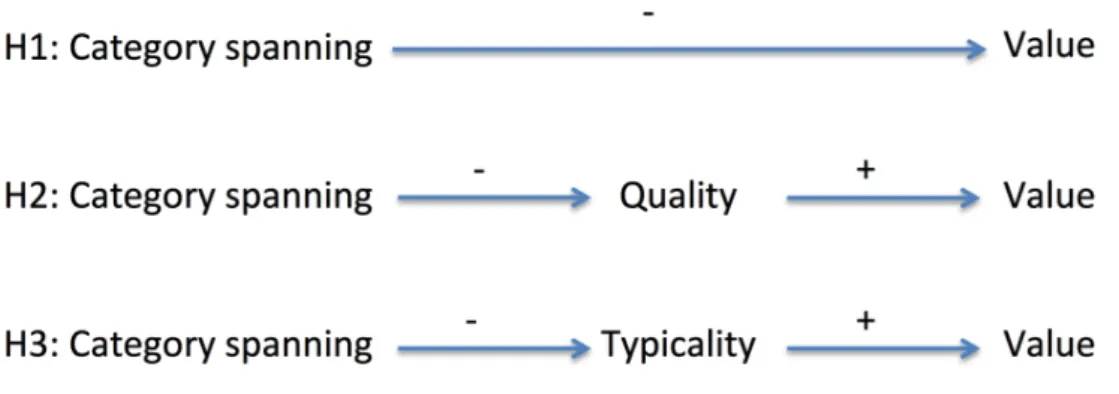
3.1 Visual representation of the three hypotheses . . . 42
3.2 Illustration of the format of restaurant menus on menupages.com . . . 49
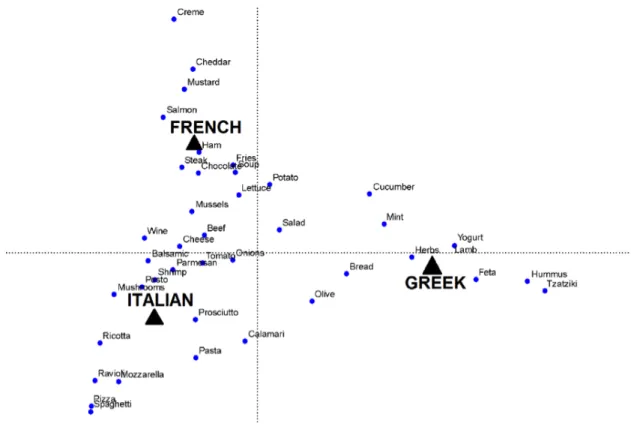
3.3 Category codes of three selected categories (Italian, French, Greek) . . . 54
3.4 Typicality and the probability that the restaurant will belong to that category . . . 55
3.5 Hierarchical clustering of restaurant cuisines with more than five instances . . . 56
3.6 Distribution of the rescaled typicality values of restaurants in the categories they are classified in . . . 57
3.7 Predicted effect of typicality . . . 68
4.1 Illustration of the project introduction page . . . 99
4.2 Distribution of typicality (cumulative count) . . . 104
4.3 Frequency distribution of number of daily backers . . . 113
Acknowledgement
Although I am the one who wrote the sentences of this dissertation, it embraces the work of many others. I would like to attribute it to the people, whose work remains invisible behind the lines but without which, I wouldn’t have been able to have written this thesis.
Firstly, I would like to express how grateful I am for the values I have learned from my family throughout my upbringing. They taught me the value of knowledge, the belief in one’s self, the values of hard work, and the ability to turn challenges into victories, among others. I believe my devotion towards research is in a big part due to the very inspiring conversations I had with two of my relatives, Mami and Papa, my grandparents, whom I miss a lot.
Secondly, I would like to say thank you to my graduate school professor, Prof. Tamás Rudas and to my former boss and co-author of one of my papers, András Vicsek, who both encouraged me to continue my studies in a form of a Ph.D. It meant a lot to me, that they expressed their opinion that I would be a good candidate for this career line. When times were hard, I was able to draw a lot of energy from their belief in me.
Thirdly, I am very grateful to my supervisor, Prof. Balázs Kovács, who put his trust in me. I feel that I am very fortunate to have such an excellent supervisor, who has continued to stand as a role model for me. Besides his extensive knowledge, experiencing his devotion to research and his commitment to teaching has had a very positive influence on me. He also never kept me waiting when I had a question - work related or otherwise, he was always available for me, which I highly appreciate.
Fourthly, I am thankful to Prof. Filippo Carlo Wezel who organized the Ph.D. program. Prof. Wezel spent much time on reaching out to top scholars to invite them to share their knowledge with the students. I believe that the quality of the program and his inspiring and insightful feedback helped me grow into a better scholar.
Fifthly, I would like to mention the role of my friends and fellow Ph.D’s. in my dissertation. I am grateful for the support I received from them, for the long discussions we had on our work or on other life matters, and also for showing me the fun side of the otherwise hard-working Ph.D.
life. Thank you Judit, Parvaz, Martina, Zsófi, Chanchal, Sayed, Ivona, Zsuzsi, Manos, Margarita and Lívia.
Next, focusing on the work after I became a mother was increasingly difficult, but our amazing team of grandparents did everything in their reach to help me achieve my goal.
Lastly, I am greatly indebted to Andrew, my husband. He supported me throughout the years not only with his unconditional love, but also helping me to find the time for my work when it was needed (even if it meant that he has to provide the dinner, help with the housework, or tend to our children). He took an active part in my thesis too. He helped me immensely with the data collection of the third paper. He thought me how to use perl programming language on a more advanced level, and helped me with tailoring my script according to the research question.
Chapter 1
Introduction
1.1 Background
1.1.1 Attention shift to the audience members
The question as to why a producer becomes successful trails a long history in organizational re-search. Typically scholars argued that the producer’s choices contain the key to success. Examples of such choices are, which industry segment to enter (Schmalensee, 1985; Rumelt, 1991), whether to enter into a highly competitive market or into a less competitive one (Carroll, 1985a), pro-ducing single or multiple products (Hoskisson and Hitt, 1988; Teece et al., 1994), becoming a specialist or generalist (Hannan et al., 2007b) and which other organizations to choose to enter a into relationship with (Gulati, 1995; Powell et al., 1996; Uzzi and Lancaster, 2004).
In recent years this focus on the producer shifted towards their audience. Studies of legitimacy showed that audience members play a key role in shaping organizations such that audience members put pressure on the producer to conform and fulfill their shared beliefs of the product (Suchman, 1995; Zuckerman, 1999a; McKendrick and Carroll, 2001b; Hsu, 2006c). Hsu found evidence that producers who meet the expectations of their audience are more successful (Hsu, 2006c).
This shift in the literature led to further, more detailed research on how audience perception of the producers’ identity influences the producers’ success . These studies however mainly focus
on a certain segment of the audience - on the critics claiming that experts as third parties of “mediated markets” (Zuckerman, 1999a) through their distinguished role affect other audience members’ attention and evaluation patterns (Hsu, 2006c).
Critics as third parties of “mediated markets” (Zuckerman, 1999a) through their distinguished role affect other audience members’ attention and evaluation patterns (Hsu, 2006c). Zuckerman argues that the role of a professional critic is to account for the magnitude of mismatch between the product and its social identity. The critic perceives a product illegitimate and devalues it if the product doesn’t fit well into the expectations of the audience. Zuckerman refers to the critics as the primary audience whose behavior influences the secondary audience, the actual buyer’s behavior. There has been research conducted on other domains such as the film industry (Zuckerman and Kim, 2003; Hsu, 2006c) or French cuisine (Rao et al., 2003b, 2005) documenting similarly to Zuckerman’s study on stock prices (Zuckerman, 1999a) that intermediaries can serve as good estimates of producer success.
There are a few reasons however why information purely on intermediaries cannot serve as perfect proxies of producer success. Firstly, Zuckerman and colleagues points it out that these studies disregard the structure of the primary audience (Zuckerman et al., 2003b), the structure of the actual buyers, which could lead to different effects. A product has to meet the expectations of all its audience, who are coming from different backgrounds with different tastes, holding different opinions of the product in question and towards the category to which the product belongs. These expectations can be highly similar among the audience members leading to consolidation, and, at the other extreme, each member might hold diverse expectations (Zuckerman et al., 2003b) leading to different evaluation. Secondly, Critics may be pressured by both producer and audience side (Zuckerman and Kim, 2003) and by their personal preferences or assigned medium (Zuckerman and Kim, 2003), which further influences their evaluation. Thirdly, researches relying on data of critics so far have not shed light on the diverging influence intermediaries have on their audience. Zuckerman and Kim argue for example that for lowbrow movies, critics have less influence on the audience than for highbrow films. Fourthly, there might be specific audience segments, which do not follow intermediaries opinion and there are markets where intermediaries do not exist, for
example on the crowdsourcing market. Finally, studies prove that intermediaries often tend to specialize in certain categories, ignoring products in multiple categories (Zuckerman, 1999a) and leaving the innovating attempts solely to the secondary audiences’ judgment.
Recent studies responding to this critic extend their scope to follow full audience populations. Studies on the role of intermediaries in product success not only brought the secondary audience in the spotlight, but also emphasized the interconnectedness of audience members’ decisions.
1.1.2 On-line behavior
A few years ago The Economist magazine (July 1999)1 wrote that “the internet (will) change
everything - the way we work, the way we learn and play, even maybe, the way we sleep.” By now, nobody would disagree that this prediction has come true. What the Economist magazine did not predict in 1999, however, was that computer mediated communication shapes not only everyday behavior but it also fundamentally influences organizations.
Individual’s on-line behavior influences organizations in two aspects. Not only that internet eliminated the geography and time constrained boundaries of communication (Duan et al., 2008), but it also organizes individuals into loosely linked communities. Individuals communicate not only on a personal basis, but they exchange their opinions and experience through the world wide web.
Organizations offering on-line opinion sharing services to their audience on the one hand receive direct feedback from them, on the other hand use it as a marketing opportunity where audience members may influence each other through word-of-mouth . Since Amazon.com customer review system became exceedingly popular the number of business with similar services have since risen vastly (Chevalier and Mayzlin, 2006). Websites appeared in recent years, with the sole reason to publish reviews, for example TripAdvisor, Yelp, or Booking.com.
Access to users and buyers opinion before product purchase changed the dynamics of product evaluation (Putsis Jr et al., 1997; Godes and Mayzlin, 2004; Salganik et al., 2006; Chevalier and Mayzlin, 2006; Dellarocas et al., 2007; Luca, 2011b). Luca (2011b) demonstrates for example that
one star increase on the Yelp reviewer site may increase 5-9% the restaurant’s income. Chevalier and Mayzlin (2006) finds evidence that review content influences future purchases of prospective buyers altering the overall sale indexes. Liu (2006) shows the positive relationship between the size of TV show audiences and online reviews. “Online user reviews have become an important source of information to consumers, substituting and complementing other forms of business-to-consumer and offline word-of-mouth communication about product quality” argues Chevalier and Mayzlin (2006, page 1.). The number of consumers, who pay attention to online reviews prior to purchasing products is increasing every day. Kee (2008) finds that 68% of Internet users read at least four reviews before product purchase (Godes and Mayzlin, 2004). BizRate questioned 5,500 on-line consumers and found that, 44% of respondents consult reviewer sites before buying a product and even more, 59% of the respondents considered reviews written by their peers more valuable than the ones by experts (Piller, 1999). “Online product reviews provided by consumers who previously purchased products have become a major information source for consumers and marketers regarding product quality”, states Hu et al. (2008, page 201.).
Although, researchers undoubtedly find correlation between performance and online reviews, the underlying mechanism between the two is not yet clarified. On the one hand audience valuations influence product performance, while on the other hand product performance influences audience valuations too. Researchers studying only one side of the mechanism cannot differentiate between weather an increase in the product performance is due to higher quality or due to the effect of social influence (Duan et al., 2008).
The appearance of reviewer sites provides the possibility on the one hand to study audience populations (for example Hsu, 2006c; Kovacs and Johnson, 2013) to a more complete extent and highlights the challenge and on the other hand to understand the interconnectedness of audience behavior (Godes and Mayzlin, 2004; Chevalier and Mayzlin, 2006; Salganik et al., 2006; Salganik and Watts, 2008; Lee and Bradlow, 2011; Zuckerman, 2012).
1.2 Motivation
In the above section I intended to highlight the areas where audience members’ internet-mediated communication has a direct influence on the organization. In the next part of my dissertation I aim to answer three research questions which motivated my empirical investigations.
In the first study I argue that the rapid growth in on-line communication provides scholars with a goldmine of available data, which allows them to map the structure of communities. However, data from on-line sources does not reflect perfectly previously studied “off-line” relationships. I compare off-line to on-line interactions using exponential random graph (ERG) models to under-stand what aspect face-to-face communication approximates it’s on-line counterpart. I analyze the roles of the two different communication channels in reflecting organizational boundaries, organi-zational hierarchies and gender.
Secondly, studying online reviews I investigate why producers with multiple categories re-ceive lower ratings from reviewers than single-category producers. In the empirical investigation I directly test and disentangle typicality-based and quality-based explanations for the negative consequences of category spanning.
Thirdly, I analyze the interconnectedness of audience decisions of an online crowdsourcing platform. I address the micro level mechanism of how audience behavior creates certain macro level patterns of producer success rather than assuming that they are simple aggregates of individual characteristics. I approach audience members’ behavior from a collective behavioral perspective. Specifically, I analyze audience dynamics with threshold models.
1.3 Outline of the thesis
In the following sections I am going to introduce the above detailed studies in depth. Chapter 2 and Chapter 3 are based on the papers that I had published with my co-authors:
Johnson, R., Kovács, B., & Vicsek, A. (2012). A comparison of email networks and off-line social networks: A study of a medium-sized bank. Social Networks, 34(4), 462-469.
Kovács, B., & Johnson, R. (2013). Contrasting alternative explanations for the consequences of category spanning: A study of restaurant reviews and menus in San Francisco. Strategic Orga-nization, 12, 7-37.
Chapter 4 is a working paper constituted by unpublished material. In Chapter 5 I draw general theoretical conclusions based on the three empirical studies, and propose arenas for further research.
References
Carroll, G. R. (1985a). Concentration and specialization: Dynamics of niche width in populations of organizations. American Journal of Sociology, 90:1262–1283.
Chevalier, J. A. and Mayzlin, D. (2006). The effect of word of mouth on sales: Online book reviews. Journal of marketing research, 43(3):345–354.
Dellarocas, C., Zhang, X. M., and Awad, N. F. (2007). Exploring the value of online product reviews in forecasting sales: The case of motion pictures. Journal of Interactive marketing, 21(4):23–45.
Duan, W., Gu, B., and Whinston, A. B. (2008). Do online reviews matter?—an empirical investi-gation of panel data. Decision support systems, 45(4):1007–1016.
Godes, D. and Mayzlin, D. (2004). Using online conversations to study word-of-mouth communi-cation. Marketing science, 23(4):545–560.
Gulati, R. (1995). Does familiarity breed trust? the implications of repeated ties for contractual choice in alliances. Academy of management journal, 38(1):85–112.
Hannan, M. T., Polos, L., and Carroll, G. R. (2007b). Logics of organization theory: Audiences, codes, and ecologies. Princeton University Press.
Hoskisson, R. E. and Hitt, M. A. (1988). Strategic control systems and relative r&d investment in large multiproduct firms. Strategic Management Journal, 9(6):605–621.
Hsu, G. (2006c). Jacks of all trades and masters of none: Audiences reactions to spanning genres in feature film production. Administrative Science Quarterly, 51(3):420–450.
Hu, N., Liu, L., and Zhang, J. J. (2008). Do online reviews affect product sales? the role of reviewer characteristics and temporal effects. Information Technology and Management, 9(3):201–214. Kovacs, B. and Johnson, R. (2013). Contrasting alternative explanations for the consequences
of category spanning: A study of restaurant reviews and menus in san francisco. Strategic Organization, 12(7-37).
Lee, T. Y. and Bradlow, E. T. (2011). Automated marketing research using online customer reviews. Journal of Marketing Research, 48(5):881–894.
Liu, Y. (2006). Word of mouth for movies: Its dynamics and impact on box office revenue. Journal of marketing, 70(3):74–89.
Luca, M. (2011b). Reviews, reputation, and revenue: The case of Yelp.com. Technical report, Harvard Business School Working Paper, No. 12-016.
McKendrick, D. G. and Carroll, G. R. (2001b). On the genesis of organizational forms: Evidence from the market for disk drive arrays. Organization Science, 12:661–683.
Piller, C. (1999). Everyone is a critic in cyberspace. Los Angeles Times.
Powell, W. W., Koput, K. W., and Smith-Doerr, L. (1996). Interorganizational collaboration and the locus of innovation: Networks of learning in biotechnology. Administrative science quarterly, pages 116–145.
Putsis Jr, W. P., Balasubramanian, S., Kaplan, E. H., and Sen, S. K. (1997). Mixing behavior in cross-country diffusion. Marketing Science, 16(4):354–369.
Rao, H., Monin, P., and Durand, R. (2003b). Institutional change in toque ville: Nouvelle cuisine as an identity movement in french gastronomy1. American journal of sociology, 108(4):795–843.
Rao, H., Monin, P., and Durand, R. (2005). Border crossing: Bricolage and the erosion of cate-gorical boundaries in French gastronomy. American Sociological Review, 70(6):968–991.
Rumelt, R. (1991). How much does industry matter? Strategic Management Journal, (12):167–185. Salganik, M. J., Dodds, P. S., and Watts, D. J. (2006). Experimental study of inequality and
unpredictability in an artificial cultural market. science, 311(5762):854–856.
Salganik, M. J. and Watts, D. J. (2008). Leading the herd astray: An experimental study of self-fulfilling prophecies in an artificial cultural market. Social Psychology Quarterly, 71(4):338–355. Schmalensee, R. (1985). Do markets differ much? The American Economic Review, pages 341–351. Suchman, M. C. (1995). Managing legitimacy: Strategic and institutional approaches. Academy
of management review, 20(3):571–610.
Teece, D. J., Rumelt, R., Dosi, G., and Winter, S. (1994). Understanding corporate coherence: Theory and evidence. Journal of Economic Behavior & Organization, 23(1):1–30.
Uzzi, B. and Lancaster, R. (2004). Embeddedness and price formation in the corporate law market. American sociological review, 69(3):319–344.
Zuckerman, E. W. (1999a). The categorical imperative: Securities analysts and the illegitimacy discount. American journal of sociology, 104(5):1398–1438.
Zuckerman, E. W. (2012). Construction, concentration, and (dis) continuities in social valuations. Annual Review of Sociology, 38:223–245.
Zuckerman, E. W. and Kim, T.-Y. (2003). The critical trade-off: identity assignment and box-office success in the feature film industry. Industrial and Corporate Change, 12(1):27–67.
Zuckerman, E. W., Kim, T.-Y., Ukanwa, K., and von Rittmann, J. (2003b). Robust identities or nonentities? typecasting in the feature-film labor market1. American Journal of Sociology, 108(5):1018–1073.
Chapter 2
A comparison of email networks and
off-line social networks: A study of a
medium-sized bank*
Abstract
Recently there has been a surge in the availability of online data concerning the connections be-tween people, and these online data are now widely used to map the social structure of communities. There has been little research, however, on how these new types of relational data correspond to classical measures of social networks. To fill this gap, we contrast the structure of an email network with the underlying friendship, communication, and advice seeking networks. Our study is an ex-plorative case study of a bank, and our data contains emails among employees and a survey of the ego networks of the employees. Through calculating correlations with QAP standard errors and estimating exponential random graph (ERG) models, we find that although the email network is related to the survey-based social networks, emails networks are also significantly different: while off-line social networks are strongly shaped by gender, tenure, and hierarchical boundaries, the role of these boundaries are much weaker in the email network.
—————————————————— *with Balázs Kovács and András Vicsek
2.1 Introduction
The rapid growth in online communication provides social networks scholars with a goldmine of data. Previously, to obtain information on the social structure of communities, researchers had to conduct survey-based, observational, or archival research. Today, however, data on electronic networks are readily available. This surge in data availability allows network scholars to explore the structure of communities through emails (Grippa et al., 2006; Kleinbaum et al., 2008; Quintane and Kleinbaum, 2008, 2011), phone logs (Eagle et al., 2010), or online collaborations (Stewart, 2005).
Relying on online data to map the structure of communities is not necessarily a straightforward exercise. Researchers now use email networks as if they were perfect mirrors of communication (or other) networks (e.g., Grippa et al., 2006; Kleinbaum et al., 2008). But this is assumption is ques-tionable. Researchers need to understand how these online connections relate to previous “off-line” measures of relations and networks (Menchik and Tian, 2008; Matzat and Snijders, 2010). This paper provides an explorative case study, in which we compare the email network of a bank with the corresponding self reported friendship networks, information networks, and advice networks.
This paper adds to a few existing studies on the topic. Here, we briefly overview these studies in order to indicate how our current research extends them. Grippa et al. (2006) question the use of email data as a proxy for traditional social network analysis. In order to understand whether email parsing provides similar network structures as traditional social network analysis surveys do, Grippa et al. (2006) study the communication among employees of a small graduate school and compare network properties such as density, betweenness centrality, and core/periphery structure of various forms of communication. They find that email networks overestimate the communication of peers with technological expertise, but underestimate communication between the core and the periphery. In this article, we extend Grippa and colleagues’ analyses with the inclusion of attribute data and multiple survey-based social network data. Besides the descriptive analysis of the network, we use exponential random graph (ERG) models to estimate when and how email networks and networks based on traditional sociometric methods coincide or diverge.
Quintane and Kleinbaum (2011) compare email data with survey reports on social networks, and find that the email network corresponds to the communication network as recalled by the participants. Although their research question is similar to ours, this paper extends their results in two important aspects. First, the survey-based ego-network they analyze is a communication network, while we collected network data on a wider range of relations: based on a more extensive set of survey questions (which we shall describe later), we are able to differentiate three main types of connections between employees: friendship, communication, and advice. We believe it is important to have a multidimensional measure of social networks because the extent to which emails correspond to “off-line” ties might depend largely on what kind of ties we are interested in. Second, we would like to test their results on a larger dataset. Quintane and Kleinbaum’s analysis of surveys is a small sample (n=23), which might be one reason why many of their ERGM coefficients are insignificant. Our dataset contains a significantly larger number of observations.
The structure of the paper is as follows. First, we describe the empirical setting and the network data in detail, with emphasis on how we collected and transformed the variables and with a detailed discussion on the issue of missing observations. Second, we provide descriptive statistics on the networks and compare the networks using network correlations. Third, we estimate exponential random graph models on the networks, and compare what mechanisms drive the email, friendship, advice, and communication networks. Finally, we discuss the findings and their implications for research in social networks, and communications.
2.2 Data
We collected our data from a Central European bank. The dataset contains attribute information about the employees, email messages among the employees, and a sociometric survey. The company provided us attribute information about all employees who worked at the headquarters of the firm at the time of data collection (N=1,311), such as gender, job function, tenure, age and hierarchical level. The company also provided us the email activity of these employees for a three-week period. We conducted a sociometric survey, which was completed by 761 employees (overall response rate:
57%).
For purposes of this analysis, we select a subsample of the data. In order to minimize the possible biases from missing data (Holland and Leinhardt, 1973; Kossinets, 2006), we selected the three organizational departments with the highest response rates on the sociometric survey1.
There is no missing data on the attributes of the employees and on the emails. The average response rate in these three departments is 67% (out of 168 employees in the three departments, 113 completed the survey). Table 2.1 contains the descriptive statistics of the sample, and compares the set of respondents with all the employees of these three departments. As the table shows, the characteristics of the respondents closely match the characteristics of the non-respondents (this and following results are based on chi-squared tests of proportion under multinomial sampling assumptions). We also check whether the three chosen departments are typical departments of the bank in terms of age, gender, tenure, and hierarchical composition. Table 2.1 illustrates that the three chosen departments do not differ significantly along most attributes of the employees from the population of all departments. The only exception is gender distribution: males are overrepresented in one of the three highest response-rate departments (the department with the second highest response rate happens to be the IT department, and males are traditionally overrepresented in IT departments). There is no gender bias in response rate within the departments, however. Therefore, although the response rate is the selected sample is only 67%, due to the fact that the sample matches the population on the main attributes, we have no reason to believe that non-response biases our model estimates2.
The mean age of employees in our sample is 32 years; the mean tenure is 3.7 years; 34 em-ployees were hired within one year; the longest tenure is 15 years. The emem-ployees in the analyzed departments are all located in the same building (which is important in the light of Marmaros and
1When deciding how many of the highest response rate departments to include into the analysis, we had to
balance two opposing criteria: on one hand, by including more departments in the sample we would increase the number of observations; on the other hand, including more departments decreases the overall response rate, which we wanted to avoid. Eventually, we decided to include the three departments with the highest response rates because this sample provides a relatively large number of observations and at the same time keeps the response rate relatively high.
2We also investigated whether ERG estimates are biased, but our analyses (not shown here) do not indicate the
Ta bl e 2. 1: D em og ra ph ic co m po si ti on of th e th re e de pa rt m en ts in cl ud ed in th e an al ys is , an d th ei r co m pa ri so n wi th th e wh ol e or gan izat ion . E m pl oy ee s wh o co m pl et ed A ll em pl oy ee s in A ll em pl oy ee s th e so ciome tric su rv ey th e se le cte d de partme nts in th e comp an y Co un t P er ce nt C ou nt P er ce nt Co un t Pe rc en t Ge nd er: M ale 85 75% 120 71% 599 49% Fe m al e 28 25% 48 29% 612 51% Hie rarc hy le ve l: He ad of de partme nt 44 %42 % 36 3% Sup er vi so r 18 16% 22 13% 120 10% Empl oy ee 91 81% 143 85% 1054 87% De partme nts : De partme nt 1 35 31% 49 29% 35 di fferen t depa rt men ts, De partme nt 2 37 33% 59 35% wi th 36 empl oy ees De partme nt 3 41 36% 60 36% on av erage Age : 18-24 33 %53 % 146 12% 25-29 43 38% 58 35% 436 36% 30-34 39 35% 55 33% 298 25% 35-39 14 12% 23 14% 168 14% 40+ 14 12% 27 16% 162 13% Te nu re : W it hi n 1 ye ar 38 34% 52 31% 421 35% 2-4 years 37 33% 56 33% 405 33% Mo re tha n 4 yea rs 38 34% 60 36% 384 32% To ta l 113 168 1,211
Sacerdote (2006) and Kleinbaum et al. (2008) who both find that geographical distance plays a crucial role in emailing behavior).
Sociometric data. We conducted the sociometric survey in July 2007. To map the egocentric networks of employees, we sent all the employees an email inquiring as to whether they would be interested in participating in our study. Included in the email was a direct link to the on-line survey. Respondents were presented with a list of all the members of the company, and were asked to select the names of their contacts. Respondents could select among the names in two ways: either by choosing directly from all the names using a drop-down list or by first selecting the department of the employee and then selecting the name from a list which contains only the employees of the selected department.
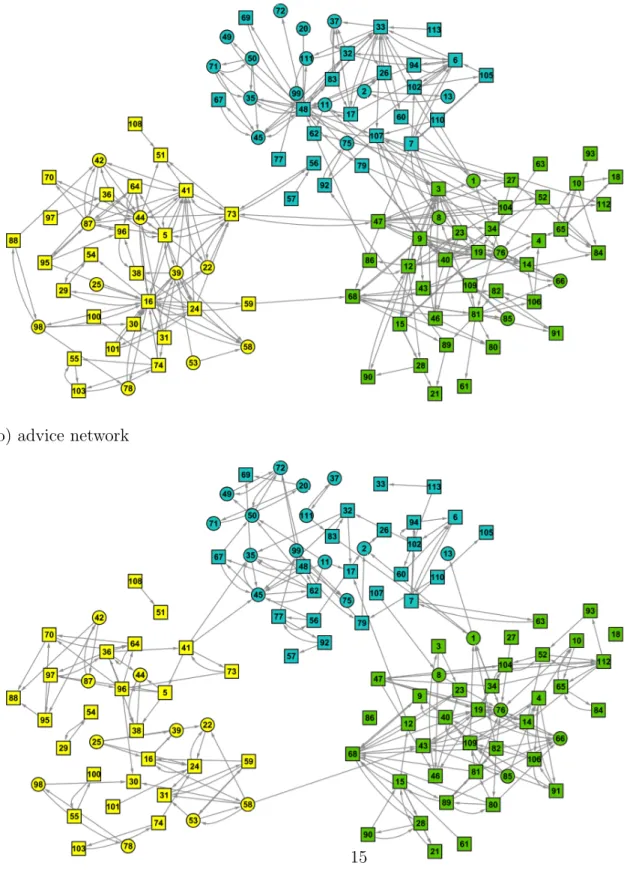
In the survey, we used traditional egocentric questions to map the friendship, advice, and information flow networks. This technique has a long history in network studies, communication research, and organizational studies (Moreno, 1933; Sampson, 1988; Podolny and Baron, 1997; Morrison, 2002; Goodreau, 2007). For each of the friendship, advice, and information flow networks we asked two questions, and we created a tie between ego and alter if ego named alter in any of the questions along the respective dimension. For example, if ego listed alter in either Question 3 (“Which of your colleagues do you believe have the most professional knowledge or expertise?”) or Question 4 (“Which of your colleagues do you turn to for professional advice?”), then the advice seeking network is set to have a tie between ego and alter. See Table 2.2 for the survey questions (the survey contained other questions as well, but these questions are not directly relevant to our research question so we do not analyze them here). Note that these networks are directed. Figure 2.1 illustrates the friendship, advice seeking and information flow networks. One might
Figure 2.1: Visualization of the all email, friendship, advice seeking, and information flow networks. For easier comparison, we forced the same layout on the networks. Different colors represent the different organizational departments; squares denote male employees and circles denote female employees.
a) friendship network
c) information flow network
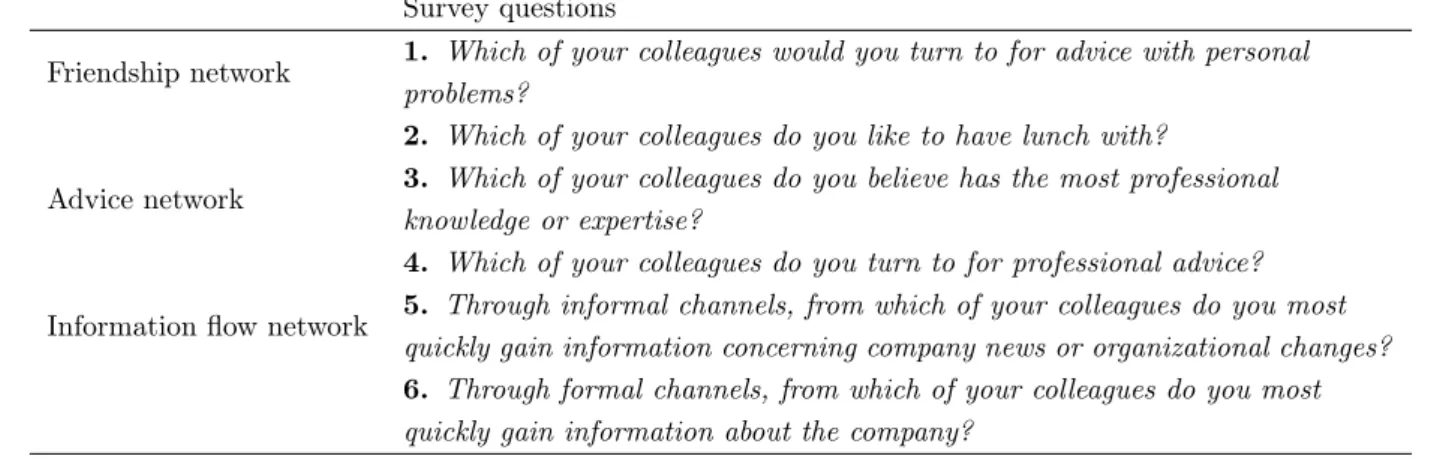
Table 2.2: Survey questions
Survey questions
Friendship network 1. Which of your colleagues would you turn to for advice with personal problems?
2. Which of your colleagues do you like to have lunch with?
Advice network 3. Which of your colleagues do you believe has the most professional knowledge or expertise?
4. Which of your colleagues do you turn to for professional advice? Information flow network 5. Through informal channels, from which of your colleagues do you most
quickly gain information concerning company news or organizational changes? 6. Through formal channels, from which of your colleagues do you most quickly gain information about the company?
argue that the research design, which, as described above, is a fixed-choice design, might introduce selection bias into our analyses as it censors the data (Holland and Leinhardt, 1973; Kossinets, 2006). While we agree that the research design is not optimal, we believe that in this case censoring does not alter the results significantly: For each sociometric question the employees could have listed up to four names, but they rarely listed the maximum four. In 42% of the answers only one alter was listed, in 37% of the answers two alters were listed, in 17% three alters, and only in 4% of the answers were all the four possible slots used. As only in these latter cases might censoring matter, we argue that censoring does not pose a serious problem.
Email data. The subsample we analyze includes the complete record of email activity among the 113 employees during an observation period of roughly three weeks. To protect the privacy of employees, the bank omitted the subject and the content of the messages, providing us only with information about the senders and recipients, the length of the email, the time and the date the message was sent. The names of employees were replaced with identifiers. Our sample contains 6,551 emails among the 113 employees.
Operationalizing the email networks. How should one build a network from data on email communications? The answer to this question is less than obvious. In short, one needs to opera-tionalize what a tie is: should we consider two people A and B connected if there exists an email from A to B, or should we require say at least five emails? Should we include emails with multiple
recipients (just think about whether a mass-email with 50 recipients represent a tie)? Should we consider a tie to exist between two persons if person A has cc-d person B in a single email but there is no other email from A to B? Because the literature provides no clear guidance on these issues, we investigate multiple operationalizations. Exploring multiple operationalizations on one hand ensures the robustness of our analyses, and on the other hand provides a reference for further researchers who aim at extracting networks from email communications.
To tackle the issue of operationalization of emails, we take an approach that mixes conceptual insights and sensitivity analyses. The first operationalization, which we call all-email network, defines a tie between ego and alter if there had been any email communications from alter to ego. This operationalization, we think, is a natural choice. In the second operationalization, we aimed to exclude ties between employees who only have mass-email communication to each other – the reason for this was the intuition that if only mass-emails exist between two employees then they are probably not connected. To identify mass-emails, Quintane and Kleinbaum (2011) selected emails with four or more recipients. As we find their cut-off at four recipients arbitrary, we have conducted sensitivity analyses: we explored how the networks change if we vary the cut-offs (for brevity, results are not shown here). These sensitivity analyses show that the natural cut-off is not at four recipients but at two: whether there exists an individual email between ego and alter (in which alter is the only recipient). Thus, we analyze the network of individual emails. This network, although emerged from sensitivity analyses, can also be defended conceptually, as person-to-person emails are qualitatively different from emails that have more than one recipient.
In the third operationalization, we create an email network in which a tie is defined to exist between alter an ego if ego sent at least four emails to alter. This operationalization emerged from the consideration to create an email-based network that has similar density to the survey-based networks (this is important in view of Anderson et al. (1999), who show how estimates of network parameters interact with the density of the network). After calculating the average degree for networks emerging from different cut-off values, we found that the network with four email cut-off has an average degree of 2.06 which is closest to the average degree of the friendship-, advice-, and information flow networks (see Table 2.3).
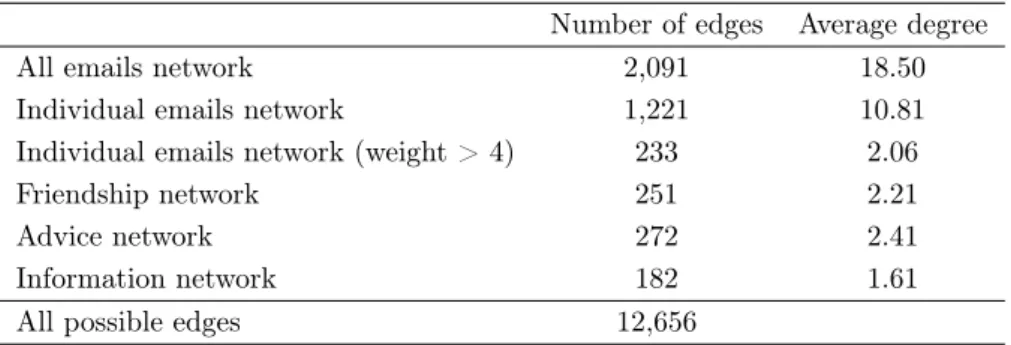
Table 2.3: Density of the networks and network correlations with QAP standard errors
Number of edges Average degree All emails network 2,091 18.50 Individual emails network 1,221 10.81 Individual emails network (weight > 4) 233 2.06 Friendship network 251 2.21 Advice network 272 2.41 Information network 182 1.61 All possible edges 12,656
Network Correlations 2 3 4 5 6 1 All emails network 0.735 0.308 0.272 0.248 0.230 2 Individual emails network 0.419 0.261 0.249 0.253 3 Individual emails network (weight > 4) 0.280 0.280 0.309 4 Friendship network 0.354 0.345
5 Advice network 0.348
6 Information flow network
All correlations are significant at the 0.01 level (standard errors calculated with QAP).
2.3 Analyses: Comparison of survey-base and email-based
social networks
2.3.1 Network correlations and descriptive statistics of the networks
Before turning to the analysis of the networks with exponential random graph models, we provide some descriptive statistics about the macro structure of the networks and the overall correspon-dence between the networks. First, we compare the networks using network correlations with standard errors calculated with Krackardt (1987)’s Quadratic Assignment Procedure (QAP). The network correlation coefficients, all of which are significant at the 0.01 level, are shown in Table 2.3. The networks correlate positively, although the strengths of the correlations are moderate: The survey-based networks have a correlation of around 0.35 with each other, and a 0.25 correlation with the email-based networks.
2.3.2 Comparison of the networks along centrality measures
After analyzing the networks with network correlations, in this section we compare the networks along structural properties such as degree centrality, betweenness centrality and closeness centrality (Wasserman and Faust, 1994; Grippa et al., 2006). Here we investigate whether centrality in email-based networks correspond to centrality and brokerage in the friendship, advice seeking, and information flow networks.
We calculate actors’ degree centrality (the number of connections the individual has) for each network, as well as closeness and betweenness centrality (Wasserman and Faust, 1994). Similarly to Kossinets and Watts (2006), we calculate Spearman‘s rank order correlation to compare the structural position of actors in the different networks.
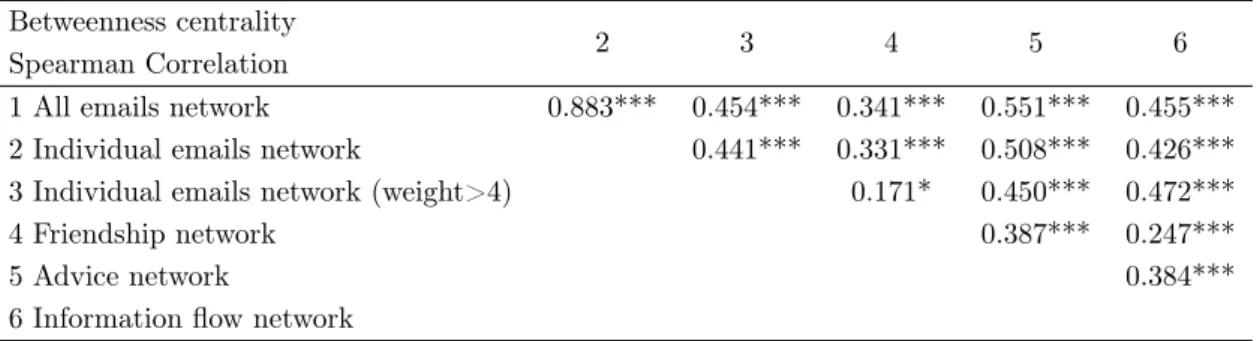
Table 2.4 shows a number of interesting correlations, but here we focus on whether the email-based networks correspond to the friendship, advice seeking, and information flow networks in terms of actors’ centrality positions. Two general patterns are apparent. First, email networks have stronger correlations with the advice seeking and the information flow network in terms of centrality than with friendship networks. Indeed, some of the correlations are rather high (e.g., 0.642), indicating that being central in the email network corresponds to being central in the advice and information flow networks. Second, while centrality in email networks corresponds to centrality in off-line network in terms of betweenness- and degree-centrality, this does not hold for closeness centrality. Unfortunately we do not have any explanation for this finding.
2.3.3 Analyzing the networks with Exponential Random Graphs
The network correlations with QAP standard errors demonstrate that although the email-based and the survey-based networks are related, they differ substantially. Correlation is, however, just a crude measure of correspondence. To get at a more detailed comparison of the various networks, we turn to Exponential Random Graph models (Handcock, 2002; Hunter, 2007; Goodreau, 2007; Pattison and Robins, 2007). We choose this model family because it enables the comparison of the mechanisms and factors that explain the various social network data, and it allows for
Table 2.4: Spearman Correlations among Centrality Measures of the Employees
Betweenness centrality
2 3 4 5 6
Spearman Correlation
1 All emails network 0.883*** 0.454*** 0.341*** 0.551*** 0.455*** 2 Individual emails network 0.441*** 0.331*** 0.508*** 0.426*** 3 Individual emails network (weight>4) 0.171* 0.450*** 0.472*** 4 Friendship network 0.387*** 0.247***
5 Advice network 0.384***
6 Information flow network
***.Correlation is significant at the 0.01 level (2-tailed). **.Correlation is significant at the 0.05 level (2-tailed). *.Correlation is significant at the 0.1 level (2-tailed). (N=113; max.num.edge=12,656)
Closeness centrality
2 3 4 5 6
Spearman Correlation
1 All emails network 0.278*** 0.132 -0.034 0.296*** 0.126 2 Individual emails network 0.097 -0.068 0.308*** 0.046 3 Individual emails network (weight>4) -0.012 0.369*** 0.378*** 4 Friendship network -0.107 0.335***
5 Advice network 0.324***
6 Information flow network
***.Correlation is significant at the 0.01 level (2-tailed). **.Correlation is significant at the 0.05 level (2-tailed). *.Correlation is significant at the 0.1 level (2-tailed). (N=113; max.num.edge=12,656)
Degree centrality
2 3 4 5 6
Spearman Correlation
1 All emails network 0.888*** 0.595*** 0.400*** 0.518*** 0.642*** 2 Individual emails network 0.583*** 0.346*** 0.448*** 0.597*** 3 Individual emails network (weight>4) 0.345*** 0.393*** 0.574*** 4 Friendship network 0.450*** 0.534***
5 Advice network 0.572***
6 Information flow network
***.Correlation is significant at the 0.01 level (2-tailed). **.Correlation is significant at the 0.05 level (2-tailed). *.Correlation is significant at the 0.1 level (2-tailed). (N=113; max.num.edge=12,656)
simultaneously investigating the effects of node attributes, dyad attributes, and local network configurations (Handcock, 2002; Hunter, 2007; Goodreau, 2007; Pattison and Robins, 2007). Our research strategy entails modeling each network individually, and comparing the modeling results across the networks.
Exponential random graph models have the following form: P r (X = x) = exp (PA AzA(x)) /,
where A is a subset of tie variables, defining a potential network configuration, A is a model
parameter corresponding to the configuration A (and is non-zero only if all pairs of variables in A are assumed to be conditionally dependent); zA(x) is the sufficient statistic corresponding to the
parameter A and indicates the number of configurations A occurring in the network x; and is
a normalizing quantity (Pattison and Robins, 2007).
In the models we present, we incorporate both endogenous local network structure variables and attribute variables. The local network structure variables include: density, reciprocity, indegree and outdegree distribution3, and transitivity. As for attributes, we incorporate hierarchy, gender,
tenure, age, and information on whether the two employees in the dyad are in the same department. As the network is directed, we include a dummy of whether the sender is at higher hierarchy level than the receiver, or they are at the same hierarchy level (therefore, the baseline is when the receiver is at higher hierarchy level). Similarly, we add dummies for the dyadic gender effect, where the baseline is the female-female dyad. As both tenure and age are continuous variables, we included the absolute difference along tenure and age into the model (tenure and age are coded in decades).
Before discussing the specific models, we note that we have calculated a wide range of models with alternative specifications, but here for brevity we only show and discuss a few of them. We selected those models that are parsimonious but also have good fit: the models simulated based on the estimates fit the empirical networks well in terms of indegree-, outdegree, edge-wise shared
3Note that to model some of the networks, we needed to include two geometrically-weighted indegree and
outdegree terms with different parameters. This is standard practice in modeling networks with bimodal degree distributions. Note that this explains the seemingly high coefficients of gwidegree, gwodegree, and edges in these models.
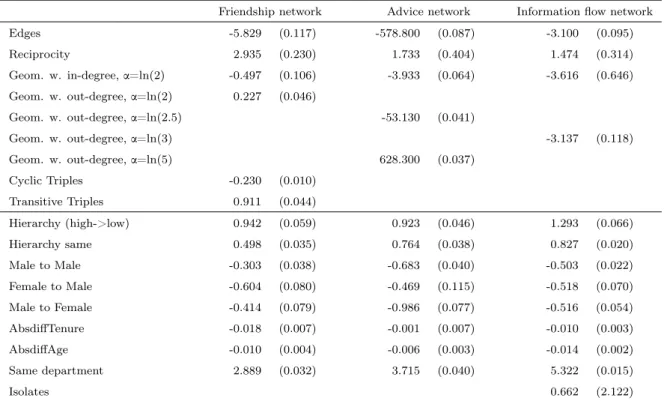
Table 2.5: Result of the ERG models for the survey-based networks
Friendship network Advice network Information flow network Edges -5.829 (0.117) -578.800 (0.087) -3.100 (0.095) Reciprocity 2.935 (0.230) 1.733 (0.404) 1.474 (0.314) Geom. w. in-degree, a=ln(2) -0.497 (0.106) -3.933 (0.064) -3.616 (0.646) Geom. w. out-degree, a=ln(2) 0.227 (0.046)
Geom. w. out-degree, a=ln(2.5) -53.130 (0.041)
Geom. w. out-degree, a=ln(3) -3.137 (0.118) Geom. w. out-degree, a=ln(5) 628.300 (0.037)
Cyclic Triples -0.230 (0.010) Transitive Triples 0.911 (0.044) Hierarchy (high->low) 0.942 (0.059) 0.923 (0.046) 1.293 (0.066) Hierarchy same 0.498 (0.035) 0.764 (0.038) 0.827 (0.020) Male to Male -0.303 (0.038) -0.683 (0.040) -0.503 (0.022) Female to Male -0.604 (0.080) -0.469 (0.115) -0.518 (0.070) Male to Female -0.414 (0.079) -0.986 (0.077) -0.516 (0.054) AbsdiffTenure -0.018 (0.007) -0.001 (0.007) -0.010 (0.003) AbsdiffAge -0.010 (0.004) -0.006 (0.003) -0.014 (0.002) Same department 2.889 (0.032) 3.715 (0.040) 5.322 (0.015) Isolates 0.662 (2.122)
Parameter values of the erg models; (N=113; max.num.edges=12,656) Standard errors are in parentheses.
partner, and triad-census distributions (Hunter et al., 2008). It is important to stress that our main findings hold across alternative model specifications.
2.3.4 Results of the exponential random graph models
Before discussing the individual parameter estimates, we have to note that in accordance with the network correlation results in the previous section, there is an overall positive correspondence between the email and survey-based networks in the sense that the signs of the coefficients are mostly the same. Besides an overall similarity, however, there are important differences as well.
Tables 2.5 and 2.6 show the model estimates4. First, we discuss the results for reciprocity.
While reciprocity is present in all the networks, its strength varies. Reciprocity is very important in the email and the friendship networks. For example, if ego sent an email to alter, then the probability that alter sends an email to ego increases 24 times (exp(3.158)). Similarly, if an ego
Table 2.6: Result of the ERG models for three different operationalizations of the email data
Network of all emails Network of individual emails Network of individual emails (weight>=4) Edges 13.410 (0.125) 191.700 (0.236) -3.942 (0.124) Reciprocity 2.825 (0.327) 3.158 (0.233) 4.414 (0.306) Geom. w. in-degree, a=ln(2) 0.175 (0.537) -2.241 (0.044) Geom. w. in-degree, a=ln(3) 1.004 (0.280)
Geom. w. in-degree, a=ln(5) -8.737 (0.002)
Geom. w. in-degree, a=ln(7) -115.400 (0.003)
Geom. w. out-degree, a=ln(2) -1.351 (0.102) -2.018 (0.046) Geom. w. out-degree, a=ln(3) -1.298 (0.004)
Geom. w. out-degree, a=ln(5) -10.930 (0.003)
Geom. w. out-degree, a=ln(7) -83.120 (0.003)
Hierarchy (high->low) 0.817 (0.007) 0.401 (0.014) 0.986 (0.048) Hierarchy same 0.546 (0.002) 0.396 (0.005) 0.416 (0.035) Male to Male 0.039 (0.003) 0.111 (0.006) -0.295 (0.038) Female to Male -0.102 (0.007) -0.062 (0.014) -0.008 (0.064) Male to Female 0.200 (0.006) 0.222 (0.013) -0.094 (0.060) AbsdiffTenure -0.023 (0.001) -0.018 (0.001) 0.039 (0.004) AbsdiffAge -0.005 (0.000) -0.002 (0.001) -0.040 (0.003) Same department 2.040 (0.004) 2.354 (0.003) 2.788 (0.021) Isolates -0.870 (0.099)
nominates alter as friend, then the chance that alter nominates ego as friend is 19 times higher (exp(2.935)). Weaker is the effect of reciprocity in the information flow network and in the advice network (which is not surprising, as advice ties are often asymmetric).
Now we turn to analyze the role of organizational boundaries in shaping the interpersonal net-works. It is apparent that being in the same organizational department dramatically increases the probability that two employees will interact by email or nominate each other in the friendship, advice seeking, or information flow networks (this is also apparent from Figure 2.1). The strongest is the effect for the information flow network, in which being in the same department increases the chance of a tie between two employees by almost two hundred times (exp(5.322)). More moderate but still strong is the effect of being in the same department for the advice seeking and friendship networks (the estimated coefficients are 3.72 and 2.89). Much weaker (but still significant) is the effect of departmental boundaries on emailing behavior. This finding indicates that studies that purely rely on email networks to investigate the effects of organizational boundaries on interper-sonal networks and communications, such as Kleinbaum et al. (2008), underestimate the role of boundaries.
Organizational hierarchy also shapes off-line social networks stronger than it shapes email networks. While both emails and friendship, advice seeking and information flow nominations tend to be directed toward the same and lower levels of hierarchy (as viewed from ego’s location), the effect size of hierarchy variables is higher for off-line networks (except in the case of email ties in which ego sent at least four individual emails to alter, but as this network signals stronger ties, this result is not surprising).
Gender plays a different role in the email and off-line social networks. While in the offline networks the female-female ties are the most likely, followed by male-male ties, the overall effect of gender on email networks is rather weak and inconsistent across operationalizations.
In summary, we have found that on one hand reciprocity plays a stronger role in email net-works than off-line social network; on the other hand, off-line social netnet-works are more influenced by organizational, gender, and hierarchical differences (we provide possible explanation for these findings later).
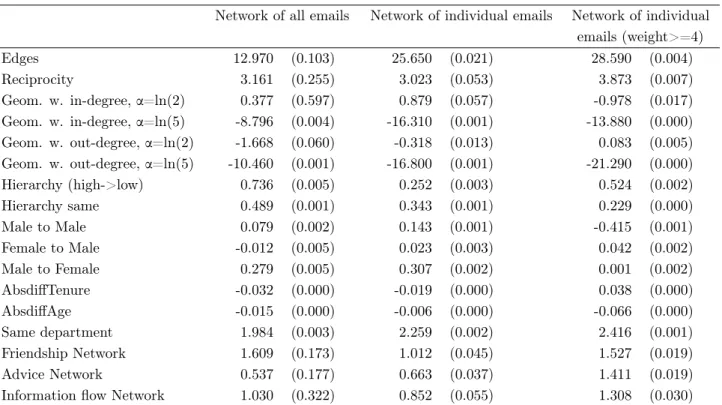
Table 2.7: Result of the ERG models for the email networks, with the friendship, advice, and information flow networks as covariates
Network of all emails Network of individual emails Network of individual emails (weight>=4) Edges 12.970 (0.103) 25.650 (0.021) 28.590 (0.004) Reciprocity 3.161 (0.255) 3.023 (0.053) 3.873 (0.007) Geom. w. in-degree, a=ln(2) 0.377 (0.597) 0.879 (0.057) -0.978 (0.017) Geom. w. in-degree, a=ln(5) -8.796 (0.004) -16.310 (0.001) -13.880 (0.000) Geom. w. out-degree, a=ln(2) -1.668 (0.060) -0.318 (0.013) 0.083 (0.005) Geom. w. out-degree, a=ln(5) -10.460 (0.001) -16.800 (0.001) -21.290 (0.000) Hierarchy (high->low) 0.736 (0.005) 0.252 (0.003) 0.524 (0.002) Hierarchy same 0.489 (0.001) 0.343 (0.001) 0.229 (0.000) Male to Male 0.079 (0.002) 0.143 (0.001) -0.415 (0.001) Female to Male -0.012 (0.005) 0.023 (0.003) 0.042 (0.002) Male to Female 0.279 (0.005) 0.307 (0.002) 0.001 (0.002) AbsdiffTenure -0.032 (0.000) -0.019 (0.000) 0.038 (0.000) AbsdiffAge -0.015 (0.000) -0.006 (0.000) -0.066 (0.000) Same department 1.984 (0.003) 2.259 (0.002) 2.416 (0.001) Friendship Network 1.609 (0.173) 1.012 (0.045) 1.527 (0.019) Advice Network 0.537 (0.177) 0.663 (0.037) 1.411 (0.019) Information flow Network 1.030 (0.322) 0.852 (0.055) 1.308 (0.030) Parameter values of the erg models (N=113; max.num.edges=12,656) Standard errors are in parentheses.
2.3.5 Can emailing behavior be explained with off-line social networks?
Why do people write emails? Although carefully answering this question would require the analysis of the content of the emails (which we do not have), the data at hand allows us to take a few steps toward understanding how off-line relations explain who writes email to whom. To keep consistency with our previous modeling approaches, we take the simplest approach to investigating how off-line networks explain emailing behavior: we include friendship, advice, and information flow ties as explanatory variables into the ERG models of Table 2.6. We expect these variables to have positive coefficients: an employee is more likely to write email to a friend, more likely to write email to whom she turns for advice, etc. We are interested in two things: first, which of these off-line relationships is the most important in explaining emailing behavior; and second, to what extent does including off-line relationships into the models help explaining emailing behavior.
Table 2.7 shows the ERG estimates for all previous email network operationalizations. First, as expected, the existence of a friendship, advice, or information flow relationship between ego
and alter increases the probability that ego will write an email to alter. This finding is consistent across all three email-network operationalizations. Also consistent across operationalizations is that friendship relations are the most important in explaining the existence of emails from ego to alter. Second most important in two out of the three networks is the information flow relationship, except in the network of four or more individual emails, in which case advice is the second most important (this finding is not surprising as this is the network that mirrors the most frequent emails). These findings, we believe, are novel to the email and communication literatures.
Second, the results in Table 2.7 show that off-line relationships have strong explanatory power. On one hand, existence of a friendship tie increases the chance of an email, ceteris paribus, by 5 times (exp (1.609)). This magnitude makes it the most important determinant, together with reciprocity and being in the same department. Also, by incorporating friendship, advice, and infor-mation flow relationships as covariates, the fit of the models improves significantly. Note, however, that the strong structural effects remain, which indicating that there are social mechanisms at work on top of (the main effect of) friendship, advice, and information networks.
In summary, we can say that consistent with the previous results in the paper, the results of Table 2.7 demonstrate that while emailing behavior is strongly influenced by line relations, off-line relations do not explain emailing behavior perfectly. (This latter statement should be taken with caution, as we do not claim that there exists no model that explains emails. For example, we could include interactions between the variables etc. These we leave for future research.) What these analyses add, however, is that they demonstrate that friendship is the factor that most strongly drives the overall patterns of emailing, as opposed to advice seeking, or information flow (even though these factors are present as well).
2.3.6 Possible explanations for the findings
What might be the explanations for our empirical findings, namely that while there is a general correspondence between the email networks and off-line social networks, this correspondence is not perfect, and social, hierarchical, and gender boundaries are less important in email networks?
In general, there could be two answers. The first possible explanation for the divergence between survey-based and email-based social networks concerns a measurement issue: surveys are self-reported, while emails are observational. There is extensive literature in the fields of social networks and communications regarding the differences between self-reported and observed ties (Killworth and Bernard, 1976; Bernard et al., 1982; Brewer, 2000; Marin, 2004; Marsden, 2005). This literature mostly focuses on “recall-bias,” i.e., that people cannot perfectly recall their ties to others. A general finding in the recall literature is that people are better in recalling stable and frequent relations (Freeman et al., 1987). Also, Brewer (2000) finds that people are better in recalling alters who are more centrally located in the network. This literature, however, tends to agree that there exists no good general predictors of whom ego will forget to recall, in terms of gender, status, or age differences (for example, Bernard et al. (1982) did not find any strong effect of these variables on whom people recall as a communication partner). These findings, thus, do not help in understanding the systematic differences we found between the email and the survey-based networks.
A second possible explanation for our findings is that online and offline relations are just simply different. As Susan Herring writes, “the Internet is said to be inherently democratic, leveling traditional distinctions of social status” (Herring, 2003, page 202.) While this is a slightly utopian statement, scholars have reported that perceived hierarchies, organizational boundaries, gender and age differences are less important in online settings (Wellman and Hampton, 1999). Interestingly, while there exists a sizable literature in the field of communication on how people use email, relatively few studies analyze empirically the effect of gender or status differences in emailing behavior (but see Boneva et al., 2001; Herring, 2003). These studies, using very different research approaches from ours (Boneva et al. (2001) uses survey data on internet usage), find similar results: females write more emails than males (Herring, 2003). Although these scholars observe a general tendency of online behavior to decrease the importance of off-line differences in gender, power, or age, a general agreement in the field is that these differences albeit decrease but do not go away.
survey networks and the email networks in our paper differ in both the recall/observational and the on/off-line dimensions. It would be an interesting way for future research to compare networks that differ in only one of these dimensions. An important step toward that direction is Matzat and Snijders (2010), who experimentally compare off- and on-line collected recall data.
2.4 Discussion
In this paper, we analyzed the structure of an email network and the underlying friendship, com-munication, and advice seeking networks. Our sample contains detailed email communications of 113 employees of three departments of a bank, and of a survey of the ego networks of these employees. Our goal was to understand the extent to which email patterns coincide with socio-metric measures of the friendship, advice seeking, and communication networks. To study these questions, we used exponential random graph models along with structural analyses.
In general, our results demonstrate that although the structure of the email networks in our dataset is related to the structure of survey-based networks, emails networks and survey-based social networks do not perfectly correspond to each other. On one hand, email-based and survey-based social networks do coincide in many aspects. For example, email networks are relatively good in predicting the betweenness and degree centrality of employees, especially in the advice seeking and communication networks.
In many other aspects, however, email-based and survey-based social networks diverge. For example, if one is interested in the role organizational boundaries play in forming social networks, the two data types paint markedly different pictures. In the email-based networks, organizational boundaries play a weaker role (Namata et al., 2006) and email communication often moves across boundaries. The sociometric data, however, indicate that these boundaries do play a role, a role that is much stronger than pictured by email networks. This result questions the validity of Kleinbaum et al. (2008)’s finding that gender and hierarchical boundaries are not as strong as geographical boundaries - while these results may be valid, our results indicate that emails underestimate the role of organizational boundaries. Also, email networks do not capture the role
organizational hierarchies and gender play in interpersonal networks.
Finally, we have to note that this paper is an explorative case-study of a single organization. Although we do not see any reason why this setting would be atypical, we believe that more work needs to be done to proper understand the relationship between email networks and off-line social networks. First, for the sake of generalizability, other organizations and empirical settings should be studied. Second, although in order to minimize the amount of missing data we chose the three departments with the highest response rates, we still have 33% of missing observations, which might bias our findings (but see our arguments about why we think that non-response bias is not strong in our sample). Third, future research is needed to analyze the content of emails: this would enable researchers to differentiate between friendship, advice seeking, or communication emails.
References
Anderson, B. S., Butts, C., and Carley, K. (1999). The interaction of size and density with graph-level indices. Social Networks, 21(3):239–267.
Bernard, H. R., Killworth, P. D., and Sailer, L. (1982). Informant accuracy in social-network data v. an experimental attempt to predict actual communication from recall data. Social Science Research, 11(1):30–66.
Boneva, B., Kraut, R., and Frohlich, D. (2001). Using e-mail for personal relationships the differ-ence gender makes. American behavioral scientist, 45(3):530–549.
Brewer, D. D. (2000). Forgetting in the recall-based elicitation of personal and social networks. Social networks, 22(1):29–43.
Eagle, N., Macy, M., and Claxton, R. (2010). Network diversity and economic development. Science, 328(5981):1029–1031.
Freeman, L. C., Romney, A. K., and Freeman, S. C. (1987). Cognitive structure and informant accuracy. American anthropologist, 89(2):310–325.
Goodreau, S. M. (2007). Advances in exponential random graph (p*) models applied to a large social network. Social Networks, 29(2):231–248.
Grippa, F., Zilli, A., Laubacher, R., and Gloor, P. A. (2006). E-mail may not reflect the so-cial network. In Proceedings of the North American Association for Computational Soso-cial and Organizational Science Conference, pages 1–6.
Handcock, M., Hunter, D., Butts, C., Goodreau, S., and Morris, M. (2011). Statnet: software tools for the statistical modeling of network data. 2003. URL http://statnetproject. org.
Handcock, M. S. (2002). Statistical models for social networks: Inference and degeneracy. na. Herring, S. C. (2003). Gender and power in online communication. The handbook of language and
gender, pages 202–228.
Holland, P. W. and Leinhardt, S. (1973). The structural implications of measurement error in sociometryâĂă. Journal of Mathematical Sociology, 3(1):85–111.
Hunter, D. R. (2007). Curved exponential family models for social networks. Social networks, 29(2):216–230.
Hunter, D. R., Goodreau, S. M., and Handcock, M. S. (2008). Goodness of fit of social network models. Journal of the American Statistical Association, 103(481).
Killworth, P. and Bernard, H. (1976). Informant accuracy in social network data. Human Orga-nization, 35(3):269–286.
Kleinbaum, A. M., Stuart, T., and Tushman, M. (2008). Communication (and coordination?) in a modern, complex organization. Harvard Business School Boston, MA.
Kossinets, G. (2006). Effects of missing data in social networks. Social networks, 28(3):247–268. Kossinets, G. and Watts, D. J. (2006). Empirical analysis of an evolving social network. Science,