Arguments for and Field Experiments in Democratizing Digital Data Collection – The Case of Flocktracker
By
Daniel Heriberto Palencia Arreola Civil Engineer
Universidad Nacional Autónoma de México Mexico City, Mexico (2012)
Submitted to the Department of Urban Studies and Planning in partial fulfillment of the requirements for the degree of
Master in City Planning at the
MASSACHUSETTS INSTITUTE OF TECHNOLOGY February 2019
© 2019 Massachusetts Institute of Technology. All rights reserved.
Author _________________________________________________________________ Department of Urban Studies and Planning
February 8, 2019 Certified by _____________________________________________________________
Associate Professor P. Christopher Zegras Department of Urban Studies and Planning Thesis Supervisor Accepted by _____________________________________________________________ Associate Professor P. Christopher Zegras Chair, MCP Committee Department of Urban Studies and Planning
3 of 140
Arguments for and Field Experiments in Democratizing Digital Data Collection – The Case of Flocktracker
By
Daniel Heriberto Palencia Arreola
Submitted to the Department of Urban Studies and Planning in partial fulfillment of the requirements for the degree of
Master in City Planning
Abstract
Data is becoming increasingly relevant to urban planning, serving as a key input for many conceptions of a “smart city.” However, most urban data generation results from top-down processes, driven by government agencies or large companies. This provides limited opportunities for citizens to participate in the ideation and creation of the data used to ultimately gain insights into, and make decisions about, their communities. Digital community data collection can give more inputs to city planners and decision makers while also empowering communities. This thesis derives arguments from the literature about why it would be helpful to have more participation from citizens in data generation and examines digital community mapping as a potential niche for the democratization of digital data collection.
In this thesis, I examine one specific digital data collection technology, Flocktracker, a smartphone-based tool developed to allow users with no technical background to setup and generate their own data collection projects. I define a model of how digital community data collection could be “democratized” with the use of Flocktracker. The model envisions a process in which “seed” projects lead to a spreading of Flocktracker’s use across the sociotechnical landscape, eventually producing self-sustaining networks of data collectors in a community. To test the model, the experimental part of this research examines four different experiments using Flocktracker: one in Tlalnepantla, Mexico and three in Surakarta, Indonesia. These experiments are treated as “seed” projects in the democratization model and were setup in partnership with local NGOs. The experiments were designed to help understand whether citizen participation in digital community mapping events might affect their perceptions about open data and the role of participation in community data collection and whether this participation entices them to create other community datasets on their own, thus starting the democratization process.
The results from the experiments reveal the difficulties in motivating community volunteers to participate in technology-based field data collection. While Flocktracker proved easy enough for the partner organizations to create data collection projects, the technology alone does not guarantee participation. The envisioned
“democratization” model could not be validated. Each of the experiments had relatively low levels of participation in the community events that were organized. This low participation, in turn, led to inconclusive findings regarding the effects of community mapping on participants’ perceptions and on the organizations themselves. Nonetheless, numerous insights emerge, providing lessons for the technology and how it might be better used in the future to improve digital community mapping events.
Thesis Supervisor: P. Christopher Zegras Title: Associate Professor
5 of 140
Acknowledgements
To everyone that keeps teaching me who I want to be and to everyone who reminds me who I do not want to be.
To my advisor, professor Chris Zegras, for all the support given to me. To my reader, professor Sarah Williams, for your insights and support.
To Jason McKnight, Sandra Wellford, Sylvia Hiestand, MIT’s ISO and DUSP, for not letting me slip through the cracks of the system.
To the Flocktracker team: Ali J Al-Sammarraie, Scott Gilman, SriVardhini Suresh and Jenny Wang. Thank you for believing in what we do, for all the sleepless nights, all the empowering discussions and all the personal growth you catalyzed. It has always been a pleasure to work with you.
To Kota Kita and Planeación y Desarrollo, especially Hasanatun Nisa Thamrin, Titis Efrindu Bawono, Ilse Jiménez Molina and Rossio Jiménez Molina. This research would have been impossible without your input and hard work.
To my mother, Luz María del Carmen Arreola Castellanos, my sister, Luz del Carmen Palencia Arreola and my life partner, Zi Xin Wong, for always believing in me.
To Cressica Brazier, Chaewon Ahn, Erina Keefe, Haleemah Qureshi, Ricardo Sánchez, Akemi Sato Matsumoto, Antonio Cano Méndez, Fitse Anley, Adam Hasz and Tia Vice, for all the meals, climbing walls, bike rides, coworking times and the relaxing times too.
To Albert Ching, Kuan Butts, Stephen Kennedy and Arturo Cadena. Every time we talk, I keep thinking about it for months. I am grateful to know you.
To my friends around the world and my cohort at DUSP, for keeping my mind interested, my body active and my heart warm.
To CONACYT and the José Miguel Bejos Fellowship for believing in my work and supporting my studies at MIT.
To the Deshpande Center for Innovation and the Singapore-MIT Alliance for Research and Technology for supporting Flocktracker and my research.
7 of 140
Contents
Abstract ... 3
Acknowledgements ... 5
Index of Figures and Tables ... 11
1 Introduction ... 13
1.1 Research questions ... 16
1.2 Objectives... 16
1.3 Thesis organization ... 17
2 Background ... 19
2.1 Urban data practice ... 20
2.2 Participation in smart cities ... 21
2.3 Community based alternatives to top-down smart city approaches ... 24
2.4 Potential benefits of democratizing digital data collection ... 25
2.5 Strategic niche management for embedding new urban technologies ... 26
2.6 Digital community mapping as a niche for democratizing data collection ... 28
2.7 Flocktracker ... 29
2.8 Summary ... 30
3 A field data collection tool: Flocktracker ... 31
3.1 User experience design drivers and process... 31
3.3 The in-field data collection workflow ... 35
3.3.1 Ideation and technology setup ... 36
3.3.2 Implementation ... 38
3.3.3 Analysis ... 40
3.3.4 Feedback ... 41
3.4 Flocktracker: High-level technical overview ... 42
3.5 Components ... 44
3.6 Data Structures ... 45
3.7 Limitations... 46
3.8 Democratizing data collection – A model within Flocktracker ... 47
3.8.1 Model assumptions ... 47
3.8.2 Democratization stages... 48
4 Research Setting and Methods ... 55
8 of 140 4.2 Empirical Settings ... 56 4.2.1 Locations ... 56 4.2.2 Partner Organizations ... 62 4.3 Experimental Procedures ... 62 4.4 Survey Instruments ... 64
4.5 Instrumentation of the platform ... 65
4.6 Assessing the role of different local partnerships and outreach strategies ... 68
4.7 Effects of researcher participation in the co-design and implementation of experiments ... 69
5 Experiments ... 71
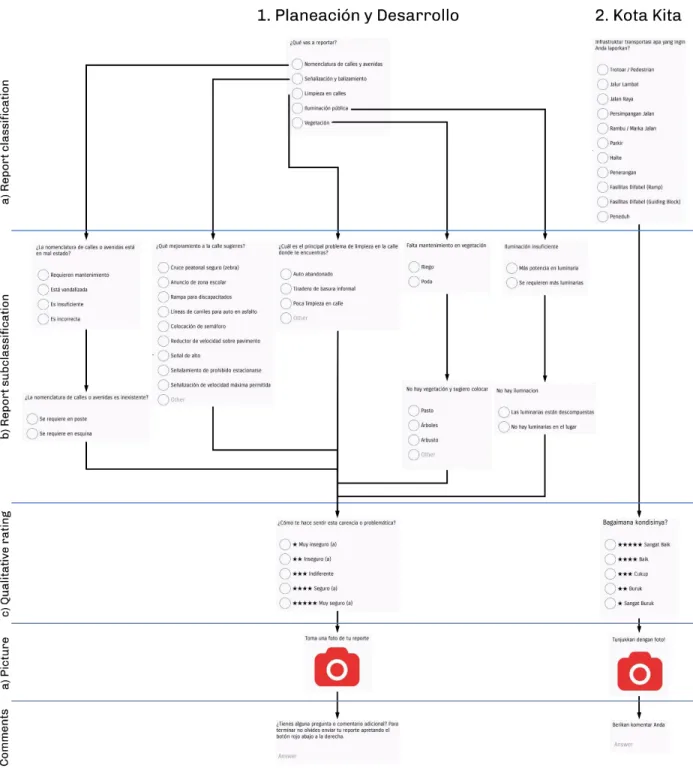
5.1 Community data collection project design and content ... 72
5.2 Description of the experiment cases ... 75
5.2.1 Solo 1 ... 75 5.2.2 Tlalnepantla 1 ... 82 5.2.3 Solo 2 ... 93 5.2.4 Solo 3 ... 97 5.2.5 Summary ... 108 6 Conclusions ... 113
6.1 Value of Flocktracker and its deployment model toto local community organizations and their communities for gathering in-field data ... 113
6.1.1 Impact of a digitally enabled community data collection process on participants’ perceptions ... 115
6.1.2 Digital community mapping as a means for “democratizing” data collection ... 115
6.2 Reflections on the cases and recommendations for future engagements ... 116
6.2.1 The Platform ... 116
6.2.2 The People ... 117
6.2.3 The Project/Campaign ... 118
6.2.4 Potentially beneficial community outreach methods ... 120
6.2.5 Potentially impactful partnerships within the community ... 121
6.3 Moving forward ... 122
6.3.1 Partnerships ... 122
6.3.2 Event ... 123
6.3.3 Outreach ... 124
6.3.4 Incentives ... 124
9 of 140
6.3.6 Post event participation ... 125
6.4 Digital community mapping as a niche to democratize data collection ... 125
Annex 1 – Survey instruments ... 132
Initial survey ... 132
Final survey ... 135
Annex 2 – List of variables for server-side instrumentation for usage tracking ... 137
Server Level ... 137
User Level ... 138
11 of 140
Index of Figures and Tables
Figure 1 – Urban Cybernetics model (Savas, 1970). ... 22
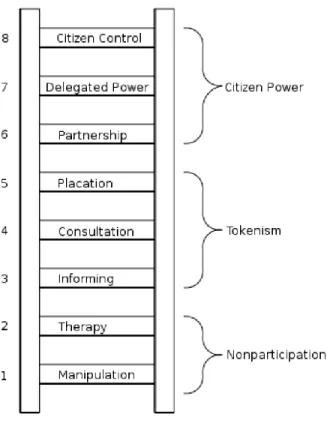
Figure 2 - Eight rungs on the ladder of citizen participation (Arnstein, 1969). ... 24
Figure 3 – Different levels of the sociotechnical landscape Schot (2008) based on (Geels, 2002). ... 27
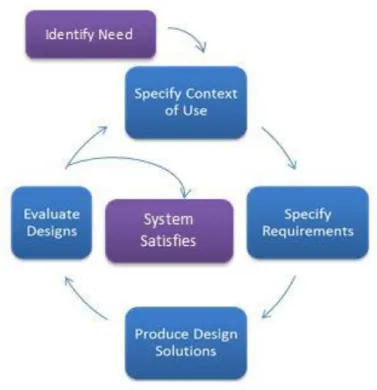
Figure 4 - User Centered design process (U.S. Department of Health & Human Services). ... 34
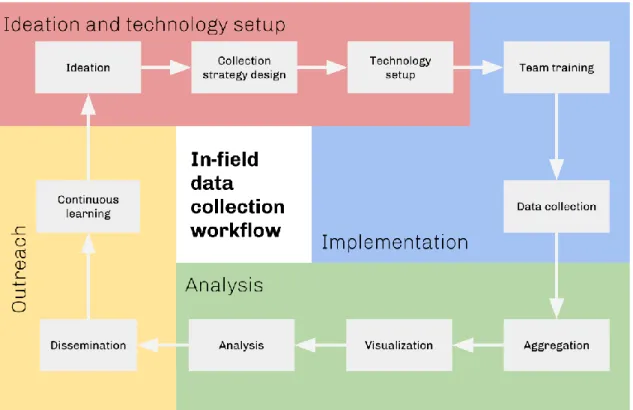
Figure 5 – Stages of an urban data collection project and its steps. ... 35
Figure 6 - Flocktracker components embedded in the data collection workflow. Diagram by Chaewon Ahn based on Arturo Cadena’s initial work. ... 45
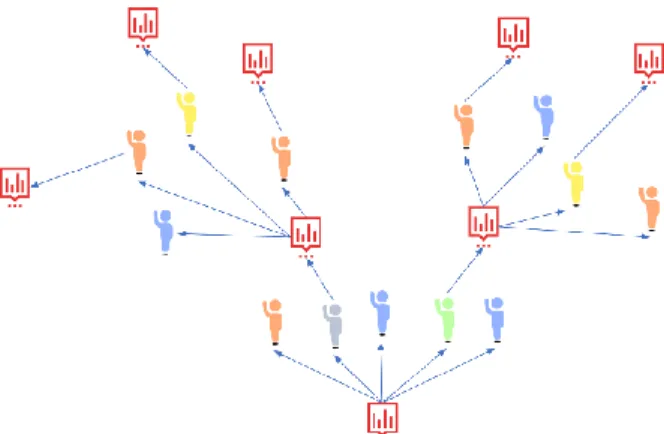
Figure 7 - Seeding stage – A project is created and shared with the community. ... 50
Figure 8 – Primary usage spread stage – People create their own projects... 51
Figure 9 - Secondary usage spread stage – New people join and create their own project. ... 53
Figure 10 - Community establishment stage – A network of active projects is established with the community. ... 53
Figure 11 - Left: Tlalnepantla's informal housing in Sierra de Guadalupe. Right: Rice paddy in Surakarta with a new building development on the background. ... 57
Figure 12 - Maps of Surakarta (left) and Tlalnepantla (right) at the same scale for comparison. ... 59
Figure 13 - Example of the user data collected on the server. ... 66
Figure 14 - Timeline of experiments in Mexico and Indonesia. ... 71
Figure 15 - Flow diagram of the projects developed with Planeación y Desarrollo (1.) and Kota Kita (2.). ... 74
Figure 16 - Community demonstration of bicycle safety in the Women on Wheels event organized by Kota Kita and the Department of Transportation of Surakarta. ... 76
Figure 17 - Participants in the Women on Wheels community event. ... 78
Figure 18 - Titis Efrindu and me presenting on the event. ... 78
Figure 19 - Woman signing up for Flocktracker in her Android smartphone. ... 79
Figure 20 - Angélica Garnica presenting on the Cultura de Paz, Redes Vecinales community event before the Flocktracker event. ... 82
Figure 21 - Poster used for the Tlalnepantla event Designed by Ilse Jiménez Molina, Ali Al-Sammarraie and me. ... 84
Figure 22 - Leaflet to teach participants how to setup the app and the Tlalnepantla project. ... 87
Figure 23 - Students helping older participants to setup the app on their phones. ... 88
Figure 24 - Community meeting in Tlalnepantla. ... 89
Figure 25 - Participant Collecting data in the street using Flocktracker. ... 90
Figure 26 - Screenshot of the data collected in Tlalnepantla showing a color-coded view of the types of data collected. ... 92
Figure 27 - Students in Universitas Muhammadiyah Surakarta installing Flocktracker on their smartphones. ... 95
Figure 28-Online advertisement for the Facebook social media campaign. ... 99
Figure 29 - Mention of the Pedalista project and the Flocktracker app in Solopos, a local newspaper. ... 99
Figure 30 - Titis Efrindu using the leaflet to invite people to the Pedalista project during the Car Free Day event held every Sunday in Surakarta. ... 100
Figure 31 - Leaflet used to spread information about the third Solo project. ... 101
Figure 32 - Screenshot of the Flocktracker app showing the Pedalista project at the end of the contest period ... 102
12 of 140
Figure 33 - Facebook ad campaign charts provided by Facebook with reach, engagements, cost and impressions during the time of the contest. ... 103 Figure 34 – Gender and age distribution of the people reached by the Facebook advertisement
campaign. ... 104 Figure 35 - Pageviews for https://www.flocktracker.org/pedalista/ , in the time of the contest. ... 105 Figure 36 - Daily downloads of the Flocktracker app during the extent of the campaign of the 3rd
experiment case in Solo. ... 106 Table 1 - Comparison of different socioeconomic indicators for Surakarta and Tlalnepantla ... 61 Table 2 - Summary of the experiments ... 111
13 of 140
1 Introduction
Data have always played a role in urban planning. These data can be collected by government authorities (e.g., census, travel surveys), private companies, and/or citizens themselves. These data can be about the population of people and firms, about specific incidents, about environmental conditions, and so forth.
As technological advances further integrate themselves into daily human activities, they give people access to relatively cheap smartphones that come with highly accurate sensors (GPS, microphones, accelerometers, barometers, etc.) and customizable software. This technology gives people increased opportunities to capture “digital traces” of their lives. Concurrent to this increased interest in tracking physical world behavior with digital logs, there has been a movement towards “open data” by governments, at all scales. The proliferation of transparent public data has also spurred (and been spurred by) increasing citizen activism related to “open data.” In this context, digital technologies hold some promise to help “everyday” citizens play a more proactive role in collecting data on topics of interest to them and converting those into meaningful information.
Although enthusiasm towards and discussions about citizen and government activity in this area have become common, implementation of such methods, particularly with regards to new data collection efforts, remains difficult. That is, the promise of digital technology in civic activity (such as a community mapping project) faces often insurmountably high startup friction. For example, minor variations in use cases can necessitate ad-hoc technology development.
14 of 140
Unfortunately, such development requirements can be far too complex or costly for a small community group. Moreover, these efforts often prove to be quite difficult for
government entities as well. Issues from procurement procedures to lack of in-house familiarity with digital solution development often result in costly endeavors with subpar results.
Considering these challenges to implementing a somewhat customized application to assist in survey and mapping efforts, private companies have developed business models around providing tools to assist in enabling users to assemble common survey components and mapping-related features into custom survey interfaces. These companies and products (such as Qualtrics, Survey123 or Fulcrum) are becoming more commonplace for field data collection but are not commonly used in community data collection. Online surveys using tools like Google Forms or Survey Monkey are becoming ubiquitous for several fields where spatial categorization and analysis are not required but hard to setup for in-field data collection
contexts as their design targets online data collection. Furthermore, most systems are designed primarily around the notion of a consistent internet connection and, as such, they do not work well for field contexts where a reliable web connection is not available, like those encountered in rural areas, difficult terrains and often in developing countries.
Considering the current availability of tools directed specifically at civic engagement and urban mapping projects, service gaps in urban related software still exist. Specifically, a tool that enables nontechnical users (e.g. community activists, advocacy groups) to assemble semi-customizable mapping and surveying interfaces in an intuitive and financially affordable manner could have direct benefits to urban planning practice.
15 of 140
This thesis examines some of these prospects, in light of a specific digital field data collection tool called Flocktracker. Flocktracker is a data collection platform that capitalizes on the increasing availability of internet and smartphones which offer the opportunity to create better, more technified, ways to collect community datasets by taking advantage of the
flexibility of software, the safety and reliability of cloud computing, and smartphones’ multiple sensors (including GPS and accelerometers) and media (e.g., audio recordings, pictures and video). Flocktracker originated as a purpose-built tool for researching public transport in developing countries, but it has evolved through iterative prototyping to become a flexible in-field data collection tool that allows users to customize their data collection projects to the specific needs of each site and community. Flocktracker aims to be inclusive across different levels of technology literacy because its usage does not require prior training in computer science or geographic information systems (GIS). As part of the research conducted for this thesis, I further developed the Flocktracker platform, and I also conceptualized and
operationalized a model to observe the potential “democratization” of a tool like Flocktracker to see whether interconnected communities of data collectors might emerge from the process. This study also aims to help participants in the digital community mapping events conducted to learn more about the role of data collection and participation in their communities and to evaluate the potential partnerships that could make the “democratization” process happen.
16 of 140
1.1 Research questions
In this thesis I aim to answer three basic questions regarding the potential impacts of a digital data collection tool such as Flocktracker and potential strategies to spread its use over communities:
• Can Flocktracker and its deployment model serve the needs of local community organizations and their communities when gathering in-field data?
• Does participating in a digitally enabled community data collection process change participants’ perceptions about the role of data and community participation? • Can an initial digital community mapping experience motivate local community
members to undertake their own data collection activities (i.e., “democratize” data collection or make it more widely practiced)?
1.2 Objectives
Through the research undertaken in this thesis, I aimed:
• To work with NGOs to develop community based participatory mapping projects and learn about the challenges they face when setting up and launching projects like this one;
• To identify what kinds of strategies and partnerships would be beneficial to spread the usage of digital data collection in a community;
17 of 140
• To characterize different development stages of a data collection community, from a small niche of users to a democratized tool that is widely used, and develop metrics to observe and measure them;
• To understand what stage of democratization was achieved by the projects developed by taking advantage of metadata generated by the Flocktracker platform and other data sources; and,
• To develop recommendations to conduct community-based digital mapping projects
with the overall goal of making these processes easier and more widespread.
1.3 Thesis organization
The remainder of this thesis consists of:
• Chapter 2 – Providing a literature review describing the role of data in urban planning and the rationale for creating new technology-driven tools for bottom-up data
collection;
• Chapter 3 – Describing the Flocktracker platform, its design drivers, development process, high level technical components and a model of its potential spread in a community;
• Chapter 4 – Describing the experimental setup for the community mapping projects of this thesis;
• Chapter 5 – Describing the development and outcomes of the four experiment cases, three in Indonesia and one in Mexico; and,
18 of 140
• Chapter 6 – provides conclusions, reflections and recommendations for further digital community mapping projects.
19 of 140
2 Background
In this Chapter, I first outline current urban planning practices in relation to two of its most technologically driven and often interrelated areas: urban data and smart cities. The focus will be on the limited participatory spaces offered by the smart city paradigm and modern urban data practices, the difficulties experienced by urban data-driven decision-making, and the negative consequences already experienced by communities living in areas with little to no data available. This Chapter also highlights some insights from the literature about how participation-driven modern urban technologies can be imagined. Thereafter, I describe potential benefits of the democratization of bottom-up digitally enabled data collection
technologies for urban planning and societies. I then examine digital community mapping as an opportunity for citizens to generate their own data, tell their own stories, and participate in planning processes. Then, I introduce the concept of strategic niche management that seeks to systematize means to introduce new technologies to the sociotechnical landscape. The niche use of digital community mapping by NGOs and their communities will be treated in this thesis as the experimental base to understand possibilities for democratizing data collection in the sociotechnical landscape of developing world cities. Finally, I give an overview of Flocktracker as a tool developed to respond to and complement current urban data collection approaches while aiming to facilitate community-led efforts.
20 of 140
2.1 Urban data practice
Urban data is a term applied to information that characterizes human settlements, including socioeconomics, demographics, infrastructure, environmental conditions and historic trends in growth and change (Batty M. , 2008) (Crooks, Pfoser, Jenkins, & Croitoru, 2015). Making decisions based on analyses of data rather than purely on intuition is called data-driven decision-making (Provost & Fawcett, 2013). High quality data that serve as a fact base are a key component for decision-making across a wide variety of sectors and urban scales (White & Engelen, 2000) (Klosterman, 1994). With a data-driven understanding of existing and future urban conditions, urban professionals like architects, developers and planners can better collaborate and make more informed decisions (Ferreira, et al., 2015). Urban data-driven decision-making can benefit diverse areas such as education policy (Mandinach, Honey, & Light, 2006), infrastructure investments (Gramlich, 1994), environmental and public hazard identification (Lawson, et al., 1999), disaster impact assessment ( Lütfi Süzen & Doyuran, 2004), biodiversity conservancy (Maddock & du Plessis, 1999), emergency services (Lee, 2007) among others. Foreseeing the potential that data can have on our deeper understanding of urban systems, Batty (2008) described the emergence of a new urban science based on empirical data that acknowledges the complexities of cities and the myriad of interactions that happen inside them.
Nowadays, planning professionals increasingly use open data sources to do their work (Chakraborty, Wilson, Sarraf, & Arnab, 2015). Open data is often indispensable for public policy development and service delivery (Janssen, Charalabidis, & Zuiderwijk, 2012). These open data sources provide data that is free to use and disseminate, and mostly generated by government
21 of 140
agencies in top-down processes (Janssen K. , 2011). The accessibility of open data can also foster a hacking or open source culture (Baak, 2015).
Notwithstanding the benefits of urban data, open data and data-driven decision making, challenges remain, including: unrepresentative and non-standardized datasets, varied software and server platforms to analyze it, and information gaps not addressed by available datasets (Chakraborty, Wilson, Sarraf, & Arnab, 2015). These can be particularly problematic for
organizations with lower planning capacity and resources (Donovan, 2012). Furthermore, even when they exist, data are often not accessible for non-governmental agencies and researchers (Rambaldi, Kwaku Kyem, Keith McCall, & Weiner, 2006).
The quality of, and access to, data are especially limited in areas such as informal settlements (Zetter & De Souza, 2010). Such places can thus be excluded by formal planning processes and management efforts, with the lack of data used as an excuse (Werlin, 1999). In theory, then, open data resources can be key for understanding urbanization and integrating informality into urban management and planning processes (Chakraborty, Wilson, Sarraf, & Arnab, 2015).
2.2 Participation in smart cities
Technical developments are eroding the boundaries between planning and smart cities (Batty, et al., 2012). As data is continually updated in real time, planning could become more and more about continuous incremental changes rather than long term planning (Kitchin, 2014). As seen by many, particularly by industry vendors, smart cities are automated
22 of 140
According to the rhetoric, with the involvement of Information technologies (ITs) in more urban activities, sustainability problems can be ameliorated by improving efficiency and sometimes revolutionizing urban services, as is happening, for example, with smart grid energy
management solutions (Carvalho, 2014).
Goodspeed (2014) equates the commonly accepted concept of a smart city with the urban cybernetics model (Figure 1) developed by Savas (1970). In this model, the city system is optimized by a combination of sensors, human or not, to gather data and create information feedback and urban models that can predict the most efficient decision to take in any situation. The model highlights the information feedback loop that an optimization and control model needs to be aware of the current state of the system and the consequences of its actions. Savas identified challenges to achieving a system like this, including disagreement about goal setting, government management problems and the inherent complexity of urban systems. Goodspeed characterizes related urban issues as “wicked problems”, with no clear definition, where value judgements play a large role and where setting goals and tracking progress are difficult to achieve (Goodspeed, 2014). Problems like equity, accessibility, mobility, and disaster
23 of 140
preparedness and relief can be described as wicked problems where each stakeholder has a different appreciation and understanding of what the problem is, the current state of its reach, the goals to solve the problem, and how to measure the solution.
A smart city that functions following a centralized and automated computer-based governance system that operates all the urban subsystems is a concept mostly abandoned in the practical sense. Nonetheless, ambitious, large-scale smart city plans exist, including Singapore’s iN2015 (intelligent nation) project, South Korea’s business city, Guangzhou Knowledge City in China and Masdar City in the UAE (Hollands, 2014). Elements of automated monitoring and control are often adopted as “partial” smart city solutions to specific short term issues like traffic congestion and energy management (Goodspeed, 2014) (Carvalho, 2014). These approaches tend to reflect top-down creation processes, with great input from entrepreneurs, experts and engineers that set the systems in place, but little room for participation from urban denizens (Goodspeed, 2014). As Goodspeed argues, however, “no amount of innovation can avoid the necessity of making hard collective decisions” (Goodspeed, 2014). Carvalho also warns: “At best, a top-down ‘smart technology’ push is likely to be
insufficient” (Carvalho, 2014). This can lead to an expert rule where the values of experts prevail over the values of residents (Rittel & Webber, M, 1973), leaving very little room for ordinary people to participate in the smart city (Hollands, 2014).
24 of 140
2.3 Community based alternatives to top-down smart city approaches
Figure 2 illustrates Arnstein’s ladder of citizen of participation. In it, she illustrates a gradient of participation that goes from manipulating communities in non-participatory ways to full citizen control by an empowered citizenship. As mentioned earlier, most common
understandings of the concepts of urban data and smart cities exclude citizens from the process of generating, analyzing, understanding, and making decisions with data. On the ladder, urban data is mostly used as a form of informing and consultation, while many understandings of smart cities do not open any spaces for direct intervention from citizens.
In their study, (Alawadhi & Scholl, 2013) found that the concept of smart cities is associated not only with data and automation in the minds of government officials, but also
25 of 140
with transparent governments and people-centric approaches to technology. The focus on people-centric approaches hints at a governance level understanding of the need for public input and participation when modernizing the way cities tackle their problems.
Goodspeed (2014) proposes two approaches to achieve IT-enabled collaborative planning: local municipal innovation and the incorporation of IT into collaborative urban planning. This is an approach that has been increasingly adopted in recent years, with IT-based approaches that favor community engagement, participation and local innovation (Carvalho, 2014). Greenfield imagines digital urban technologies that allow for a ‘spontaneous order from below’ (Greenfield, 2012). Towards these ends, many local governments, aiming to create more people-centric digital innovations have established local innovation agencies that deal with the issue of coordinating the digital efforts of government agencies, companies, and citizens (Goodspeed, 2014).
2.4 Potential benefits of democratizing digital data collection
Community-based data collection can serve as a participatory counterbalance to top-down data sources. If community-created open data was collected in a variety of subjects and easily available, the planning process could have more evidence-based data sources to inform its decisions. Community-generated data could complement, confirm or challenge the data generated in a top-down manner. For this, digital data collection needs to be democratized: that is, making the technologies to collect urban data, and the techniques to use them, as widely available as possible.
26 of 140
• To make gathering of tailored datasets more commonplace to help solve urban wicked problems;
• To complement the top-down smart city movement and big data flows with bottom-up place-specific data created by the same communities being studied rather than by external agents;
• To make it simpler to fill in data gaps created by informal settlements and systems; • To enable faster, community-based, data-driven disaster response.
• To help smaller community-based organizations undertake data-driven efforts to understand and improve their communities; and,
• To make it simpler for local authorities to update outdated, or infrequently updated, datasets (e.g., census data).
2.5 Strategic niche management for embedding new urban technologies
Strategic niche management is a method to facilitate the introduction of new technologies originally developed for sustainable technologies (Caniëls & Romijn, 2008). It starts with small experimental interventions that help to understand and develop a technology in specific niches with the final goal of embedding the new technology into the sociotechnical landscape (Figure 3) for general use (Schot & Geels, 2008). Carvalho (2014) summarizes the work of Truffer (2002), Kemp (1998) and Schot (2008) on the sociotechnical theory
approaches of strategic niche managing for successfully developing and ultimately embedding new technology into societies via two key activities:
27 of 140
• Learning – Testing and fine-tuning technologies, their variants and conditions of success in real-life environments.
• Societal embedding – The progressive interaction between new technologies/solutions and the social, cultural, political and governance dimensions that structure their use, including three interlinked processes:
o Network building - The creation of constituencies and coalitions of public and private supporters of the technology (potential producers, users, regulators) and resource pooling (for example, money, expertise);
o Infrastructure matching - The adjustment of the new technologies to an existing sociotechnical environment of regulations, standards, business models and physical artefacts; and
o Expectation building - The development of favorable expectations and visions about the advantages of the new technologies for society, (international) attention, and legitimacy for continuing experimentation.
28 of 140
2.6 Digital community mapping as a niche for democratizing data collection
Community mapping is the act of creating maps with the members of a community. Involving people in the mapping process can be a subversive bottom-up activity (Pinder, 1996). The act of community mapping can focus heavily on the activity itself, not on the map (Harley, 1989), which suggests the importance of context and process, rather than outcomes (Perkins & Thomson). The involvement of both the community and the organizers in the creation of the map can be a form of Participatory Action Research (Amsden & VanWynsberghe, 2005). Digital community mapping is a form of “volunteered geographical information” (VGI) (Goodchild, 2011). VGI is a primary source for open urban data that can be used to supplement, and fill gaps left by, more formal data sources like census information or satellite imagery (Chakraborty, Wilson, Sarraf, & Arnab, 2015). It is a manner to crowdsource information about a place (Crooks, Pfoser, Jenkins, & Croitoru, 2015).
Digital community mapping is a way for planners to get more in touch with local
residents’ understanding of a place and for local people to reflect about their reality and create a meaning of the place themselves. For many community mapping projects, very little
resources are available, and pen and paper are the tools utilized, whilst more wealthy places can afford time and money for developing custom technological solutions. There have been some large-scale purpose-specific digital community mapping projects (Open Street Maps, etc.) and relevant customizable tools exist, some community-based (Open Data Kit, Ushahidi,
29 of 140 2.7 Flocktracker
Among the technological innovations allowing for new venues of participation,
Smartphones are remaking both the creation and consumption of information by allowing users to engage in mapping, photography, audio and video capture, capture of GPS sensor data, etc. (Boone, 2015). Flocktracker is a smartphone-based data collection platform that aims to eliminate the technical barriers often faced by researchers, urban planners, and communities when gathering data in the field. It tries to automate as much as possible the process of
creating a new data collection project while maintaining the users’ control of the content of the data collection. It also aims to be as simple to use as possible, so that people without technical backgrounds can set up and deploy their digital field data collection efforts without previous training.
Consistent with the concept of strategic niche management, Flocktracker has been used in numerous research projects around the developed and developing world, allowing users with different levels of technical expertise and purchasing power to collect the data they need for their goals. These projects include collecting data on semi-formal public transport data (Ching, Zegras, Kennedy, & Mamun, 2012) (Zegras, et al., 2015), perception mapping of transit users (Butts, 2014) (Zegras, Butts, Cadena, & Palencia, 2015), environmental planning of public parks (Hwang & Roscoe, 2017) and others (Flocktracker, 2018). Building from these encouraging examples and the potential benefits of widespread usage of digital data collection tools, this thesis aims to examine the possibility for societally embedding Floctracker. Although still based on niche experiments with key partners, the research focus moves beyond technology
30 of 140
partnerships, helping to develop strategies in the urban planning arena, and in democratizing data collection such that it can be a common part of the societal landscape. In the case of this study, the societal landscape is defined as communities in the developing world.
2.8 Summary
Realizing the true potential of the “smart city” movement requires broad engagement and empowerment of the communities themselves. Digital community mapping is one activity that combines both community participation and the creation of data. These two activities match well the objectives of Flocktracker, and the digital community mapping niche already shows, albeit at a small scale, the benefits that democratizing data collection technologies can have on organizations related to city planning and their communities. This thesis examines attempts at digital community mapping in developing country contexts to identify the potential institutional and community interactions that could help foster the democratization of data collection and embed it in the sociotechnical landscape of a place.
31 of 140
3 A field data collection tool: Flocktracker
This chapter describes the design processes and drivers of Flocktracker, including a description of its user experience and components and a high-level technical overview of its implementation details. It also presents one proposed model of what democratization of the tool might look like for users and society more generally.
3.1 User experience design drivers and process
Flocktracker is a flexible data collection platform initially created to be easy and cheap to deploy in a variety of contexts, leveraging smartphone technology. Over time, Flocktracker evolved to become a content-agnostic data collection tool, designed to provide an easy-to-deploy, easy-to-manage, ad-hoc, low-cost, cloud-based field data gathering method. With Flocktracker, high-resolution field data collection projects can be rapidly set up and deployed. The technology enables a range of users, from citizens to academics to businesses, to collect highly heterogeneous field data, store and manage it in the cloud, monitor data-collection in real-time, and, ultimately, choose to share project results among a wide range of interested parties. The tool is envisioned to enable innovative research approaches both in the
quantitative and the qualitative realms in a data collection design as described in section 3.5. Flocktracker’s design process has been iterative, starting in 2011, using field experiences and needs as the main inputs for the definition of design and implementation features. It was first deployed to create the First Bus Map of Dhaka, in a collaboration with an NGO in Dhaka, Bangladesh (Ching, Zegras, Kennedy, & Mamun, 2012) (Zegras, et al., 2015). A second
32 of 140
implementation in Mexico City, Mexico (Zegras, Butts, Cadena, & Palencia, 2015), which aimed to map bus routes and carry out on-board surveys of bus users, entailed a large amount of software development time to adapt to the new context and new data needs. These techniques were later streamlined in St. Louis, United States (Butts, 2014). These early experiences made it clear that an important step forward in allowing anyone to embark on their own data collection processes was to provide a flexible software framework to easily develop and deploy projects with as little technical knowledge as possible. Since these initial implementations, Flocktracker has been used in nearly 30 field data gathering projects on a range of topics and implemented by a range of users.
Flocktracker’s user experience design is based on User Centered Design (UCD, also Human Centered Design, Figure 4) and the Android Material Design paradigm (Google, 2018). The following list contains some of the main drivers of the design.
• The existence of two main types of users.
o Tech-savvy project entrepreneurs that are more aware of the inner workings of the tool and know how to set it up and spread it to their peers. They have more in-depth knowledge about basic data tools and productivity software. They are the main drivers of data collection projects and will be primary users of the data generated, thus they have more motivation to learn about how to setup the software. Although the intent of the experience design for them is to be able to setup projects by themselves without prior knowledge, a user manual was developed to help with the process.
33 of 140
o A more general audience that does not need to understand deeply how the tool works but has basic knowledge about how to use popular cellphone apps and web services and basic productivity software knowledge. They are not
necessarily motivated to learn about, nor have prior knowledge of, how to setup Flocktracker, but they are interested in collaborating with data collection
projects, either by their prior relationship with the project creator or because of their interest in the data collected.
• The tool has been developed with flexibility and easy learning curves in mind.
• It should work as closely as possible as existing software on mobile devices. Although the complexity of the functions in the program is closer to what desktop apps normally offer rather than the often-hyper-focused functionalities of mobile apps, the design aims to be as simple to use as possible for users familiar with mobile apps. This was achieved by having screens, with single focused functionalities, back button navigation, large self-descriptive icons and a pleasing design.
• The software should have high resilience to software crashes. Even if the app fails and must restart, it should resume exactly where the user left her work. The app should “feel” sturdy and reliable.
• The app should be resistant to internet connectivity shortages. The app should keep working seamlessly even in places with no internet connectivity and should upload any data collected to the server as soon as it has access to the internet.
34 of 140
• The selection and development of new features should come from understanding current challenges to using the tool as expressed by the users themselves or by analyzing usage data of the platform.
• Qualitatively, its intended complexity of use sits between that of general audience social media and basic office tool platforms like Facebook, Twitter and Microsoft Word; and professional geospatial software that requires greater expertise like ArcGIS and QGIS. • It should allow for a large variation in terms of the number of people collaborating on a
data collection project, from small teams composed of closely related individuals to large-scale crowdsourced data collection projects.
35 of 140 3.3 The in-field data collection workflow
This section describes an abstraction of the steps of an urban data generation process, from ideation to results that are meaningful for learning and taking action. These processes can range from doing pen and paper surveys outside a subway station about quality of service to setting up sensors around a town to gather data about air quality. The process described was the inspiration for the overall design of the Flocktracker platform and the community
experiment design.
As the diagram in Figure 5 suggests, the envisioned process is a self-feeding cycle in which people that create data collection projects and collect the data repeat the process for different data collection needs. This iteration can help to make the process more streamlined as the project designer develops more experience implementing these projects and learning from
36 of 140
other related projects. Its similarity to the Urban Cybernetics data feedback loop model (Savas, 1970) is intentional. The process consists of four stages – ideation, implementation, analysis and feedback – as detailed below.
Some steps inside each stage might overlap or even combine some projects depending on available resources and strategies to finalize each stage. This is very common in the Ideation and Technology Setup stage, where the possibilities of what to collect are very much related to the technologies and strategies chosen. For example, people that only know how to use pen and paper as their data collection technology will not be able to get accurate GPS data for locations but might decide to print maps and mark places on them to get a sense of the location of their data collection.
3.3.1 Ideation and technology setup
This stage of the process includes going from an idea to a technical solution that will allow the data collection to happen. This can be an iterative process itself, since the potential data that can be collected is limited by the capabilities of the design team and the potential participants and the capabilities of the technology accessible to the team. A team might want to use a digital map to draw all the routes that people use when walking around a place, but if they do not know how to set up the map, or if they think that their community will not know how to use it, they might change to using pen and paper to draw the routes on printed maps. This, in turn, will limit the potential to collect data with the community to in-person
outreaching or mailed-in maps asking people to send their answers. This change in media and technology will then be taken into account in considering the limitations of the new pen and
37 of 140
paper system, where pictures are not easily attached, and future digitalization of the data collected for analysis and publication can be time-consuming. This iteration will continue until a good compromise between the quality, scope and contents of the data to be collected is
achieved based on the technologies available to the participants in the design of the data collection process.
3.3.1.1 Ideation
Based on specific needs that come from previous projects, literature and the planner’s understanding of data needed to ease understanding of a problem in the field, a project is ideated. The ideation and definition of what data to collect can come from the need to fill-in institutional data release gaps, to update already old information, and/or to explore new subjects in the field. This could be, for example, collecting all the informal bus routes in Dhaka, Bangladesh or making a survey of all the public sanitation facilities in Solo, Indonesia. The ideated dataset might include data that needs to be collected with sensors or other measuring devices, like location data, acceleration data, and/or exact time and/or place of data collection. Some projects might just need survey information, while others might require GPS location data to be useful and others might need data to be collected at a specific times and locations, like when collecting all the bus route data of a city.
3.3.1.2 Collection strategy design
Once the project is defined, a strategy on how to use the available resources to collect the data must be developed. This can include using traditional technologies like pen and paper,
38 of 140
making alliances with organizations like universities or companies with the know-how to collect this information, using tools already available in the market, or creating tools purposely
developed for the project. In this step, the limitations of the selected technologies start becoming evident.
3.3.1.3 Technology setup
With a strategy for how to solve the data collection technological needs, the technology is either developed or set-up for deployment. This includes prototyping and testing the tools to make sure they will work when deployed in the field. Technologies can vary from pen and paper and surveyors in the field, off the shelf sensors to deploy around the city, or smartphone apps that allow for data to be collected by a team in the field. As mentioned before, the selection of the technology to be used often influences the ideation of the data collection project itself, which creates an iterative design loop.
3.3.2 Implementation
During this stage, the project designers meet with the people that will collect the information, if they are not doing it themselves, and get the information needed about the field. As digital data collection on the internet allows for near real-time monitoring of the process, changes and corrections can be done while the data is still being collected. This is the step where direct public participation has most often been seen in the case of Flocktracker and in community digital data collection projects. Participation from the public is also easier in this stage since it is the one that requires the least specialized knowledge.
39 of 140
3.3.2.1 Team training
Once the tools are ready, or sometimes during the prototyping and development phase, the training of the data collection team takes place. This includes making sure that all the information to be collected is understood by data collectors, to minimize misunderstanding and systematic errors, and the last stage of testing of the technology and the data collection project itself. In the case of sensor data collection, this process includes debriefing with participants about how to deploy the technology and keep it working. This is the last opportunity for the project’s designers to identify problems with the design of the project, the implementation of the technology, or the nature of the data collected itself.
3.3.2.2 Data collection
This is the step, in which the team collects data in the field. The duration of this stage varies with the amount of data to be collected, the comprehensiveness of the study at hand (from exploratory data collection to comprehensive surveys of a place), the size of the team, the need or lack thereof for monitoring temporal changes in variables collected, and the
complexity of the data to be collected. The possibility for live monitoring during this step can be of great value, for: making the data collection more efficient and comprehensive;
understanding the evolution of data collection over time (e.g., to observe variations in data collection by different surveyors due to comfort levels with the tools and/or interest in participating); and, monitoring and auditing surveyor activity (in near real-time).
40 of 140
3.3.3 Analysis
In this stage the data is compiled, aggregated, visualized and analyzed. Depending on the success of each of the steps in this stage, there might be a need to backtrack to create different visualizations or manipulations of the original information to enable more meaningful analysis. This stage also involves an evaluation of the success of the data collected in fulfilling the initial project objectives (as established in the design stage).
3.3.3.1 Aggregation
This step entails aggregating all the data collected from the relevant sources (like
sensors and people) and sometimes linking these data with other data sources. This step can be time-consuming if, for example, traditional pen and paper surveys are used. Standardization of the formats for collecting the data is key to a streamlined aggregation process. Many digital tools to collect data, like online forms (Google Forms, Survey Monkey), do this aggregation on the fly, making this step automatic.
3.3.3.2 Visualization
Data visualization can be done with maps and charts to help provide further insights on the data collection process, allowing the data collection team to draw initial conclusions. Several relevant tools exist to ease this task, both for free, like QGis or D3, and as paid services, like Microsoft Excel, Mapbox, ArcGIS and Carto.
41 of 140
3.3.3.3 Analysis
The analysis of the information can be done based on the visualizations produced, geoprocessing, statistical methods (e.g., econometrics, machine learning) and other tools that will vary depending on the questions to be answered, the savviness of the analyst, and the complexity and consistency of the data. As with visualization tools, analysis tools that facilitate this step of the work are readily available and accessible, from open source platforms like R and Phyton to paid ones like SPSS and Excel.
3.3.4 Feedback
This stage involves using the outcomes of the analysis to inform the findings and conclusions, upon which relevant actions can be taken. Feedback comes from participants and other people that have access to the results, like colleagues, stakeholders and researchers. This feedback can lead to subsequent improvements in data collection processes.
3.3.4.1 Dissemination
The results (from the raw data to the final analysis) can then be disseminated through various avenues (e.g., publications and presentations) and to various audiences (internal and external). Based on the disclosure of the findings to relevant partners, actions can be taken, and further research can be strategized.
42 of 140
3.3.4.2 Continuous learning
Based on feedback from relevant audiences and the perceived shortcomings of the project, new, innovative ways of undertaking related data collection projects can be envisioned. This feedback can come from various sources, including comments in blogs and social media posts about the findings, and in various forms, such as technical and/or anecdotal suggestions. The goals are to improve the process and obtain better results.
3.4 Flocktracker: High-level technical overview
The Flocktracker platform is a cloud service with a server storing and relaying data to an Android app that acts as the data collector and visualizer. The server-client communications are based on the Representational State Transfer (REST, RESTful) web service architecture. When communicating with the server, the app uses Universal Resource Location (URL) to address each resource like users, projects and their components. Each resource can be accessed using different verbs (GET, PUT, POST, DELETE), each used to alter or access the data in a different way: GET to retrieve data, PUT to modify it, POST to add a new resource and DELETE to remove it from the server.
Communications are protected by three layers for encryption, authentication, and authorization. Encryption is achieved by the Transport Layer Security (HTTP over TLS) that uses the symmetric public key cryptographic algorithm to provide secure communications.
Authentication is handled by the Basic Access Authentication method that allows for the server to verify the authenticity of the client’s identity by attaching username and password data to every call to the server. Lastly, authorization to different projects and datasets is a user
43 of 140
customizable feature of each project. Project creators can give or remove write and read permissions to other users. Only when the three layers are acceded successfully, the server processes the request of the client.
The app can display the Project Builder that allows the user to manipulate the data structures needed to define a project; this data structure is then sent to the server which, in turn, sets up all the databases needed to start collecting data. The builder is made to comply with the FlockSON1 survey markup language. This compliance aims to remove potentials for user error in the fulfillment of this markup language’s requirements. User management involves graphical features that allow for different levels of authorization to be given to different users.
Data collection in offline conditions uses a data cache queue service that stores locally all the surveys, counters and tracker traces. Another service attaches GPS location whenever a new upload is generated. Once the app detects that the user is connected to the internet, it starts emptying the cache by sending data to the server. Only after the server has confirmed that the data is properly stored are the data on the cache deleted.
Data visualization occurs in a customizable map that allows the user to filter the data according to the different survey questions, counter elements, and/or the specific user that uploaded the data. This interface also allows for the download of all the data in CSV format for further post processing and gives the user the ability to generate hyperlinks (URLs) to download and share all the data on other devices.
1 FlockSON (Flock Survey Object Notation) is a markup language developed for Flocktracker based on the JSON language. It is designed to handle the definition and transference of surveys with complex data structures and data collection flows.
44 of 140
3.5 Components
The user-facing side has four main components (Figure 6) that are intended to be embedded into the data collection process to make it easier and seamless.
• Project Builder - A customization tool that allows the user to design, build, edit and test different data structures before deploying them and starting to collect data. The user can design his or her own projects by adding the needed data structures and questions to the project. The project can then be uploaded to the server to share it with others and allow them to start collecting data.
• Data Collection - This component allows for collaborative data collection by several projects concurrently, including GPS movement tracing, surveying, and counting interfaces. Users can setup different levels of permissions for the participants in their projects, allowing them to control who can upload, download and manage data.
• Data Visualization - This allows the user to visualize maps and charts of the data as soon as they are collected as well as the location of the data collection team. Not only can reports of the data collection be generated, but potential biases in the data collection process can be identified in real-time and the data collection team can be more efficiently managed on-the-ground.
• Exploration – This component intends to facilitate inter-project collaboration by allowing the exploration and finding of datasets and data collection projects related to any user’s location and interests. This function is not yet implemented and thus was not
45 of 140
part of the interactions people had with the Flocktracker platform during the research of this thesis.
3.6 Data Structures
Each Flocktracker project can have any combination of these three components:
• Survey - The survey component allows for as many questions as needed, of many types. The survey format is based on FlockSON. Surveys can include several different kinds of questions, with internal logic (e.g., for conditional branching), and can contain pictures. • Counters - This basic tool allows for relevant elements (e.g., traffic and vehicle
occupancy counts) to be counted in the field.
Figure 6 - Flocktracker components embedded in the data collection workflow. Diagram by Chaewon Ahn based on Arturo Cadena’s initial work.
46 of 140
• Tracker – The tracker traces the movement of the device by polling the GPS sensor location every 15 seconds. It can also allow for survey questions, also defined with the FlockSON survey markup language, to be asked before and after starting the tracker. This has a range of potential uses such as mapping informal transit, preferred routes, and basic activity pattern data collection.
All the data collected with any of these structures is tagged with username, timestamp and GPS location.
3.7 Limitations
The software has at least four limitations that could limit the potential participation of community members.
1. The software is not well integrated with social media. It does not allow for sharing the content generated in forms other than URLs or files. This prevents leveraging social networking platforms to outreach directly to the Android app.
2. The app only works on the Android platform which prevents people with iOS from
participating. Although Android is the prevalent smartphone platform in the world, iOS is widespread enough to justify support. This shortcoming may have greater implications in the United States and Europe, where iOS has a larger market share. Presumably, in the developing world, where this thesis research takes place, Android is dominant thus reducing the consequences of this limitation.
47 of 140
3. Data visualization currently consists of maps that the user can filter based on the data collected. Users have, however, identified the need for charts to visualize data; this may be because people are more familiar with visualizing data in a chart form.
4. The Exploration Tool is not enabled in the platform. Users are currently not able to see projects that they were not part of nor join projects that they were not invited to explicitly.
3.8 Democratizing data collection – A model within Flocktracker
The potential for spreading the use of the Flocktracker platform in the sociotechnical landscape of a community relies on the ability of Flocktracker to allow users to join each other’s projects to foster the creation of data collection communities. This is how ‘spontaneous order from below’ (Greenfield, 2012) would look like in the Flocktracker platform. To test this potential, I have conceptualized a four-stage model which entails: project seeding, initial and secondary spread of the tool’s usage, and, finally, establishment of the tool within the community.
3.8.1 Model assumptions
The Flocktracker “democratization” model rests on some assumptions about the available technologies and the community itself, namely:
• The usage of the data collection technology can be taught in one short introductory session;
• Widespread access exists to the platform the technology relies on, or, in the case of Flocktracker, access to Android devices and cellular internet connections;
48 of 140
• People in the community can learn about the usage of the tool;
• In-place community organizers have capacity to organize and setup a data collection process;
• An interesting enough subject exists for which the community can be engaged and motivated to collect data; and,
• This community is not generally averse to data and collaborations with community organizers.
3.8.2 Democratization stages
Below is a description of each of the four democratization stages envisioned and a brief discussion of some metrics that could help to characterize and study the democratization process moving forward.
The seeding stage is envisioned in this thesis as an initial phase within the niche of digital community mapping, but different seeds could be designed in the future to match different niches (e.g. citizen science, political advocacy, nature conservancy, climate change resiliency, disaster relief).
In practice, the observation of these different stages can be difficult since they may happen in tandem once the initial seed project’s outreach campaign stars. For example, many people might setup the platform at, or very close to, the same time and start collaborating on their own projects creating an in-place network from the beginning.
49 of 140
3.8.2.1 Seeding stage
First, community organizers, ideally with participation of their communities, must identify a subject deemed of interest for data collection. Following a guided process to allow for community organizers to familiarize themselves with the tool, a data collection process is setup on the Flocktracker platform. This stage requires the most resources since personal interaction is key to success. The project should be as simple as possible, with just a few questions and setup steps to facilitate its further explanation and eventual spread.
The intended geographic scope of the project should ideally coincide with that of the normal activities of the community members; this will allow for people to participate without deviating too much from their usual paths. This poses the risk that data collection will be concentrated in the places people know and are interested about, which would reduce the quality of the data collected potentially making it irrelevant, but it might also increase the chances of additional participation and enhance the quality of the data as people would be reporting about places they know (Millar, Hazell, & Melles, 2018). A balance between the competing needs of data quality, geographic spread, and ease of access to encourage more participation should be considered.
An initial timeframe for the community data collection should also be set to allow for the data collection process to be better focused. After the established time has passed, a second event can be held where people share their learnings about and new understandings of the subject of the data collection, the data collection process itself, and urban data in general.
The project is then shared with a broader audience in an initial community meeting. This event can be advertised via the internet and social media, leaflets, posters, and in-person
50 of 140
communication. In this initial stage, the organizers should closely accompany community members to make sure that they understand the value of generating and keeping track of urban data and the technical process of how to collect data. People especially interested in the process are also trained on how to design and setup data collection processes themselves. In Figure 7, the Flocktracker logo represents the “seed” project that is setup with a community.
For this stage to be completed successfully, members of the community must be taught how to join a project and to collect data themselves. Although the design of Flocktracker is intended to be easy to use, it would be ideal to have at least some interested members of the community trained on setting up projects themselves.
After the training, a period to invite people to collect data for the project on their own starts. People can be incentivized to collect more data. These might include prizes to the people that collect the most data or partnerships with local authorities to act on the data collected.
Some metrics to observe different aspects of this stage include: the ratio between people that attended and total members of the community; the ratio of people that
understood how to setup the platform on their phones and people that attended the event; the average number of surveys per person during the initial community event and in the data
51 of 140
collection time window after the event; and the geographic spread and density of the data collected.
3.8.2.2 Primary usage spread stage
In this stage (Figure 8), some of the participants of the seed project might want to setup projects on their own to collect data about other subjects of interest. Every new project would operate independently. Relevant metrics to observe this stage include: the number of projects created in a place by people that participated in the seed project; the number of people that joined the seed project; the time that passed between the first community event to share the seed project and the creation of the first and subsequent projects; and, the ratio that divides the number of data points that each user collected in the seed project by the average number of projects created by the same user. The geographic spread and density of the set of projects created can also be measured to identify places where data communities are more interested and active.
It could also be illuminating to identify the “subject spread” of the subsequent projects created, or the similarity of the new projects’ subjects to that of the seed project’s subject. This
52 of 140
could be qualitatively assessed. For example, if seed project A is about mapping local
businesses and subsequent project B is about local restaurant menus, and subsequent project C is about mapping defective street lights, B would be closer to A than C. Quantitative measures could also be used here, using, for example, a metric of semantic similarity via data analytic methodologies. A larger spread and variety of subjects might indicate a more data savvy community. A small spread and variety might indicate that the initial seed project’s subject influences the subsequent use of the platform.
3.8.2.3 Secondary usage spread stage
In this stage (Figure 9), people that did not participate in the original project adopt Flocktracker and create their own projects. In this stage, members of the community might or might not be aware of the seed project and its content. They just use the platform to fulfil their data collection needs.
Various metrics can be used to assess this stage. If, in terms of subject matter, a range of projects were generated in the previous stage, then we could measure the relative success of each of the different subjects in attracting new people to join a given project, collect data, and create new projects. With many projects created, the ratio dividing the total data points collected by the number of people participating in each project can be measured for comparison among projects, subjects, and geography.