Assessment of the Potential Diversion of Air
Passengers to High-Speed Rail in the
Northeast Corridor
byMichael D. D. Clarke
B.S., Aeronautics and Astronautics Massachusetts Institute of Technology, 1992
Submitted to the Department of Aeronautics and Astronautics in Partial Fulfillment of the Requirements for the Degree of
MASTERS OF SCIENCE in Aeronautics and Astronautics
at the
Massachusetts Institute of Technology February 1994
© 1994 Massachusetts Institute of Technology All Rigths Reserved
Signature of Author _1 -_-
-Department of Aeronautics and Astronautics February 1994
Certified by
-Professor Robert W. Simpson Department of Aeronautics and Astronautics
. Thesis Advisor
Accepted by
MASSACHUSEF-TS INSTITUTE Profe-or Harold Y. Wachman
N-'Ot'.GY Chairman, Department Graduate Committee
Assessment of the Potential Diversion of Air Passengers
to High-Speed Rail in the Northeast Corridor
by
Michael D. D. Clarke
Submitted to the Department of Aeronautics and Astronautics on February 2, 1994 in partial fulfillment of the requirements for the Degree of
Masters of Science in Aeronautics and Astronautics
ABSTRACT
The high level of intercity passenger travel in the Northeast Corridor is supported by densely populated metropolitan city-centers, the suitable distance between the urban areas, and the extent to which economic and social activities in these urban areas complement each other. Within the region, automobile and air travel account for the majority of the passenger traffic. The majority of the air passengers travel on the air shuttles operating in the Northeast. However, since the deregulation of the airline industry, there has been consistent traffic growth on regional carriers. The development of transport modes in the Northeast has been governed by the high level of competition which exists. A passenger's modal choice is influenced by the purpose of the trip. The majority of air shuttle passengers are non-discretionary (business) travellers, who are price insensitive and rely more on air travel because of its convenience and travel time.
In 1992, there were 2.41 million air passengers (including regional service) and
600,000 rail passengers travelling in the Boston-New York origin-destination market. The forecasted ridership for high speed rail in this O/D market (2010) is 2.15 to 2.25 million passengers. Of this number, 1.32 million passengers are expected to be diverted from air travel. Based on FAA forecasts for air travel between Boston and New York City in 2010, it is estimated that there will be a twenty-nine percent (29%) diversion of air passengers to high speed rail.
Thesis Supervisor: Robert W. Simpson
Title: Director, Flight Transportation Laboratory Massachusetts Institute of Technology
Acknowledgements
I would first like to extend my sincere thanks and appreciation to everyone who has helped me to complete my research project and thesis. Thanks to Professor Robert
Simpson and Ray Ausrotas, to whom I am indebted, for their advice and guidance.
My deepest gratitude goes to my family, especially my dearest brother, John-Paul Barrington Clarke who has been a source of guidance and comfort in my years at the
institute, and my entire life. My life at MIT has been enlightened by the continued
kindness of Mrs. Millicent Lewis, and the members of Mac Gregor House "B-entry"
who as my family at the institute has kept me in good state. My academic career has
been fostered by the members of the Four Ace Group and the Hometeam, without
whom I would be nothing.
I would also like to express thanks to the following groups and individuals, without whose help this thesis would not have been possible;
Members of the Flight Transportation Lab
The Department of Aeronautics and Astronautics Todd Burger, Arthur D Little
Robert Jenney, The Aeronautics Commission of Massachusetts Don Pickrell, Volpe Transportation Research Center, DOT John Prokopy, Amtrak
Dianne Ricard, Massachusetts Port Authority New York/New Jersey Port Authority
Thanks you.
Finally I must acknowledge the support of all my teachers and professors throughout
Table of Contents
Chapter 1 8
1.1 Introduction 8
1.2 Background 8
1.4 Structure of the Thesis 11
Chapter 2 14
Air and Rail Service in the NE Corridor
2.1 Existing Rail Service 14
2.3 Northeast Corridor Improvement Project 17
2.4 Existing Airline Service 19
Chapter 3 24
Market Surveys and Passenger Demographics
3.1 Amtrak Survey 1986 24
3.2 La Guardia Airport Air Passenger Survey 1990 30
3.3 Massport Logan Airport Survey 1990 34
3.4 Summary of Market Demographics 39
Chapter 4 42
Existing Air Market Conditions: Passenger Traffic
4.1 Traffic Modal Split 42
4.2 Existing Air Market Trends 43
4.2.1 Boston-New York O/D Market 44
4.2.2 Washington - New York O/D Market 47
4.3 Summary of Existing Market Conditions 54
Table of Contents
Chapter 5 56
Forecasting High Speed Rail Ridership
5.1 Problems in Forecasting 56
5.2 Important Issues in Passenger Ridership Forecasts 57
5.3 Types of forecasting techniques 59
5.4 Summary of HSR Forecasts for the NE Corridor 60
Chapter 6 65
Summary: Observations and Conclusions
6.1 Existing Market 65
6.1.1 Level of Competition 67
6.1.2 Passenger Traffic 69
62 Future Markets 70
6.2.1 Forecasted HSR Ridership 70
6.2.1 Assessment of the Potential for Diversion 72
6.2.3 Emerging Competition 74
References 77
List of Figures
3-1 Modal Shares in Major Segments of the Northeast Corridor 3-2 Modal Shares of Common Carriers (Rail/Air) in the NE Corridor
Distribution Based on Trip Purpose
3-3 Distribution of LGA Air Shuttle Passengers Based on Point of Origin 3-4 Breakdown of LGA Air Shuttle Passengers Based on Trip Frequency
3-5 Breakdown of LGA Air Shuttle Passengers Based on Length of Trip 3-6 Distribution of Logan Air Shuttle Passengers based on Point of Origin 3-7 Distribution of Logan Shuttle Passengers based on Destination
3-8 Breakdown of Logan Shuttle Passengers based on Trip Frequency 4-1 Total Revenue Passenger Traffic For Major Airlines Between
Boston-Logan and New York City Area Airports by Quarter
4-2 Total Regional Airline Traffic Between Boston-Logan and New York City Area Airports by Quarter
4-3 Total Revenue Passenger Traffic for Major Airlines Between Washington DC and New York City Area Airports by Quarter
4-4 Distribution of Major Airline Passenger Traffic Between Washington DC Airports and the New York City Airports
4-5 Total Regional Airline Traffic Between Washington DC and New York City Area Airports by Quarter
4-6 Distribution of Regional Airline Traffic Between
Washington DC Airports and the New York City Airports
List of Tables
2-1 Estimated Rail Travel Time Between Boston-New York for High Speed (Metroliner type) Service
2-2 Summary of Airfares Offered in the Northeast Corridor
3-1 Total Trip Volume in the Northeast Corridor
3-2 Breakdown of La Guardia Air Shuttle Passengers based on Trip Purpose
3-3 Age Distribution of La Guardia Air Shuttle Passengers
3-4 Income Distribution of La Guardia Air Shuttle Passengers
3-5 Breakdown of Logan Air Shuttle Passengers based on Trip Purpose
3-6 Age distribution of Logan Air Shuttle Passengers
3-7 Income distribution of Logan Air Shuttle Passengers
5-1 Forecast Rail Ridership in the Boston-New York Corridor
6-1 Summary of Rail Services in the Northeast Corridor
6-2 Summary of Air Services in the Northeast Corridor
6-3 Summary of Demographic Information Based on Survey Data
Chapter 1
1.1
Introduction
The ability of ground transportation to compete effectively with air travel in
the US domestic market has been inhibited by the lack of infrastructure to support
high speed ground transport systems such as high speed rail (HSR) service. The
introduction of high speed rail services might create an environment in which rail
services could effectively compete with existing air services. At present, the US
National Railroad Passenger Corporation (AMTRAK) is conducting studies on high
speed rail, and has conducted test-runs with potential HSR trainsets on existing rail
tracks in the northeast region (Washington DC to Boston, MA). The primary interest
of this research project was to consider the potential of future diversion of air
passengers to high speed rail in the Northeast Corridor.
1.2
Background
Within the Northeast Corridor of the US domestic market, air travel has
become one of the dominant modes of transportation in the region. The existence of
air shuttle services at Boston-Logan, New York-La Guardia, and
National account for between twenty to thirty percent of the total flight operations at each airport. At the same time, rail passenger service has maintained its presence in the region, accounting for approximately fifty percent of Amtrak's national passenger
traffic. The high level of intercity passenger travel in the Northeast Corridor is
supported by densely populated metropolitan areas, suitable distances between the
urban areas, and the extent to which economic and social activities in these urban
areas complement each other [10].
Heavy passenger demand on air travel has lead to increased flight operations.
This has resulted in severe air traffic control (ATC) problems which have a
tremendous effect on the operations of scheduled airline carriers throughout the
Northeast Corridor and the entire US domestic market. The existing ATC problems
which have resulted from congested airspace around major airports could be
alleviated by the introduction of improved ground transportation modes such as
high speed rail, if they could divert a substantial number of air passengers. But such
HSR systems would require large initial capital investments and their success would
depend primarily on the volume of passenger ridership achieved in future years.
Ridership is the critical factor in determining the financial feasibility of a high
speed ground transport system. It would determine the direct and indirect benefits
of the system, and would be a major factor in planning and engineering the design
and operational components [8]. In general, forecasting transportation demand
focuses on the effects of modal factors such as trip time, cost, and frequency on an
individual's choice regarding a particular travel mode. Often these market forecasts
ignore total population and income trends, although these have been shown to play
a major role in determining the actual traffic levels experienced in the Northeast
The ability to accurately forecast passenger ridership for a new transportation
system such as high speed rail in the Boston-NewYork origin-destination market is
hindered by the limited data available, about existing rail service (such as the
Washington DC-New York Metroliner service) which may be comparable to the
proposed high speed rail (HSR) system. However, a number of research projects
have focused on forecasting passenger levels for proposed high-speed rail projects for
the northeast region by creating forecasting methods for an abstract transport mode
endowed with a set of hypothetical modal factors.
Within the Northeast region, the existing transportation market is composed
of automobile, air, railroad, and bus travel, but automobile and air dominate. The
potential attractiveness of high speed rail services to the travelling public is
questionable, as the current AMTRAK rail service does not have a significant modal
share in the region. Advocates of high speed rail have argued that if a high-speed
rail system is established in the US domestic market, most of its passengers will be
diverted from the existing modes of transportation, with very little induced travel.
The critical issue, then seems to be the estimates for diversion from automobile and
air travel to some new form of high speed rail service.
The basis of market share estimates for competing travel modes are discussed
in the TRB Special Report 233 - In Pursuit of Speed: New Options for Intercity Passenger Transport . The report states that for new high speed ground transport systems, the primary market potential in most travel corridors would be air
passengers, although a number of travellers would be diverted from private
automobiles and a small amount of new travellers could be induced. The factors
affecting modal splits of passengers will include price, time, comfort, convenience,
safety, and reliability.
A new high speed rail transport system could have a distinct advantage over
air in some of these categories (comfort, convenience and reliability), possibly
contributing to its enhanced market potential. However, it is difficult for the ground
transportation system to be faster than air travel. Generally, the most important
service characteristics of a transport mode are the travel time and the total travel cost
(including the price of ticket for the access and egress to the mode) between the
passenger's point of origin and final destination. The length of access and egress
times (including wait times), are often more critical than the actual line-haul times,
since they are associated with a higher level of inconvenience and physical effort.
There is the issue of whether or not the new high speed rail system would offer
better access/egress times.
The modal choice of a passenger is influenced by the purpose of the trip, as
business travelers place a greater premium on travel time savings and have less
schedule flexibility than leisure travelers. In the Northeast Corridor, the majority of
air passengers are business travelers, who are price insensitive and rely more on air
travel because of its convenience and travel time, rather than the other factors
mentioned above. The potential for passenger diversion to high speed rail service is
claimed to be greatest for existing air passengers, and thus the proposed rail service
would have to match, if not surpass, the overall travel time of existing air services.
1.4
Structure of the Thesis
The first topic addressed in chapter two is a description of the existing modal
service in the Northeast Corridor, with primary interest in rail and air transport
services. Current rail services and a brief summary of Amtrak's activities in the
region are discussed focusing on the development of high speed rail in the corridor.
Guardia is considered in this chapter. In addition, the growth of regular airline
service in the region is presented with current statistics on the total number of
airline flights offered to and from the three major metropolitan areas (Washington
DC, New York, and Boston) in the region.
Chapter Three is a summary of current market demographics data, based on
survey data collected by several transportation authorities in the region. Applicable
data for the project were provided by Amtrak, Massport and the New York/New
Jersey Port Authority. Information on rail services was derived from a report on
Demand Model Estimation, published for Amtrak in 1989. The data analyzed in this
report was collected in a survey conducted by Amtrak in 1986, and included
information on rail, air and automobile passengers. The data were analyzed and
there is a discussion of the major findings in light of existing market conditions.
In chapter four, the issue of modal split in the Northeast Corridor is
considered in light of the market survey and passenger demographic data presented
in chapter three. In addition, there is an analysis and discussion of the overall air
passenger traffic levels between 1980 and 1992. Existing air travel markets in the
region were examined, using the OD-PLUS database to retrieve the number of
origin-destination passengers in each O/D pair market of interest in the region.
Additional information was obtained from the Official Airline Guide OAG for
August 1993.
In chapter five, forecasting high speed rail ridership is considered, with a
primary interest in its application to the Northeast Corridor. The chapter contains a
discussion of the problems in forecasting, as well as important issues associated with
passenger ridership forecasts. The various types of forecasting techniques used are
also discussed. A summary of available forecasts for high speed rail ridership is
presented, including a discussion of the assumptions made in the ridership forecast
in light of past and existing market conditions.
In the final chapter, there is a summary of the conclusions drawn from the
research project, along with a discussion of future market conditions. The
assessment of the potential diversion of air passengers to high speed rail in the
Northeast Corridor is considered. As a recommendation for future work on the
topic, a passenger survey has been developed as part of the research project. A
complete description of the Air Shuttle Passenger Survey is given in the Appendices.
In addition, there is a discussion of the survey methodology and important issues
Chapter 2
Rail and Air Service in the NE Corridor
2.1
Existing Rail Service
Within the New York-Washington market, Amtrak's high speed electric rail
(Metroliner) service has demonstrated that it can provide good public service. The
existence of high-speed rail in the US domestic market has been limited to the New
York-Washington segment (225 miles) of the corridor, where the company has made
substantial investments in the infrastructure necessary to support such services.
Currently, Amtrak offers a two and one-half hour premium "Metroliner" service
between Washington DC and downtown Manhattan. This market is serviced by air
shuttles as well as regularly scheduled flights originating at the three major airports
(National, Dulles and Baltimore-Washington) which serve the metropolitan
Washington area (including Northern Virginia and Baltimore).
In contrast, the enhancement of rail service between New York and Boston
has been constrained by several technical limitations, such as the curvature of tracks
and the lack of electrified tracks between New Haven, Connecticut and Boston.
Under the Northeast Corridor Improvement Project, Amtrak has initiated a track
modernization program which calls for the full electrification of rail tracks along the
entire travel corridor. This will create the ideal environment for the introduction of
high-speed electric rail service between New York and Boston (231 miles), a market
with similar characteristics to the New York-Washington segment. The expansion
of "Metroliner" service on this route is planned to reduce rail travel time to less
than three hours (station-to-station), compared to one hour (airport-to-airport) for
the existing air shuttle.
Amtrak passenger rail service in the entire Northeast Corridor relies on
railroad tracks which serve a mixture of intercity and commuter passenger trains, as
well as freight trains, operating at speeds ranging from 60 mph to 125 mph with a
broad variety of station stop patterns. Schedules on these heavily travelled lines,
which comprise the Northeast Corridor, are optimized in order to minimize delay
for all trains. Although several high speed proposals are based on the development
of new dedicated lines, the realities of environmental issues, and extremely high
construction costs for new lines will probably force new high speed train services to
operate over existing rail lines. The introduction of regularly scheduled high speed
rail service on existing tracks will have significant impacts on the overall rail
operations of the Northeast Corridor.
The presence of high speed rail (Metroliner) service in the Washington to
New York market is supplemented by conventional rail service. On weekdays,
Amtrak offers seventeen (17) Metroliners and fifteen (15) conventional rail
departures in each direction. This high level of service is achieved by using a
four-lane rail track system between Washington-Union Station and New York-Penn
Station. Metroliner fares are competitive with airlines, especially the air shuttles,
which currently charge $135 each way during the business week. The regular
weekday Metroliner fare is $93 with a discounted fare of $75 on weekends. The price
of a one-way trip on conventional rail service (just over three hours travel time)
between Washington and New York is currently $68.
Amtrak offers conventional rail service between Boston-South Station and
(such as Providence RI, New Haven CT, Stamford CT, and New Rochelle NY).
During weekdays, there are approximately ten one-way rail trips offered between
South Station and Penn Station, with two of these designated as the "New England
Express" service (four hours and ten minutes time duration). The standard
conventional rail travel time between South Station and Penn Station as published
in the Amtrak Northeast Timetable is currently five hours. The published one-way
fare ranges from $52 to $57 (for the express service). In contrast, current air shuttle
one-way fares for one-hour travel between Boston-Logan and New York-La Guardia
are $135 with a special off-peak/youth fare of $72.
The primary intiative of Amtrak's high speed program calls for the
development of an electric trainset for use in the US domestic market, based on
proven technology established in countries with years of operational experience with
high speed rail systems. The US Railroad Corporation (Amtrak) is currently
studying the Swedish built X-2000 high speed tilt "FASTRAIN" and the German
built Intercity Express (ICE) high speed train for possible service on the Northeast
Corridor including the Boston-New York segment of the route. Throughout 1993,
Amtrak conducted demonstration runs of the X-2000 and the German ICE trainset in
the Boston-New York and New York-Washington markets.
The X-2000 trainset utilizes a active hydraulic tilt system which contributes
significantly to passenger comfort levels in high speed operations. The X-2000 train
can sustain operational speeds up to 150 mph on this corridor, as it is designed to
improve speed and performance on existing main line tracks without costly
modifications of the alignment. The intercity express ICE train has a strong
acceleration capability, a lightweight modular design, and a top speed of over 200
mph. It is suitable for the secondary high speed market, as well as dedicated HSR
lines [16]. A secondary high speed market is generally defined as an
destination market which is unable to financially support dedicated HSR lines due the marginal level of passenger traffic in the given market.
2.3
Northeast Corridor Improvement Project
The implementation of the Northeast Corridor Improvement Project (NECIP) by Amtrak will have a significant impact on existing rail services on the Boston-New York route. A discussion of the NECIP project in the report "Commuter-Intercity Rail Improvement Study" published by the Department of Transportation in May 1993 has been reviewed, and the major phases of the improvement project are outlined below. The primary purpose of the report was to identify and characterize costs and benefits of improvements which could be achieved in intercity and commuter rail service on the Boston-New York portion of the corridor [3].
The improvement project is divided into five major programs ranging from system rehabilitation to complete system improvements and electrification. In Program One, system rehabilitation calls for the replacement of out-dated major rail system elements to achieve improved operational safety. It would not include improvements in reliability nor reductions in travel time. The basic system improvement program (Program Two) would incorporate the activities of Program One along with improvements in service reliability and operating speeds. Program Three includes the complete electrification of rail tracks between Boston-South Station and New Haven Terminal, eliminating the need for engine change at New Haven [3].
In Program Four of the NECIP project, the realignment of tracks (to allow the operation of higher speeds on curves) would be implemented in the corridor,
especially between Providence RI and New Haven CT. The curve realignments will provide an additional reduction in trip time, decreasing the Boston-New York trip to potentially as low as two and one-half hours. The final stage of the project includes the construction of a shore line bypass track between New Haven and Providence. It would be a 50-mile long 150 mph right-of-way replacing the most curved section of the rail corridor [3].
Table 2-1 Estimated Rail Travel Time (Hr:Min) Between Boston-New York for Express (Metroliner type) Service
Source: Commuter-Intercity Rail Improvement Study (May 1993)
Program 1 2 3 4 5*
Rolling Stock
Current diesel/electric (NEC) 3:47 3:07 System Fully Electrified Current diesel/electric Tilt 3:46 3:02
Electric System 2:52 2:41 2:29
Electric/Tilt not 2:47 2:37 2:28
High Speed Electric fully 2:46 2:35 2:22 High Speed Electric/Tilt Electrified 2:41 2:33 2:21
Note: * Program Five includes the construction of a new by-pass track
Table 2-1 shows the estimated running time between Boston-New York for express (Metroliner type) service for each improvement program. The four system improvement programs yield projected Boston-New York trip times ranging from two and half to three hours, depending on the level of investment in the project and the type of trainset (rolling stock) used on the corridor. The values presented are based on a computer simulation plus a five percent schedule allowance for normal variations and operational delays. Travel time estimates assume the four
intermediate stops of Amtrak's present New England Express schedule (Back Bay, Route 128, Providence, New Haven). The travel times presented in the table are
optimistic, requiring the validity of all assumptions and railroad operations which
meet the highest standards in terms of precision and reliability. Practical running
times would be several minutes longer than those shown in Table 2-1. For example,
the 3:47 travel time shown for Program One currently gives scheduled times close to
four hours.
2.4
Existing Airline Service
The existing air shuttle services in the Northeast Corridor were first
established in the late 1960's as the economic, as well as social links between
Washington, New York City and Boston experienced continued growth. Initially,
these origin-destination markets were serviced by only one air shuttle carrier, but by
the mid-seventies, there were two carriers offering air shuttle services between
Boston-Logan and New York-La Guardia, and between Washington-National and
New York-La Guardia airports. Each carrier offered hourly non-stop service in the
origin-destination market, starting as early as 6.30 am, and having flights departing
as late as eleven at night. The continued improvement of air shuttle services
between the three metropolitan areas acted as a catalyst for the continued growth in
economic and social relations.
Airline deregulation was noteworthy in the Northeast Corridor markets, as
many airlines such as Peoplexpress (acquired by Continental Airlines in 1987)
established new scheduled air service particularly into Newark, New Jersey, which
due to its close proximity to New York City, serves as one of the three major airports
the growth in regional air carriers, as many startup companies decided to enter the then lucrative airline industry, especially origin-destination markets such as Boston -New York and Washington-New York, which had high volumes of traffic annually. The growth of regional carriers was facilitated by the introduction of larger regional
aircraft types such as the Aerospatiale ATR 42/72 and Saab SF 340. The ability of the
regional carriers to compete more effectively with jet service improved since these
new regional aircraft had much higher cruising speeds and required lower operating
costs than prior regional aircraft.
Over the last decade, the airline industry has survived several mergers and
acquisitions involving major airlines serving the northeast region. Although the
number of carriers serving the market has decreased from its high early
post-deregulation years, the number of available seats miles offered has remained more
or less consistent, as the surviving carriers increased their frequency of service, and
started using larger aircraft on the routes. These improvements in the quality of
service have been more pronounced for the regional carriers.
In the Washington-New York origin-destination market, air shuttle
operations using 150 seat aircraft exist between Washington-National Aiport and
New York-La Guardia Airport. At present, there are thirty-one (31) daily air shuttle departures (each direction) offered in the O/D market during the business week. The
published one-way unrestricted air fare between the city pair is currently $135, a
substantial increase from the $60 fares before domestic deregulation as passengers
have shown willingness to pay greatly increased fares for the air service. These air
shuttle services are complemented by regular air service between the three major
airports in the metropolitan DC area and New York's three major airports. There are
sixteen (16) additional daily jet departures from National, nine (9) jet departures
from Dulles and thirteen (13) jet departures from Baltimore-Washington airport,
destined for the New York metropolitan area [Dl].
Since deregulation, the origin-destination market between New York and Washington is now also serviced by a large number of regional carriers operating at the three Washington airports. The dominance of air shuttle services between La
Guardia and National has limited the number of regional flights offered between the
two airports. However, regional carrier operations account for a substantial
percentage of the daily passenger flights between Dulles and the New York airports,
and between Baltimore-Washington and the New York airports. In total, there are
eighty-four (84) daily regional carrier departures from the Washington area to the
three New York airports. There are thirty-one (31) regional departures from
National, thirty-two (32) departures from Dulles, and twenty-one (21) from
Baltimore-Washington [D1]. All of these frequencies substantially exceed the
seventeen Metroliner and fifteen conventional rail services in the market.
Currently, the Boston-New York market is serviced by two air shuttles
(Logan-La Guardia), as well as several other regularly scheduled major and regional
carriers. In total, these carriers offer seventy (70) daily jet aircraft departures from
Boston-Logan to New York's three major airports, along with forty-four (44)
turboprop departures, again substantially exceeding the ten rail departures. The
number of turboprop departures reflect the significant increase in the level of air
regional traffic between the two cities, as many regional airlines have entered these
lucrative markets. On a daily basis, there are thirty-four (34) air shuttle departures
(150 seat aircraft) from Logan Airport to La Guardia Airport, which serves as a
Summary of Airfares Offered in the Northeast Corridor
Source: Airline Reservation Operators
Destination Origin
La Guardia (LGA) John F Kennedy (JFK) Newark (EWR)
Boston 14 AP SAT 7 AP SAT 3 AP SAT 14 AP NO SAT 7 AP NO SAT 3 AP NO SAT Washington IAD/DCA 14 AP SAT 7 AP SAT NO AP SAT NO AP NO SAT Baltimore (BWI) 14 AP SAT 7 AP SAT No restriction $104 - $138 $140-$340 $100 OW n/a n/a n/a $128 -$148 $155- $210 $161 -$340 $309 -$340 $118 $169 $238 $104-$138 $140 - $340 $100 OW n/a n/a $98 - $158 OW $128 -$148 $155 -$210 $161 -$340 $309 -$340 n/a n/a n/a Notes:
* Continental introduced the "peanut fare" structure in the EWR/BWI market.
n/a Airfare for specific origin-destination market not available.
# AP Number of days advanced purchase required
SAT Saturday night stay required
All air fares are quoted for round-trip travel unless otherwise stated.
Airfares are based on phone inquires conducted on November 13, 1993.
The range of airfares quoted incorporated fares offered by all airlines in each O/D market, based on listing in the Official Airline Guide (October 1993).
Page 22 Table 2-2 $128 $155 $161 $194 $236 $309 $128 -$148 $155 -$210 $161 -$340 $309 -$340 n/a n/a $69* - $138
The air shuttle services are supplemented by thirty (30) jet departures to Newark and six jet departures to JFK. The majority of the fourty-four turboprop departures serve the Boston-Logan to New York (JFK) international connecting travel market, and account for a minimal percent of the New York-Boston O/D passenger market [D1]. In addition, regional service exists between Boston-Logan and Long Island-Islip, Boston-Logan and White Plains, using turboprop aircraft.
In the 1980's, much larger 300 seat aircraft were used at peak times on shuttle routes, offering better economics, and a return to such practices could serve as a solution to future congestion problems. Due to various changes in the marketplace, (a second competitor and the development of regional service), these larger aircraft have disappeared, but they will return if there is future growth in the shuttle markets. As the reader will see in chapter four in the discussion of air market trends over the last decade, the total number of airline passengers in the Northeast region has varied as a result of economic and social conditions, as well as the aftermath effects of the airline deregulation act (1978).
Table 2-2 presents a summary of the current airfare offerings in the Boston-New York and the Washington-Boston-New York O/D markets. The variation in the cost of air travel in the region depends on several factors including requirements of advanced purchasing, Saturday night stay and the time of travel (example off-peak hours). The prices of regularly scheduled air services (excluding the air shuttles) are driven by market conditions, and are usually far less than the air shuttle price of $135 (unrestricted) for each one-way segment. However, the diversion of air shuttle passengers to the cheaper flights is limited by the heavy restrictions which are often imposed on these fare offerings. The air shuttle services are thought to be highly profitable, and the price would easily be lowered if any mode was able to cause diversion. At present, they have a monopolistic position for business travellers.
Chapter 3
Market Surveys and Demographics
In this chapter, a review of available data on passenger demographics and
travel demand within the Northeast Corridor is presented. Since 1986, there have
been a number of surveys of passenger activity conducted by transport agencies in the region. Three such surveys are described below which include data on air shuttle
services at Boston-Logan Airport and New York-La Guardia, as well as data on
conventional passenger rail service in the corridor. They are the Amtrak Survey
1986, the La Guardia Aiport Air Passenger Survey 1990, and the Massport Logan Airport Ground Access Study 1990.
3.1
Amtrak Survey 1986
The characteristics of the intercity passengers who travel within the
Northeast Corridor (Washington DC to Boston) region, are influenced by the high
level of economic and social interactions which exist amongst the major cities in the
region. The interest of high speed rail in North America often focuses on this
market, primarily because it is often considered to be the most likely transport
corridor for a new high speed ground transport system to become economically
viable [10]. In 1986, Amtrak commissioned a comprehensive analysis of travel
patterns in the Northeast Corridor in order to develop a database which would be
used for demand model estimation for the region.
The primary objectives of the 1986 Amtrak study were to develop a new travel database and to examine travel behavior for distinct market patterns. The collected data, which included trip choice data and passenger characteristics, were
used to define modal choice models and to estimate appropriate coefficients of
abstract mode passenger demand models. The information used in the demand
modeling was obtained primarily from the analysis of an extensive traveller survey,
and from secondary sources such as carrier records and government transportation
agencies. The traveller survey was administered in two parts, with a household
based survey and an enroute survey. The enroute survey was distributed on board
Amtrak trains, at selected airports in the region and at screen lines on major
highways in the corridor which were accessible by survey personnel [5].
The development of the modal split model required two modal
characteristics, the access impendances and the linehaul impedances. In the Amtrak
report, impedances are defined as the disutility or generalized economic cost of
travel for a person in terms of time, cost or delay, that characterize a particular set of
transportation mode choice for travelling between two points. Impedances include
access characteristics to and from intercity terminals and major mode linehaul
characteristics between cities. Model development consisted of establishing a model
structure and estimating model coefficients through statistical estimation techniques
[5].
The information presented is a summary of the major findings of the Amtrak
study submitted to the National Railroad Passenger Corporation in July 1989. The
overall traffic volumes for 1986 were determined from the travel surveys. Observed
air trip volumes were obtained by combining annualized one-way passenger counts
by origin and destination airport hubs from the 1986 ten percent sample CAB survey of certified airlines and the 1986 Commuter Air Carrier Activity data. Data on rail
trip volumes was obtained from fiscal year 1986 Amtrak one-way ticket counts by origin station and destination station. Traveller survey data were adjusted and
converted to annual volumes, incorporating data observed Amtrak volumes and
CAB airline volumes [5].
Table 3-1 Total Trip Source:
A. Point of Origin:
Volumes in the Northeast Corridor based on Survey Data AMTRAK Final Report 1989
Boston
Destination City Rail Air Auto
New York 209,650 1,213,395 2,598,918
Washington DC 27,229 555,152 287,425
B. Point of origin: Washington
Destination City Rail Air Auto
New York Boston 519,531 27,229 1,158,777 555,152 1,657,336 287,425 Indicated values represent the number of one-way passengers in the origin-destination
market.
Table 3-1 shows the adjusted travel volumes between the three major cities along the Northeast Corridor. Although the traffic levels have varied considerably since 1986, it is anticipated that the modal shares amongst the competing travel modes have not changed significantly over the period. The corresponding modal splits for the Boston -New York market and the Washington DC - New York market are presented in Figure 3-1. In both origin-destination markets, the automobile accounts for the majority of the traffic, while rail has the lowest mode share in each market (15% Was-NY, 5% Bos-NY).
70% - 65% 60% 50 50% 50% -m Rail 40% 35% 30% ED Air , 30% 20% 15% H Auto 10% 5% 0% Bos-NYC Was-NYC Origin-Destination Market
Figure 3-1 Modal Shares in Major Segments of the Northeast Corridor Source: AMTRAK Final Report 1989
The modal choice of a passenger is driven by the trip purpose, as well as several other factors. The estimated modal splits in the business and non-business categories for air and rail passengers are shown in Figure 3-2.
Within the Boston-New York market, almost all (97%) of the business travellers prefer the air mode over the existing rail option (see Figure 3-2). This mode preference is less pronounced for the non-business traveller where the air share is seventy-three percent versus twenty-seven percent for the rail. The modal split is somewhat different in the Washington DC - New York market, in which Amtrak operates a faster Metroliner train service which is more competitive with the air services between the two metropolitan areas. In the non-business market, the modal share is almost evenly split (rail 48% - air 52%) between the two modes. Within the business market, the air services still possess a dominating market share advantage over the rail option (rail 14% - air 86%).
Boston - New York Market
92%
Non-Business Overall Market (Estimated)
Type of Passenger
Washington -New York Market
Non-Business Overall Market (Estimated)
Type of Passenger
0 Rail O Air
Modal shares of Common Carriers (Rail/Air) in the NE Corridor Distribution of Mode Choice Based on Trip Purpose.
Source: AMTRAK Final Report 1989
Page 28 97% OI 0 [. 100% 90% 80% 70% 60% 50% 40% 30% 20% 10% 0% Business 86% 90% 80% 70% 60% 50% 40% 30% 20% 10% 0% 76% 14% -q-Business Figure 3-2
Based of the data from the La Guardia Air Passenger Survey 1990 and the
Massport Ground Access Survey 1990 (discussed in subsequent sections of this
chapter) the percentage of business passengers in the Boston-New York market is
79%. By using these values, it can be estimated using the Amtrak survey data that approximately 92% of all the travellers using common carriers ( rail and air) in the
Northeast Corridor choose air services, compared to eight percent for rail travel. The
number of business travellers using common carriers (rail and air) in the New York
to Boston market was approximately 1.125 million passengers in 1986, compared to
298,840 leisure passengers in the same year.
Similar results were determined for the Washington-New York market
where there was a 69.8% business to 30.2% leisure split in the survey data. It was
estimated that close to 75.7% of all the passengers using common carriers choose air
services over existing rail services between Washington-Union Station and New
York-Penn Station. Based on the 1986 Amtrak study, the number of business
travellers using common carriers (rail and air) in the Washington to Boston
origin-destination market was approximately 1.172 million passengers, compared to 506,850
leisure passengers in the same time period.
By the end of the decade, the modal split between rail and air service in the Northeast Corridor was affected by the growth in regional carriers in the region. The
market share of regional airlines has increased significantly from its negligible
percentages in 1980. The increased presence of regional service has appeared to have
had a greater impact on the level of air shuttle passenger traffic within the market.
As a result, the market share of Amtrak's rail service between New York and
Washington appears to have increased since the 1986 study. In 1992, Amtrak carried
almost 43% (rail and air shuttle travel) of origination-destination passengers in the
3.2
La Guardia Airport Air Passenger Survey 1990
The following analysis and summary of air shuttle operations at La Guardia
airport, are based on the final report of the "Air Passenger Survey 1990-1991, Volume
2: La Guardia Airport," prepared by the New York-New Jersey Port Authority. It was
possible to isolate the air shuttle passenger data in this report, and these shuttle
services between Boston and New York, and Washington and New York have been
described in Chapter two. The data presented in this final report was collected via
the Air Passenger Survey, conducted over a twelve month period from April 1990
through March 1991. Over the period, the northeast air shuttle services to
Boston-Logan and Washington-National accounted for 16.7 % of the total aircraft operations
at La Guardia Airport, achieving a total annual traffic level of 1.810 million revenue
passengers.
The location of La Guardia airport relative to Manhattan results in a large
percentage (70%) of business travellers on the air shuttles from New York City to
both Boston and Washington DC. The number of leisure travellers on the air
shuttles accounted for approximately thirty percent of the boarded passengers. Table
3-2 shows percentages based on trip purpose on both air shuttles.
Table 3-2 Breakdown of LGA Air Shuttle Passengers Based on Trip Purpose Source: Air Passenger Survey 1990-1991
Trip Purpose Shuttle Passengers
Business 69.8%
Leisure 30.2%
The New York city metropolitan area is serviced by three major international
airports (La Guardia, John F Kennedy, Newark) as well as two regional airports
(White Plains, and Islip). The majority (80%) of the New York City based air shuttle
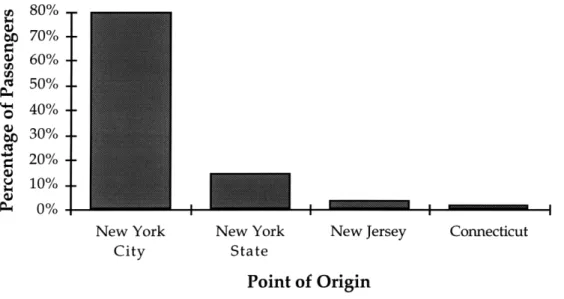
passengers at La Guardia airport originate in Manhattan, as represented in Figure
3-3b. This accounts for only sixty-four (64%) of all shuttle passengers, since only eighty
(80%) of all passengers originate in New York City as shown in Figure 3-3a.
U, U6 ;I W. 80% 70% 60% 50% 40% 30% 20% 10% 0% --New York City New York State Point I - I - I
New Jersey Connecticut
of Origin Figure 3-3a 90% 80% 70% 60% 50% 40% 30% 20% 10% 0%
Distribution of LGA Air Shuttle Passengers Based on Point of Origin
mI -I N Manhattan Queens
-MahtanQen Brooklyn Bronx County Point of Origin Staten Island SuffolkFigure 3-3b Distribution of La Guardia Air Shuttle Passengers Based on Point of Origin Within New York City
Source: Air Passenger Survey 1990-1991
... m . IILII
The majority of the passengers using the air shuttle carriers at La Guardia airport are frequent flyers (with over seventy-five percent of the surveyed passengers defining themselves as such). The actual break-down of passengers based on frequency of travel is given in Figure 3-4. From the data, it can be estimated that close to 60% of the air shuttle passengers take more than ten flights annually.
25% S20% S15% Q 10% 5% 0% 1 to 5 6 to 10 11 to 15 16 to 20 21 to 25 25 to 50 51 to 75 76 to Over 100 100
Number of Shuttle Flights per year
Figure 3-4 Breakdown of LGA Air Shuttle Passengers Based on Trip Frequency
Source: Air Passenger Survey 1990-1991
The prevalence of business passengers on the air shuttles is also reflected by
the distribution based on the duration of the trip. The majority of the air shuttle
travellers in the survey had a stay equal to or less than three days. Approximately twenty-one percent of the air shuttle passengers were travelling on one-day trips.
The overall distribution among surveyed passengers is presented in Figure 3-5.
Based on the data, the average stay for an air shuttle passenger is approximately three days. Most of the air shuttle passengers were travelling alone, with closely to eighty percent declaring themselves to be solo travellers.
25% 20% 15% 10% -5% -Figure 3-5
-
-
---
-1 2 3 4 5 6 7 8 greater than 8Length of Trip (days)
Breakdown of LGA Air Shuttle Passengers Based on Length of Trip Source: Air Passenger Survey 1990-1991
Passenger demographics were also reported in the final report on the Air
passenger survey. The most frequently reported age group for the air shuttle
passengers was 35 to 44 years old. The overall market distribution by age group is
shown in Table 3-3.
Table 3-3 Age distribution of La Guardia Air Shuttle Passengers Source: Air Passenger Survey 1990-1991
Age Group 12 to 19 20 to 24 25 to 34 35 to 44 45 to 54 55 to 64 Over 65 Shuttle Passengers 41 (2.3%) 224 (12.7%) 439 (24.9%) 497 (28.2%) 319 (18.1%) 154 (8.75%) 87 (4.9%) 0% -
I WHMHMH
The household income distribution of La Guardia air shuttle passengers is shown in
Table 3-4, in which the most frequently reported income bracket was $60,000 to
$80,000.
Table 3-4 Income distribution of La Guardia Air Shuttle Passengers Source: Air Passenger Survey 1990-1991
Household Income Shuttle Passengers
Under $20,000 4.0% $20,000 to $39,999 11.3% $40,000 to $59,999 13.6% $60,000 to $79,999 16.1% $80,000 to $99,999 15.1% $100,000 to $119,999 14.4% $120,000 to $139,999 5.1% $140,000 to $159,999 4.9% $160,000 and over 15.6%
3.3
Massport Logan Airport Survey 1990
In 1990, the Massachusetts Port Authority commissioned studies of ground
access travel patterns of airline passengers departing from Logan International
Airport. The data collected in this study was used to ascertain an updated view of
ground access behaviour, and in the Authority's ongoing ground access planning
program. The material discussed below is taken from data generated from the
database developed from the 1990 Ground Access Survey. The main interest of our
research project centers around the point of origin distribution of air shuttle
passengers departing from Logan. From the collected data, it was possible to obtain a
detailed breakdown of air shuttle passenger demand based on origin (Appendix B).
Page 34
60.0 Z 50.0 e 40.0 ' 30.0 20.0 10.0 ] 0.0
Metropolitan North West South Outside 128 Boston Suburban Suburban Suburban Belt
Point of Origin
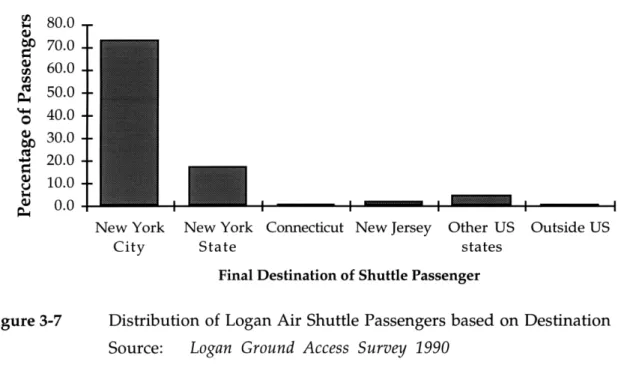
Figure 3-6 Distribution of Logan Air Shuttle Passengers Based on Origin Source: Logan Ground Access Survey 1990
In considering the viability of high speed rail in the Metropolitan Boston to New York City market, it is important to consider the distribution of origin point at both terminals, as this will play an essential role in determining the attractiveness of such a rail system. From the data, it was established that the majority (70%) of the shuttle passengers departing from Logan originate from within the 128/495 belt around the city, with the largest percentage (50%) of passengers starting their trip from the Boston center area (Boston, Cambridge, Somerville and Brookline). The second largest percentage (30%) of passengers originate from outside the 128/495 area as identified in Figure 3-6. The grouping of cities and municipal areas into the five major categories is based of the NYNEX directory system (listed in Appendix B).
From the Logan Ground Access Survey 1990, it was established that seventy percent of the departing Logan shuttle passengers were destined for the New York City metropolitan area (but not necessarily Manhattan where a high speed rail station might be located), with most of the remaining passengers terminating their travel within the tri-state area. Note that if only fifty percent (50%) of the air shuttle
f 80.0 b 70.0 60.0 50.0 ' 40.0 30.0 " 20.0 S10.0 S0.0
New York New York Connecticut New Jersey Other US Outside US
City State states
Final Destination of Shuttle Passenger
Figure 3-7 Distribution of Logan Air Shuttle Passengers based on Destination Source: Logan Ground Access Survey 1990
passengers start their trip within the Boston center area, and only seventy (70%) are
destined for New York City, then approximately 35% of air shuttle passengers are
city-center to city-center passengers, who might use a competing rail service from
South Station to Penn Station. A very small percentage of the shuttle passengers
were identified as connecting travellers, with itineraries leading to other domestic
cities. The overall distribution of passengers based on final destination is presented
in Figure 3-7.
Table 3-5 Breakdown of Logan Air Shuttle Passengers based on Trip Purpose Source: Logan Ground Access Survey 1990
Trip Purpose Resident* Non-Resident Shuttle Passengers
Business 30.2% 48.9% 79.1%
Leisure 7.5% 9.5% 17.0%
No response 0% 3.9% 3.90%
*Where a resident is defined as a legal resident of MA, NH, and RI
The percentage of business travellers in the Logan air shuttle market is very similar
to the distribution observed in the La Guardia market. The majority of the departing
Logan air shuttle passengers are business travellers, with close to eighty percent
being classified as such. The high percentage of business travellers in the
Boston-New York origin-destination market results from the close economic interactions
which exists between the two financial centers. The overall distribution of
passengers based on trip purpose is presented in Table 3-5.
From the Logan survey, it was also possible to establish that a greater
percentage of passengers (62.3%) using shuttle services at Logan are not residents of
the region. The difference between resident and non-resident travellers is more
pronounced in the business segment (48.9% non-resident versus 30.2% resident),
perhaps because many New York based companies, have opened secondary offices in
the metropolitan Boston area. The prevailence of non-residents in the survey data is
reinforced by the percentage of passengers originating in the metropolitan Boston
area (approximately 50%), as most visitors to the city, seek accommodations in the
35.0 30.0 25.0 20.0 15.0 - 10.0 5.0 0- 0.0
1 to 5 6to10 11 to15 16 to 20 21 to 25 25 to 50 51 to 75 76 to Over 100 100
Number of Shuttle Flights per Year
Figure 3-8 Breakdown of Logan Shuttle Passengers based on Trip Frequency Source: Logan Ground Access Survey 1990
metropolitan area, because of factors such as accessibility and location relative to the
city center. The high percentage of business travellers in the Logan market is also
reflected by the number of frequent flyers observed. Approximately fifty percent of
the surveyed travellers had taken more than ten air shuttle flights in a preceding
twelve month period, and nearly 70% had taken five or more in the same time
period. The distribution of passengers based on frequency of travel is given in Figure
3-8.
In the Logan survey 1990, passenger demographics were collected in
conjunction with the primary data on ground accessibility. Generally, the
demographics of interest to forecasters are age and household income, as these
parameters will play a significant role in the estimating future demand for a
transportation mode. It was established that the 31 to 40 age group had the highest
percentage in the market, based on the responce of the surveyed passengers. The
overall distribution of shuttle passengers by age group is shown in Table 3-6.
Table 3-6 Age distribution of Logan Air Shuttle Passengers Source: Logan Ground Access Survey 1990
Age Group Shuttle Passengers
Under 21 2.0% 21 to 30 23.2% 31 to 40 29.1% 41 to 50 27.0% 51 to 60 12.4% Over 60 6.4%
The household income distribution for the Logan air shuttle passengers is shown in
Table 3-7. From the data, it was determined that the most frequently reported
income bracket was $120,000 and above, with the $60,000 to $80,000 bracket having
the next highest percentage.
Table 3-7 Income distribution of Logan Air Shuttle Passengers Source: Logan Ground Access Survey 1990
Household Income Shuttle Passengers
Under $20,000 3.5% $20,000 to $39,999 7.8% $40,000 to $59,999 12.4% $60,000 to $79,999 15.0% $80,000 to $99,999 14.3% $100,000 to $119,999 8.9% $120,000 and over 38.1%
3.4
Summary of Market Demographics
The development of existing transportation modes in the Northest Corridor
has been influenced by the high level of competition which exists in the market.
Currently, automobile, conventional rail, and air travel are the primary modes of
transportation modes in the corridor, with the automobile being the most dominant
transport mode. Within the corridor, air shuttle services account for the majority of
the origin-destination common carrier passengers within the region. In chapter two,
existing rail and air services were reviewed and the competitive environment which
exists was considered.
Over the last decade, there has been a gradual reduction in the number of
passengers using each public transport mode, in part, due to the economic condition
which has existed in the US domestic market. It is assumed that the market share of
been affected by the recession. The modal choice of a passenger is influenced
primarily by the total travel time and the price of travel. It is also influenced by
service characteristics such as the reliability of the scheduled travel time, the
convenience of departure times, comfort, on-board and in-terminal amenities, and
the perceived safety of the travel mode.
The distribution of originating air shuttle passengers at Boston-Logan airport
was determined using data from the ground access survey conducted by Massport in
1990. From the survey data, it was established that the largest percentage of air
shuttle passengers originated in the metropolitan Boston area, with the second
largest percentage originating from outside the Route 128/495 perimeter
surrounding Boston. In addition, it was found that the majority (70%) of the air
shuttle passengers were destined for New York City (but not necessarily Manhattan).
This leads to an estimate that less than one-third of air passengers can be classified as
city-center to city-center passengers in the Boston-New York market.
The La Guardia Air Shuttle Passenger survey data showed that approximately
eighty percent of the air shuttle passengers started their trips in New York City, and
of this number, over eighty percent originated in Manhattan, i.e. sixty-four percent
of air shuttle passengers originated in Manhattan. It is not known where their final
destinations were in Boston or Washington. Since there is not much difference in
access/egress times between rail and air in Boston and Washington, there is a small
fraction of air passengers for whom the access to Manhattan is improved by rail
service.
The majority of air shuttle passengers are business travellers who are
time-sensitive, and rely on the air mode because of its travel time and frequency
advantage over rail services. In the Air Passenger Survey 1990 conducted at La
Guardia airport, it was found that close to seventy percent of the surveyed passengers were on business trips. The percentage of business travellers in the Logan-La Guardia air shuttle market was similar to the distribution observed in the La
Guardia air shuttle markets. It was determined that close to eighty percent of the surveyed passengers were non-discretionary travellers. In addition, it was observed
that the majority of the business travellers were non-residents of the designated
region (Massachusetts, Rhode Island and New Hampshire).
The percentage of business travellers on existing rail service does not follow
the same pattern as that of the air shuttles. In the Amtrak survey 1986, it was
observed that for business trips, rail service accounts only for three percent in the
Boston-New York market and fourteen percent in the Washington-New York
market. In the discretionary market segment, rail services account for twenty-seven
percent in the Boston-New York market and forty-eight percent in the
Washington-New York market. These "improved" rail market shares in the Washington-Washington-New
York market can be attributed to the presence of the premium Metroliner rail service
offered in conjunction with the regular conventional rail service. However rail
service still has not attracted many business passengers, since only 14% of all
passengers on all Amtrak services (Metroliner, Express, and Regular) between