Assessment of Performance in the Domain of Product
Development
by
Ziya Deniz Eralp
B.S. Electrical and Electronics Engineering Middle East Technical University, 1998
Submitted to the System Design and Management Program in partial fulfillment of the requirements for the degree of MASTER OF SCIENCE IN ENGINEERING AND MANAGEMENT
at the
MASSACHUSETTS INSTITUTE OF TECHNOLOGY
August 2012I
MASSACHUSEMTS INST E©2012 Ziya eniz Eralp. All rights reserved. OF TECHNOLOGy
The author hereby grants to MIT permission to reproduce
AUG
20
201
and to distribute publicly paper and electronic
copies of this thesis document in whole or in part
L
A
S
in any medium now known or hereafter created.
Signature of Author:
Ziya Deniz Eralp System Design and Management Program
Certified by:
Approved by:
Eric Rebentisch Research Associate, MIT Sociotechnical'Sy ems Research Center
/ .
f.
Assessment of Performance in the Domain of Product Development
by
Ziya Deniz Eralp
Submitted to the System Design and Management Program on August 15, 2012, in partial fulfillment of the
requirements for the degree of
Master of Science in Engineering and Management
Abstract
Improvement of business performance is an enduring subject of research across a diverse set of disciplines such as accounting, operations management, marketing, finance, economics and even psychology and sociology. In any discipline the ability to create self-awareness, a capacity to evaluate and compare their own behavior to internal standards and values, is a pre-requisite of improvement. In an organization, self-awareness is created with assessments. The results of assessments can help the organization to adapt to changing market conditions by defining more valuable objectives to direct its new businesses as well as to restructure its operations for eliminating deficiencies that limit its abilities to achieve its business goals at lower costs. For an organization with core businesses in product development (PD), assessment of PD is an essential element of all business improvement initiatives. However, in order to perform a focused PD assessment, the analysis needs to be structured with a systematic top-down approach which relates the findings of evaluations starting from high-level business goals down to the metrics for the most detailed operational activities. In this
thesis, an existing Product Development Self-Assessment tool is integrated into this context, and implementation of a top-down assessment is presented using a three-step process. Other supplemental tools and methods are also incorporated into the discussion of the implementation framework such as; Goal-Question-Metric (GQM) and IDEFO function modeling methodologies. With the use of illustrative examples, the application steps of the framework and the use of supplemental methods are presented.
Thesis Supervisor: Eric Rebentisch
Acknowledgements
I had the opportunity to finalize my thesis in a small village on the Mediterranean coast,
where my MIT journey started when I sent my application forms to MIT System Design and Management Program. In these two years, I learned more than I expected. I would like to thank the whole SDM staff and my colleagues for sharing their knowledge and wisdom with me.
I am also very lucky to be a part of MIT Lean Advancement Initiative (LAI) during my
studies at MIT. With the inspiration that I inherited from the LAI family, applying lean principles in organizations will be one of my most persistent aspirations.
Dr. Eric Rebentisch was more than an advisor for me. With his mentorship, I understood the principles of doing research and shaped my own answers for my research questions. His support and guidance will extend beyond this work and will help me in my future studies.
My dear colleagues, Pankaj Kashyap, Dmitry Uspenskiy and Harish Doddala were
generous enough to spend hours with me during our endless discussions. Their perspectives and feedback is embedded into almost every paragraph in this work. Thank you.
And finally, I owe my biggest thanks to my wife Defne and my two little daughters; Irmak and Nil. Your love and support gave me the courage to work for my biggest dreams. My dear parents, I would also like thank you for being patient enough to see us back home.
Contents
A bstract ... 1
A cknow ledgem ents ... 3
1 Introduction...11
1.1 M otivation ... 11
1.2 Thesis G oal ... 13
1.3 Thesis O rganization ... 15
2 Theoretical Background... 20
2.1 A ssessm ent of Business Perform ance ... 21
2.1.1 Balanced Scorecard ... 23
2.1.2 Perform ance Prism ... 25
2.1.3 The SM A RT Pyram id... 27
2.2 A ssessm ent of Product D evelopm ent... 29
2.3 M easurem ent and G oal D riven A ssessm ent ... 34
2.3.1 G oal-Q uestion-M etric (G Q M ) M ethod... 35
2.3.2 Goal-Question-Indicator-Metric (GQIM) Method ... 37
2.4 Process Centric View of Business Perform ance ... 38
2.4.1 Process Perform ance D im ensions ... 41
2.5 ID EF-0 M odel for Process M odeling... 45
2.7 R esearch M ethods... 52
3 Presentation of Fram ew ork... 56
3.1 Step 1: High-Level Assessment of Business... 58
3.1.1 Business Case for the Assessment... 59
3.1.2 Challenges for Business and Corresponding Business Improvement Goals 61 3.1.3 Importance of External Factors in Goal-setting ... 63
3.1.4 Process Improvement Related Aspects in the Business Case ... 66
3.2 Step 2: Questionnaire for Product Development Assessment ... 68
3.3 Step 3: Defining Metrics for Case-Specific Diagnosis of Issues...78
3.3.1 D erivation of M etrics ... 83
3.3.2 Concluding Remarks for Framework Presentation... 89
4 Conclusions and Future D irections ... 93
4.1 Fu tu re D irection s ... 94
List of Tables
Table
1
Mapping of Thesis Sections to Improvement Steps ... 16Table 2 Business Performance Measurement Frameworks ... 22
Table 3 Product Development Assessment Questionnaire Mapping to Business A ssessm ent Fram ew orks ... 32
Table 4 Efficiency and Effectiveness Definitions in Literature ... 41
Table 5 Source: Adapted from B. Braun, "125 Years of Siemens Medical Solutions-Providing the Future in Healthcare," Siemens AG, 2002... 60
Table 6 Overview of Siemens Medical Business Areas and Divisions (Source: Siemens A G, A nnual Report, FY 2000-2001)... 61
Table 7 A Subset of Product Development Competences Defined in PDSAT ... 73
Table 8 A Subset of PDSAT Maturity Level Descriptions (Knoblinger, 2011)...76
Table 9 Example of data collection with SIPOC method...81
Table 10 Questions and Metrics for Detailed Analysis of the Issue Identified by Product Developm ent Assessm ent Questionnaire... 85
Table 11 Assessment Question Used in Identifying the Major Gap ... 86
Table 12 The Insight about Organization's Deficiencies before Step-3 ... 87
List of Figures
Figure 1 Notional Representation for the Business Process Improvement (Hammer, 2010)
... 1 1
Figure 2 Flow of a typical im provem ent cycle... 15
Figure 3 Thesis O rganization ... 19
Figure 4 High Level Classification of Business Performance Related Literature ... 20
Figure 5 Yearly Distribution of "Business Performance Measurement" Articles...21
Figure 6 Balanced Scorecard (R. S Kaplan & Norton, 1992)... 24
Figure 7 Strategy Map Example for the Balanced Scorecard Approach ... 25
Figure 8 The Performance Prism (A. D. Neely et al., 2002)...26
Figure 9 Performance Prism Approach to identify Business Performance Measures ... 27
Figure 10 The SMART Pyramid (Cross & Lynch, 1988) ... 28
Figure 11 Boston Financial Group's Interpretation of SMART Pyramid ... 29
Figure 12 Evaluation of Product Development Assessment Questionnaire Dimensions 33 Figure 13 GQM Model Hierarchy -Adapted from (Basili et al., 1994)... 36
Figure 14 Goal-Question-Metric Steps in Assessment System Implementation...37
Figure 15 GQIM Method Implementation Steps (Boyd, 2005) ... 38
Figure 16 Process; the center of organizational system and performance -adapted from (S in k & T u ttle, 1990) ... 40 Figure 17 Sink and Tuttle Model for Causal Link between Performance Variables and S u cce ss ... 4 2
Figure 18 Profitability and productivity ... 43
Figure 19 Three dim ensions of perform ance ... 43
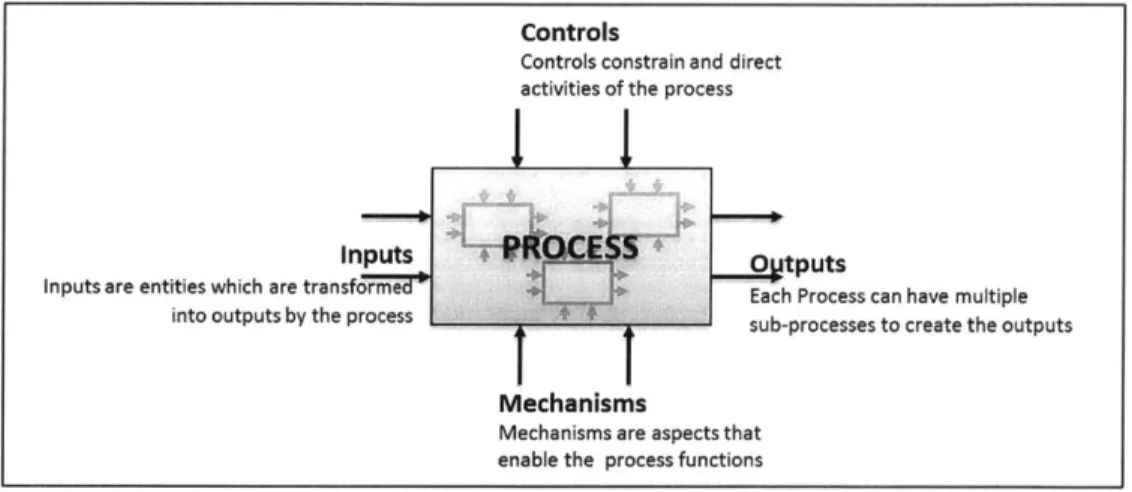
Figure 20 ID EFO Process Block ... 45
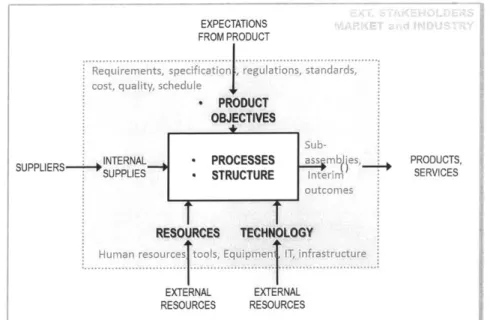
Figure 21 Generic Representation of I/O for IDEFO Process Block for Product D ev elo p m e n t ... 4 6 Figure 22 IDEFO Hierarchical Representation for Generic Product Development Processes (A dapted from Zhao et al., 2011) ... 47
Figure 23 Performance dimensions for IDEFO Process Block ... 48
Figure 24 ID EFO block as a conversion unit ... 49
Figure 25 Main Performance Dimensions for Product Development -Adapted from (Cedergren, W all, & N orstr6m , 2010) ... 50
Figure 26 Research Methods to Support the objective of developing a "product developm ent assessm ent" questionnaire ... 53
Figure 27 Complementary Aspects of "Product Development Assessment"...54
Figure 28 Integration of Business Improvement Goals, Business Processes and Metrics 56 Figure 29 Selected Tools and Approaches for the Framework...57
Figure 30 High-Level Improvement Goals for the Business-Case ... 63
Figure 31 Siemens Reference Process House (Rohloff, 2009)...68
Figure 32 Decomposing Business Goals to PD Assessment Performance Clusters ... 69
Figure 33 Second step in analyzing business issues with the suggested methodology.... 70
Figure 34 Illustrative Results for Initial Screening using Categories within Product Developm ent Assessm ent Questionnaire... 71
Figure 36 Illustrative Example of Results of 'Product Development Assessment
Q u estio n n a ire' ... 77
Figure 37 A generic model of input-output, cause-effect relationship for research and development (Kerssens-van Drongelen et al., 2000)... 78
Figure 38 Associating gaps defined by questionnaire with top-level processes...79
Figure 39 SIPOC Template for Extracting Details of Processes in IDEFO Format ... 80
Figure 40 Illustrative IDEFO Process Model Extracted with SIPOC Template...82
Figure 41 The last step in fram ew ork... 82
Figure 42 Visual Representation of Mapping between Framework, Application Steps and Illustrative Results used in Chapter-3... 90
Figure 43 Goal-Question-Metric Steps in Assessment System Implementation (Repeated) ... 9 1 Figure 44 Diagrammatic Representation of a Management System (Ackoff, 1999)...96
1
Introduction
1.1 Motivation
Self-awareness is an indication of intelligence for entities, which have capacity to evaluate and compare their own behavior to internal standards and values. This property is very critical for adaptation to changing environments, as well as for being able to improve. However, "improvement" is one of the most ambiguous words in language. In order to convey a meaningful concept, this word requires additional information such as; an understanding of "the criteria for doing well"," a method to compare the value two different states of an entity", and "a method to make the tradeoff between cost and benefit of improvement". For business entities, self-awareness starts with the capability of self-assessment, which sets the standards and criteria for doing well in business activities. However, in order to be able to act on the findings of an assessment, and select the right interventions for improvement, the issues addressed by the assessment need to be decomposed into actionable and measurable issues. A notional representation of an "improvement process" has been outlined in Figure 1.
Analyze
Develop
Performance Gap: Dneveto lan Develop Alternatives intervention Plan
I
Define ProcessSpecific Find and Fix Improve
Issues, Gaps Execution Design
L External Data Problem
Self-Assessment and Benchmarking,
ocuiess Industry BestPractices Design Design Performance
THESISSCOPE , Measure
Ensure Compliance Results
Using Measures
t
Design Process Model / Architecture
Figure 1 Notional Representation for the Business Process Improvement (Hammer, 2010)
Change management, development of intervention plans, activities about fixing the problems or architecting a new process architecture (the notional representation of their relations is given in Figure 1) are beyond the scope of this work. This work focuses on methods for identifying gaps and their related metrics by using a three-step process which is analogous to the flow of a typical improvement cycle in the organization. These steps are as follows:
* Business level assessments
* Defining specific issues and gaps related to core operations of the organization (e.g. product development)
* Defining the process-specific metrics that can be used to make decisions about required interventions and to monitor the results of interventions
In literature, there is a substantial amount of theoretical knowledge about assessment approaches that can be used for each of these steps. These approaches are mostly confined in one domain; such as 'business performance assessments', 'product development assessments', 'process quality assessments'. However, the value of insights obtained from assessments can be increased and the analysis effort can be kept more focused with the integration of these steps. Capturing this additional value with the use of an integrated assessment framework is the core motivation of this thesis.
1.2 Thesis Goal
This thesis shares similar goals with some of the fundamental studies introduced in 1990s where the need for "integrating high-level business performance indicators with operational level measures" was identified and frameworks such as "Balanced Scorecard
(BSC)" (R. S Kaplan & Norton, 1992), "Smart Pyramid" (Cross & Lynch, 1988) and
"Performance Prism" (A. Neely, Adams, & Crowe, 2001) were introduced. One common approach for these studies was suggesting a method to connect macro parameters of success of a business with the micro level metrics and keep operations aligned with strategic goals. This required looking at different performance measures which are linked to one another at different levels and were "collectively exhaustive" (McKinsey
MECE Principle: Rasiel, 1999) in addressing the problems of a business and identifying
performance gaps. An approach to 'classify' and 'relate' such measures at different levels in a systematic way has potential to improve the effectiveness of diagnosing business problems and improving the overall performance of the organization. Therefore, the goal of this thesis is to be able to present a methodology to link high-level assessment results to case specific diagnosis of business operations and metrics with a systematic approach.
In the domain of business level analysis, there is profound knowledge and very established frameworks such as Balanced Scorecard (R. S Kaplan & Norton, 1992) and BPMM (OMG, 2008). Organizations can use these frameworks to identify the high-level gaps in their business processes. Once, these improvement areas (gaps) have been identified, they need to be decomposed into specific issues and relate to corresponding metrics to investigate the problem; which requires integrating different approaches, also serving as the goal of this thesis.
This work also has aspirations in remedying the challenges of improvement initiatives in an existing organization. The organization is a large global firm with core strengths in technology and product development. Corporate-level consulting units within this firm have the responsibity for improvement of product development activities, and use a number of different of assessments to identify potential improvement areas within local business units (e.g. CMMI (SEI, 2010)). However, due to the specific practices and activities of business units, resolving high-level issues by breaking them down into actionable pieces has been a challenge for the organization. The practical goal of this work is to develop an integrated process, which can be used by corporate-level consulting units to assist them in identifying possible improvement areas in a comprehensive way, and yet include enough details to diagnose issues in a quantifiable manner with corresponding measures and metrics.
1.3 Thesis Organization
The work is divided into four chapters. Chapter 1 serves as an introduction to the body of work and outlines the motives and objectives of this work. The structure of Chapter 2 and Chapter 3 is aligned with the flow of a typical improvement cycle, which was introduced in section 1.1. This structure is shown below.
Objective:
Business Improvement Goa
I
High-Level Assessment of Business SNp.I Output:- High-Level Gaps Objective:
Ompporunt Identify Specific Issue Areas
output:
I
Specific PD Issues ObjectiveDecomposition of Specific Improvement Identify
Gaps Into Specific targets Measures for Analysis Product
Development Issues Output:
EM:& - Data and Metrics,
Define Metrics Goal Specific
Questions
to Analyze
Merted
ProcessesSpecific Issues
STEP-3
Figure 2 Flow of a typical improvement cycle
Introduction of the material in Chapter-2 and Chapter-3 follows the steps defined in the above figure. However, in order to emphasize the correlation of the thesis content with this structure, the alignment of steps and specific sections within these chapters is presented in the table below:
Step-1. High-Level Assessment of Business Section 2.1. Assessment of Business Performance Section 3.1. High-Level Assessment of Business Input:
Data and Feedback from Business Units
Step-2.Decomposition of Gaps Section 3.2. Questionnaire for
Section
2.2. Assessment ofinto Specific Product Product Development
Step-3. Define Metrics to Analyze Specific Issues
Section 2.3. Measurement and Goal Driven Assessment
Section 3.3. Defining Metrics for Case-Specific Diagnosis of Issues
Supporting Section 2.4.
Process Centric View of Used in various
Supporting material for use Business Performance representations within
within different steps Supporting Section 2.5. IDEF-0 Chapter 3. Model for Process Modeling
Table 1 Mapping of Thesis Sections to Improvement Steps
In order to introduce the discussion in each section, a brief summary will be presented in the following paragraphs.
Chapter 2 introduces basic terms and investigates the state-of-the-art in business performance management. In this context, three important performance management frameworks are introduced. These frameworks provide insight about what aspects need to be questioned in an assessment. The perspectives of these frameworks (Section 2.1) are independent of the main activity of the business. We use them as a starting point in looking at a business. We also analyze the content of our product development assessment questionnaire (Section 2.2) to see the coverage of the questionnaire, and distribution of questions on the business dimensions introduced by these frameworks. Section 2.3 introduces a different approach; "goal-based measurements". The simplest rationale for including this perspective can be summarized as follows; "an assessment without a goal is not likely to guide the assessors to focus on the correct metrics" to diagnose the issues. Goal-Question-Metric (GQM) methodology strongly relies on the traceability of "improvement goals" down to "measures that identify the situation in terms of current state".
In section 2.4. we will divert to a "process centric" view of performance and attempt to complement the "strategy" and "alignment" focused approaches of previous sections. Currently, there is a strong opinion in industry which asserts that successful business result is an outcome of high-performing processes. In this section, we will review the significant works of some authors that will help us visualize how process view helps in seeing business as a network of activities that connect strategies with operations and depicting interactions of different activities within the organization. In this section, we will also explore the origins of terms such as "efficiency" and "effectiveness", which are fundamental in expressing performance of processes. As an original contribution, we will add "goal setting performance" to the existing picture and integrate this aspect to the process view as the third performance dimension supporting "effectiveness" and "efficiency".
During the assessment process, the assessor needs to have a picture of how the business operates and be aware of the dependencies between different processes. This awareness will help the assessor in defining the correct boundary of assessment and stay focused on the activities relevant to the goals of the assessment. As a flexible and strong candidate for structuring this activity network, we use the IDEFO methodology. In this work, IDEFO is suggested as a supporting method to help the assessor in depicting the complex interactions between different activities at different levels of the organization if such representations do not already exist. In addition to suggesting use of IDEFO as a process modeling tool, we will attempt to integrate the 3 performance dimensions (goal setting, effectiveness, efficiency) in the representation. This 3 dimensional view is expected to introduce new questions about looking at process performance issues, where the classical views are mostly biased toward remedying efficiency issues or focused on effectiveness of management, and questioning the value of the original "goals" is mostly omitted.
In Chapter 3, we attempt to integrate the approaches that were introduced in the "theoretical background" sections. However, there are challenges in demonstrating its practical application for a real organization, considering the broad scope of "business improvement" and "product development". Like any other work in this domain; lack of empirical evidence that correlates business results with the use of a particular assessment methodology was a major challenge in validation of the suggested approach. With this limitation, subject matter expert opinion on the content was relied on heavily as supporting evidence, especially for shaping the 'product assessment questionnaire'. In addition, another key challenge in defining the content for this chapter was the commercial sensitivity of sharing business improvement goals and real data originating from assessments performed in the sponsoring organization. In order to overcome this challenge, a publicized business case will be introduced in section 3.1. This business case will help us illustrate the potential value of using the approaches introduced in this integrated approach. Section 3.2 will attempt to integrate the illustrative business case with a "product development assessment questionnaire". The examples provided in this section attempt to represent this integration by giving examples on how the results of each step can be used as an input to the next step. In Section 3.3, the last step is presented in order to demonstrate some examples for incorporating metrics into the analysis of specific process issues which have already been identified by the assessment questionnaire.
The last chapter of this work discusses the conclusions and future directions. In this chapter we will also highlight the importance of "organizational learning" as a key capability to "learn from assessments" and institutionalize the findings about an organization's improvement opportunities.
After the introduction of a summary in above paragraphs, the overall structure of the thesis is presented below:
CHAPTER 2. Theoretical Background
CHAPTER 2.1 Assessment of Business Performance CHAPTER 2.4 Process Centric view of Performance
Balanced Scorecard Process Performance Dimensions
Performance Prism
The SMART Pyramid CHAPTER 2.5 IDEF-0 Method for Process Modeling
CHAPTER 2.2 Assessment of Product Development CHAPTER 2.6 Review of Research Goals
CHAPTER 2.3 Measurement and Goal Driven CHAPTER 2.7 Research Methods
Assessment
CHAPTER 3. Presentation of Framework CHAPTER 3.1 Step 1: High Level Assessment of Business
Business Case for the Assessment
Challenges for Business and Corresponding Business Improvement Goals Process Improvement Related Aspects in the Business Case
CHAPTER 3.2 Step 2: Questionnaire for Product Development Assessment CHAPTER 3.3 Step 3: Defining Metrics for Case-Specific Diagnosis of Issues
Derivation of Metrics
Concluding Remarks for Framework Presentation
CHAPTER 4. Conclusions and Future Directions
2 Theoretical Background
The goal of assessing business performance is an indefinite effort unless specific dimensions of performance have been identified. These dimensions set the focus on one aspect of business and serve as the backbone of an assessment. Literature in defining business performance dimensions is quite diverse. The classification shown in Figure 4 is an attempt to suggest a high level breakdown of different focus areas. Each branch in this figure can be considered to be a discipline for the analysis of businesses, such as: Strategy, Benchmarking, Finance, Valuation, Business Process Improvement, and Performance Measurement. For the purposes of this thesis, we would review the frameworks which are not confined to one field (e.g. financial performance), but suggest a balanced view of different aspects. With this purpose, in the next sections we will review important frameworks, which attempt to depict a comprehensive view of business performance.
Business Process Business Valuation' Imprvemnt Fcusand Shareholder
imprvemnt
FcusValue FocusBusiness
Business
Performance Financial Performance 4Literature Performance FocusMeasurement Focus Focus Groups
Business Strategy Bencharkng and
Competition Focus
2.1 Assessment of Business Performance
As of today, business assessment remains an unsolved problem. Despite the broad spectrum of approaches and numerous studies in management literature, designing and using business measures and assessments to track and improve performance is one of the most persistent problems that organizations face. In this section, we will attempt to identify some holistic approaches to handling this issue and summarize the most important frameworks in literature. Although these frameworks are not assessments, they provide the most comprehensive guidance on what needs to be assessed in terms of business performance. They present a systematic view of how different aspects complement eachother to create a high-performing business, and highlight the fact that performance measurement/assessment is a systems issue. Before visiting these frameworks, a discussion of the current state of the research in the field is presented in the following paragraph.
Defining and measuring business performance is the subject of research across a diverse set of disciplines such as accounting, operations management, marketing, finance, economics and even psychology and sociology (A. Neely, 2007). The number of scholarly articles in this field is increasing at a steady rate as shown in Figure 5.
Yearly Distribution of "Business Performance Measurement" Related Scholarly Articles
(2512 Articles Between 01/01/1980 to 01/01/2012) (Resource: ProQuest ABI/Inform Global Database)
200 Number of 100 --- ---- _-Articles 0 --- - ---- - -1980 1985 1990 1995 2000 2005 2010
Despite the growing contribution to the field, there are a few studies which suggest a systems level approach to the problem. Problems with performance of a business are usually serious and complex system issues (Meyer, 2007). Although the organizational elements which constitute a business aim to improve their results within their context, the aggregate results can fail to meet expectations of stakeholders. In order to solve issues with performance, consciousness of business performance must be elevated from an elemental view to the system level. This is in contrast to an approach that decomposes business into units and focuses on the performance of the individual elements, on the assumption that if each individual part is improved then the sum of the parts will also be better. The "systems thinking approach" suggests that improvement in the performance of all or some part of a system taken separately may not, and often does not, improve the performance of the system as a whole; in fact, such improvements may destroy the system (Ackoff & Rovin, 2003). One key element of "systems thinking" approach to business performance is a measurement system which can provide a holistic framework (a "big picture") to help business unit leaders assess their business and understand where they should focus performance improvement efforts. In this work, we will visit three holistic frameworks which have a strong influence on shaping the rest of the research in this field (citation numbers provided in the Table 2).
Framework Business Performance Dimensions Reference Citations
Over 9000 Balanced Financial, customer, internal processes, (R. S Kaplan & .Ons unti
1 Scorecard learning & growth Norton, 1992) 2012
Peformance Stakeholder satisfaction, strategy, (A Nl et al Over 500
2 Prism processes, capabilities, stakeholder 2001) citations until
contribution 2012
Quality, delivery, process time, cost, Over 200
SMART customer satisfaction, flexibility, (Cross & Lynch, citations until
Pyramid productivity, marketing measures, 1988)
2012 financial measures
2.1.1 Balanced Scorecard
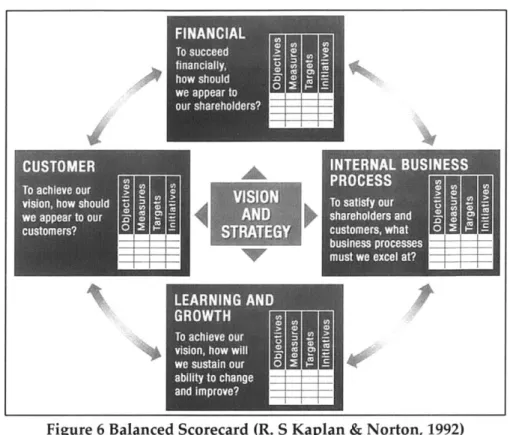
Balanced scorecard (BSC) is a comprehensive set of performance measures defined along four main dimensions (financial, customer, internal, and learning and growth) that provides a framework for translating the business strategy into operational terms (R. S Kaplan & Norton, 1992).
Balanced scorecard, as the name suggests, promotes a balanced view of performance by looking beyond just financial measures that report the results of actions already taken. The strength of the model lies on the combination of the four key dimensions including: financial perspective, customer perspective, internal business processes, and learning and growth. Evidently, balanced scorecard puts strategy, vision and communication in the center of these four dimensions. A brief explanation for each is provided below:
SFinancial; this dimension considers the financial performance of the organization (for example, the profit generated by sales, ROI, project-product profitability). SCustomer; this dimension of performance requires looking at the organization
from the customer perspective. Customer satisfaction and brand recognition are examples of measures which are considered.
* Internal Business Process; this dimension represents the internal processes and procedures that are used to operate the business. As an example, some questions that need to be answered from this perspective are; "are the processes focused on reducing costs?" or "do we use technology well enough to support our operations?".
* Learning and growth this dimension is concerned with the future development of the organization. Adapting skills and restructuring processes in order to improve efficiencies are the subjects of this dimension.
Figure 6 Balanced Scorecard (R. S Kaplan & Norton, 1992)
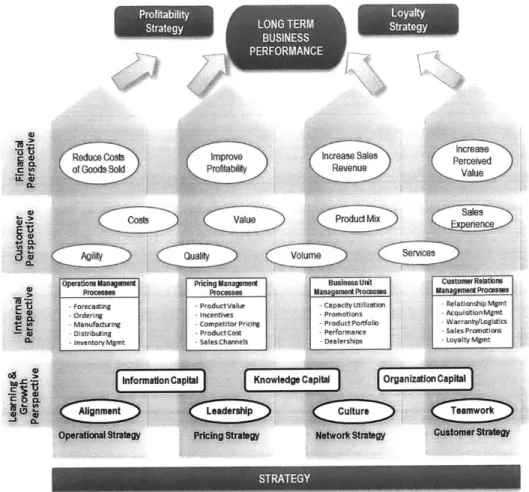
Implementation of BSC is mostly complemented with a strategy map, which is a one
page document that graphically represents the executive level view of organization's strategy and the cause-effect relationship among the goals in the four scorecard dimensions (Robert S. Kaplan & Norton, 2001). Some companies develop a corporate level strategy map as well as the strategy maps for each business unit. An example of a strategy map is shown in Figure 7.
The sub-level maps contain objectives which support the corporate level strategies. With the help of special software, businesses can flow down high-level objectives defined by the strategy maps down to operational levels and aggregate results can be collected automatically (Marr & Neely, 2003).
Profitability Loyalty
Strategy LNTEMStrategy
510 =Reduce Costs Improve Increase Sales
of Goods Sold Profitability Revenue Value
Operatons Msnaust Prlcing Managsmsat Business Uit Custonur Rebtihs Processes Processes ManagemsitProcesaas -aeesltrcSB
-Forecasting ProductValue capacity utilization Relationship Mgmt
Orderrng -netvs- -Promotions AcquisitionMgmt
S -Manufactu ru - -Competitor Pricing Product Portfolo -Warranty/tLogistics -Distritng ProductCot -Performance tales Pronmotons -lnventory Mgmt -Sales Channels -Dealerships -Loyalty Mgmt
~
nformation Capital Knowledge CapIal OrganIzation Capitalh Alignment Leaderahlp Culture Tawr
Figure 7 Strategy Map Example for the Balanced Scorecard Approach
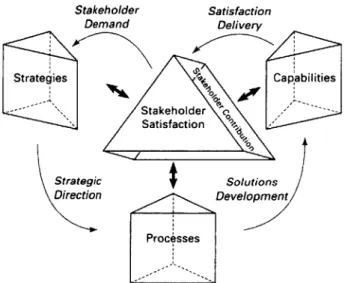
2.1.2 Performance Prism
Performance prism recognizes the importance of taking a holistic approach to stakeholder management in business performance. One key point of this approach is
that the framework suggests explicitly addressing all stakeholders, not only
shareholders and customers but also suppliers, employees, regulators and society (A. D.
Neely, Adams, & Kennerley, 2002). This perspective differentiates it from the 'balanced
scorecard' approach, which has a vision of deriving measures from strategy. Neely suggests starting the process by thinking about the stakeholders and what they want. This corresponds to the one of the five facets of the prism which is stakeholder's
satisfaction. Other faces of the prism include strategies, processes, capabilities and stakeholder contribution. Stakeholder Satisfaction Demand Delivery Strategies Capabilities - Stakeholder 6 Satisfaction Strategic Solutions Direction Development Processes
Figure 8 The Performance Prism (A. D. Neely et al., 2002)
Although considerable attention is placed on the process of finding the right strategies that performance measurement should be based on, neglect of issues such as 'how the model is going to be realized' is a limitation of the approach. The lack of guidance on the process of designing measures and deploying the model, as well as unavailability of supporting software are drawbacks for implementation in a practical scenario. In order to design the measures, the 'performance prism' approach identifies five questions for organizations to address when defining a set of performance measures for any setting
(A. Neely et al., 2001) (e.g. product development, marketing, sales, and supply chain
management):
- Stakeholder Satisfaction- who are our key stakeholders and what do they want and need?
- Strategies - what strategies do we have to put in place to satisfy the wants and the needs of these stakeholders?
- Processes- what critical processes do we need to operate and enhance these processes?
- Capabilities- what capabilities do we need to operate and enhance these processes?
- Stakeholder Contribution- what contributions do we require from our stakeholders
if we are to maintain and develop these capabilities?
Above questions can help an assessor to decompose a business level issue into more granular focus areas.
| A , :II , - %A , ;
Stakeholder
I o --- -, I I un-,satisfaction
Which Which Which
Strategies? Capabilities? Processes? - For customers * For customers - For customers - For employees For employees For employees - For Regulators * For Regulators For Regulators - For suppliers * For suppliers For suppllers
Figure 9 Performance Prism Approach to identify Business Performance Measures
2.1.3 The SMART Pyramid
The SMART pyramid has the goal of linking operations to strategic goals or vision (Cross & Lynch, 1988). The pyramid bricks represent core performances to be measured (see Figure 10 ) at different levels of hierarchy within the organization therefore enabling functions and departments to align towards the same objective which they placed on the summit of the "pyramid".
Corporate Objectives
Market Financial Business
units Mesres
eBusiness
satisfaction Flexibility Productivity operating systems
Quality Delivery Cycle time Waste Departments and workcenters Operations
External Internal
effectiveness effectiveness
Figure 10 The SMART Pyramid (Cross & Lynch, 1988)
This model combines financial, non-financial as well as operational and strategic indicators of performance. SMART pyramid suggests a layered approach to represent the interaction between business units and individual business activities, and hence attempts to align operational performance indicators with corporate objectives. According to Lynch and Cross achieving this objective starts with achieving success in four key operational measures (quality, delivery, cycle, and waste) at the operations level, at the bottom layers of the pyramid. The middle level indicators bridge the gap between the top level indicators and operational level by focusing on customer satisfaction, productivity, and flexibility.
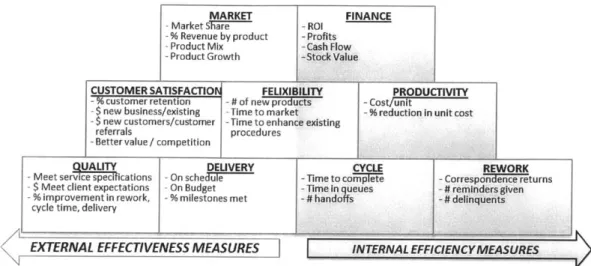
One weakness of this model is the lack of any mechanisms to identify key performance indicators. However, some organizations like Boston Finance Group (BFG) have interpreted SMART pyramid (see Figure 11) and included key performance indicators (Lynch & Cross, 1999). BFG's implementation is an example of how a system of
performance measures / indicators (both financial and non-financial) can be structured in a hierarchical framework which decomposes strategy level measures to operational measures. MARKET - Market Sr - % Revenue by product - Product Mix - Product Growth FINANCE -ROI - Profits -Cash Flow -Stock Value
CUSTOMER SATISFACTION FELIXIBILITY -% customer retention - # of new products
-$ new business/existing - Time to market
-$ new customers/customer -Time to enhance existing
referrals procedures
-Better value / competition
QUALITY DELIVERY
- Meet service specifications -On scheJule - Time to
-$ Meet client expectations -On Budget -Time in
- %improvement in rework, -% milestones met - # hando
cycle time, delivery
EXTERNAL EFFECTIVENESS MEASURES
co
qu ffs
PRODUCTIVITY
-Cost/unit
- % reduction in unit cost
CYCLE REWORK
mplete - Correspondence returns
eues -# reminders given -# delinquents
INTERNAL EFFICIENCYMEASURES
Figure 11 Boston Financial Group's Interpretation of SMART Pyramid
2.2 Assessment of Product Development
The approaches presented in the previous section can be seen as a model of business performance. However, in order to operationalize these models, assessment of the organization, which will depict the existing picture, is necessary. Business performance assessment systems are the formal, information-based routines and procedures managers use to maintain or alter patterns in activities of the business (Simons, 1995). A typical assessment helps businesses in setting the right goals, providing feedback to managers on progress towards those goals, and identifying gaps so that interventions for improvement can be planned. However, assessment and control of business performance is becoming more challenging for many businesses due to the increasing complexity of organizational structures and growing number of processes (Julian
Birkinshaw & Suzanne Heywood, 2009). In order to deal with this complexity, businesses are forced to tailor their high-level assessment templates, and create process/ context specific assessment questions for being able to diagnose the problems at all levels. However, if this tailoring is not done in a systematic way, unstructured assessment systems may impose additional challenges for business unit leaders in seeing the "big picture" of their business and understand where they should focus performance improvement efforts. Also, internal consulting units, which are expected to support business units in identifying performance gaps, lose efficiencies due to extra time and effort required to understand the assessment systems which are used in the organization.
As introduced in section 1.3, one of the goals of this work is to introduce a method which will have practical applications for a product development organization. In order to achieve this, use of a questionnaire, which is focused on identifying the gaps and improvement opportunities in development and engineering functions of the organization is suggested. The intent of the questionnaire is to enable either business unit managers or internal consultants to evaluate productivity, efficiency and effectiveness of a business with the goal of identifying areas to focus improvement efforts. In this work, we will refer to the PDSAT questionnaire which has been developed to help businesses assess the maturity of their product development related activities.
PDSAT is a holistic and integrated self-assessment questionnaire for product
development (Knoblinger, 2011). The questions are derived from product development best practices, current literature on product development and survey results on requirements for self-assessments collected from industry focus groups. The Perform Questionnaire is an assessment survey to explore the product development (PD)
capabilities of an organization and was developed at MIT (Tang, Liu, Seering, & Otto,
2005) and a predecessor to the PDSAT. The assessment tool leverages previous work on
product development focused surveys, previous academic research and industry practices to define a set of questions which address the PD capabilities of the organization. In order to enable integration with other self-assessment questionnaires, which might be already in use for process improvement in the organization, questions are mapped to the Capability Maturity Model Integration (CMMI), the Malcom Baldrige National Quality Award and the LESAT, a lean enterprise self-assessment tool.
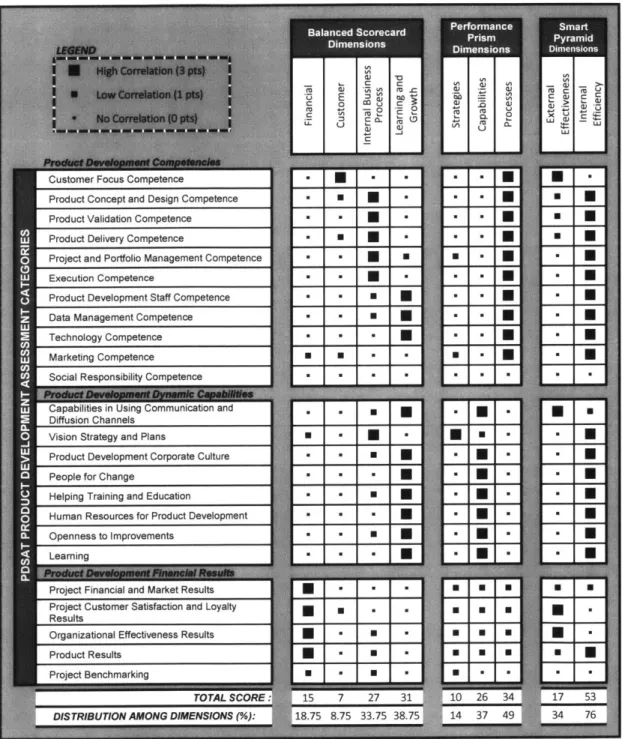
The PDSAT questionnaire comprises 91 questions based on a five-scale maturity-level rating method (Knoblinger, 2011). These questions are grouped under 25 categories, each representing an important aspect of product development. Table 3 below shows the mapping of these categories onto the dimensions defined by "business performance frameworks" which were introduced in section 2.1.
Table 3 Product Development Assessment Questionnaire Mapping to Business Assessment Frameworks
The mapping in Table 3 characterizes the number of questions in PDSAT in terms of its focus areas. As shown in Figure 12, the questionnaire addresses some aspects of those focus areas more than others.
Distribution of PDSAT Questions on Distribution of PDSAT Questions on Distribution of PDSAT Questions on Balanced Scorecard Dimensions Performance Prism Dimensions SMARTPyramid Main Dimensions
Financial Strategies 1 .75% Customer Internal -&7% Business Process 49% 37% Processes Capabilities 38.75%
Learning and Growth
Figure 12 Evaluation of Product Development Assessment Questionnaire Dimensions As seen in the evaluation, the PDSAT questionnaire is more focused on internal efficiencies compared with external effectiveness factors. It is also more process-oriented, and strategy and capability factors receive less emphasis. The results on balanced scorecard dimensions show that, "learning and growth" and "internal processes" receive more focus more compared with customer and financial aspects of product development processes. With this evaluation, PDSAT appears to be a good candidate for assessment of internal processes and capabilities of the organization in the domain of product development, once the strategic and financial issues of business have been analyzed by corporate decision making processes.
2.3 Measurement and Goal Driven Assessment
The frameworks which have been introduced in section 2.1. are useful for viewing business from a holistic perspective and defining the high-level indications of performance gaps. However, business activities in an organization have a large spectrum and can occur at many different levels within the hierarchy. Many activities, which take place in the organization, must be analyzed within their own context considering the specific goals that they serve. Goal-based approaches rely on development of customized performance measures which depend on the specific circumstances in which the activity is taking place. Measures of success need to be oriented towards the specific goal of the activity. A goal-based measurement approach requires "definition of a measurement program based on explicit and precisely defined goals that state how measurement will be used". The most widely known method for applying goal-oriented measurement is the Goal/Question/Metric (GQM) method. GQM can be used to assist all of the frameworks which have been described in previous sections. GQM approach connects a "goal" with specific measures (metrics, indicators) of performance for diagnosing a specific case.
The GQM method is used as a basis for the design of the measurement program to identify metrics for the goals of an improvement activity. The reason for selecting GQM as a method to complement the assessment task is presented below:
GQM is explicitly focused on measurement-based process improvement,
as opposed to Statistical Process Improvement methods such as CMMI
(SEI, 2010). Therefore, it can be used in areas where processes have a
short history, or statistical data is not available. These limitations apply to many functions which take place in the early stages of product
development, or one-time activities of the organization such as introducing new products and services.
* GQM has been developed to be used by a third party assessor, who has
the goal of diagnosing an issue and identifying the quantifiable data to analyze the issue further. This scope is aligned with the motives of this thesis and the envisioned scenarios of practical implementation by process improvement consultants in an organization.
In the following section, GQM and GQIM methods will be introduced.
2.3.1 Goal-Question-Metric (GQM) Method
Goal-Question-Metric approach was originally developed for evaluating problems for a set of software-centric projects in the NASA Goddard Space Flight Center environment. GQM's approach to these challenges was to develop rationale, traceable and efficient measurement strategies according to the underlying improvement or strategy goals. Although the approach was originally used to define and evaluate goals for a particular project in a particular environment, its use has been expanded to a larger context.
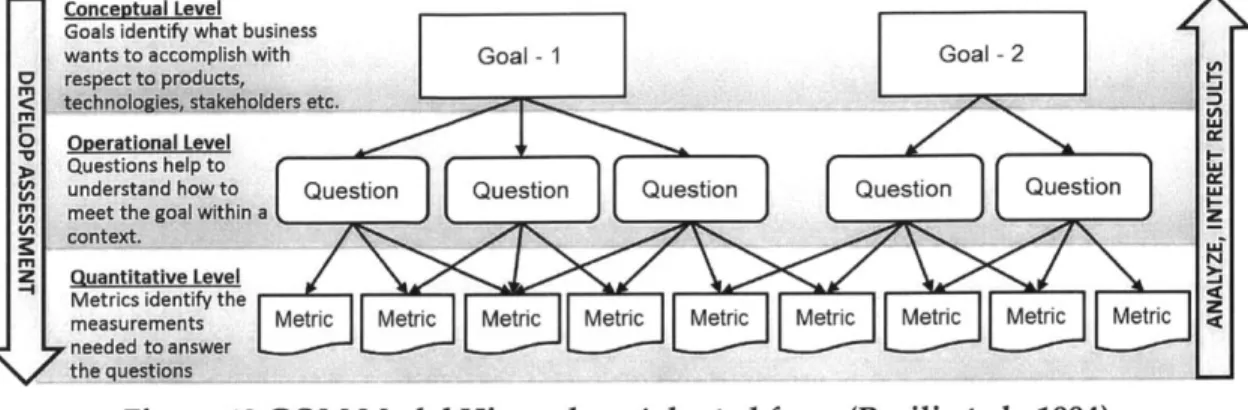
The main principle of GQM is; assessment should be goal-oriented. Therefore, the model suggests a hierarchical structure starting with a goal which specifies the purpose of the assessment, (Basili, Caldiera, & Rombach, 1994). These goals can be refined into questions which will help to solve the goals. Based on the goals and questions, metrics are defined (or selected). The same metric can be used in order to answer different questions under the same goal. GQM procedure can be seen as a three layered structure, as illustrated in Figure 13.
Conceptual Level Goals identify what business
wants to accomplish with Goal - 1 Goal -2
0 respect toproducts,
technoloieS- takehlders etc.
o
Operational LevelQuestions help to
( understand how to Question Question Question Question Question wI
M meet the goal within a I
context.
Z Quantitative Level
Metrics identify the
measurements Metric Metric Metric Metric MeMetri cetric Metric Metric Metric C
needed to answer
the guestions --
-Figure 13 GQM Model Hierarchy - Adapted from (Basili et al., 1994)
The three levels which constitute the hierarchical structure of the model are: conceptual, operational, and quantitative levels. At the conceptual level, the set of measurement goals are defined for different points of view. The operational level decomposes the goals by identifying a set of questions that are related to the performance problem (issue). The quantitative level associates quantifiable variables to the determined questions. These variables can be either objective or subjective, depending on what they are measuring.
GQM can be considered as a methodology for conducting efficient assessments by
defining the right set of metrics needed to assess satisfaction of goals. The approach can be implemented in a diverse range of organizations, environments, products, processes or resources. Implementation requires a six-step process where the first three steps are about using business goals to drive the identification of the right metrics and the last three steps are about gathering the measurement data and making effective use of the measurement results to drive decision making and improvements. These steps are as
1. Develop a set of corporate, division and project business goals and
associated assessment goals for effectiveness and efficiency 2. Generate questions (based on models) that define these goals as completely as possible in a preferably quantifiable way
3. Specify the metrics that need to be collected to answer those questions and track process and product conformance to the goals
4. Develop mechanisms for collecting metrics gathering and data collection
5. Collect, validate and analyze measures (preferably in real time) to provide feedback to decision makers for planning interventions 6. Improve measures and measurement system by assessing its contribution to achieving Improvement goals
Figure 14 Goal-Question-Metric Steps in Assessment System Implementation
Weaknesses have been reported for the GQM approach as well. The most outstanding weakness of GQM is the risk of identifying more metrics than needed. Therefore, "prioritization" or categorization of goals and questions is required to assess different dimensions of situation and balance measures of performance.
2.3.2 Goal-Question-Indicator-Metric (GQIM) Method
Goal-question-indicator-metric model is developed at the Software Engineering Institute
(SEI) and is an extended version of GQM (Park, Goethert, & Florac, 1996). GQIM, similar
to GQM, aligns measures and indicators with business goals, ensuring that the measures and performance indicators selected will be used to show success in achieving these goals. However, an intermediate step for "indicators" is added to GQM in order to assist in linking the questions to the measurement data (Goethert & Fisher, 2003). This interim step helps to link the measurement data or metrics that will be collected with the measurement goals.
GQIM starts by first identifying high-level business goals and then decomposing them into operational statements or sub-goals with a measurement focus. These sub-goals are then translated into measurement goals. Decomposition of each high-level goal requires derivation of a set of questions whose answers lead to statements that identify the type
of KPIs or metrics needed. The overall process is illustrated in the figure below:
Identify Business Goals and Requirements
Identify which aspect of business needs to be
addressbd in the assesment Identify Sub-Goals of assessment
Identify entities, processes and attributes related to sub-goals
Formalize assessment goals
Identify quantifiable/measurable questions and relatedr indicators that will help dia-gnose issues
Identify data elements that need to be collected to construct indicators
Define measures and metrics to be used Identify actions for collection of measures and
metrics
Collect measures, metrics. Analyze issues and store metricfissue
relafions-Goals and s ub- s map business objectives
Assessuent AS Assessment Goal-1 Goal-1 Goal-1
Sub-Goal-1 Sub-Goal-2 Sub-Goal-3 Sub-Goal-4 Sub-Goal-5 Sub-Goal-6
~~~~~~~~~...
-...--- .. .-...----.. --- - -
---Questrucs that
dress
business 001s Question-1 Question-2 Question-3 Question-4
within fh questionnaire "ndicators"such as
chbrts,' ratas and Indicator-1 Indicator-2 Indicator-3 questions
Measures, metrics
that are used to Metric-1 Metric-2 Metric-3 Metric-4 Metric-5
consru~ct
Data from which
Measures/metrics Data Data Data
are derived Source Source Source
Figure 15 GQIM Method Implementation Steps (Boyd, 2005)
2.4 Process Centric View of Business Performance
Independent of the framework or methodology, creation of the process view of an organization is an essential element to understand the organization and issues for any type of business improvement initiative. An organizational system is a set of business processes which take input from upstream activities and feed downstream activities. Success of the business is a result which emerges from high performing processes which
operate in harmony at all levels, similar to elements of a good system. In this section, we will visit the process view of a business and the definitions of performance for a process.
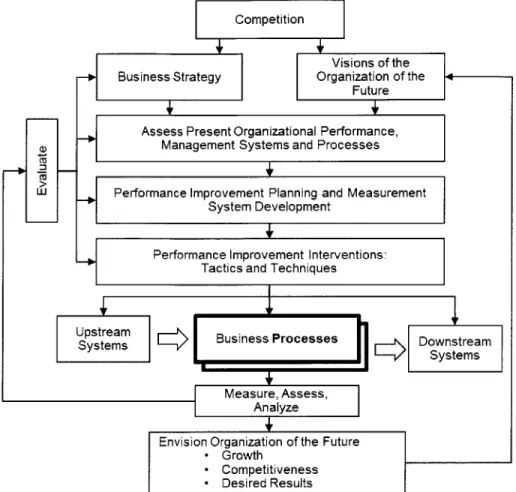
The main objective of creating a process model of the organization is to be able to depict how business results are created by activities of the organization, and controlling and managing the factors that affect these processes in order to increase the effectiveness and efficiency of all value creating functions of the organization. From an operational point of view, this requires having defined processes, measuring their performance, and improving them incrementally. The performance goals for processes can be defined "top-down", based on benchmarking results, goals derived from business strategies, corporate initiatives, or future vision of the organization. The Sink&Tuttle's representation (Sink & Tuttle, 1990) shown in Figure 17, attempts to highlight the key importance of business processes as the central block connecting upstream and downstream system in an organization to growth, competitiveness and desired goals of the business.
Competition
Visions of the
Business Strategy Organization of the
Future
Assess Present Organizational Performance, Management Systems and Processes
W Performance Improvement Planning and Measurement
System Development
q
Upstream Business Processes
j Downstream
SystemsSystems
F
Measure, Assess,Analyze Envision Organization of the Future- Growth
- Competitiveness - Desired Results
Figure 16 Process; the center of organizational system and performance -adapted from
(Sink & Tuttle, 1990)
According to Sink& Tuttle model of organization, processes are controlled by the directions (or objectives) which flow down from business strategy decisions or improvement activities. This is similar to the Balanced Scorecard and SMART Pyramid approaches, which have been discussed in Section 2.1.1 and 2.1.3 respectively. Although the decomposition of 'high-level vision and strategy' to 'downstream operational goals' is a common theme in all of these frameworks, Sink&Tuttle's model refers to "business processes" to handle this hand-over. This model also highlights the importance of
Performance Improvement Interventions:
measurement and assessment for organizational improvement for better business results, referred as "envision organization of the future" by the authors.
2.4.1 Process Performance Dimensions
For the assessment and analysis of a process, most of the authors refer to the generic measures of "effectiveness" and "efficiency". However, in literature and practical use, there is great deal of confusion in meaning of these terms. Table 4 summarizes some of these definitions.
Efficiency is an input an Effectiveness, which involves transformation process question, the right things, at the right
defines as the ratio between the time, with the right quality, (Sink & Tuttle, resources expected to be can be defined as the ratio 1990)
consumed and actually consumed between actual output and
process expected output
Efficiency is the ratio of actual Effectiveness is the degree of output attained to standard output
!accomplishment of objectives,
expected, and reflects how well a (Sumanth, 1998)
and shows how well a set of the resources are utilized to .
accoplih th reultresults is accomplished accomplish the result
Efficiency is a measure of how
economically the firm's resources Effectiveness refers to the
are utilized when providing the extent to which the customer Ken, 2005) given level of customer requirements are met
satisfaction
Efficiency means how much cost is
expended compared with the Effectiveness in manufacturing
minimum cost level that is can be viewed as to what (Jackson & theoretically required to run the extent the cost is used to create Petersson, 1999) desired operations in a given revenues
system
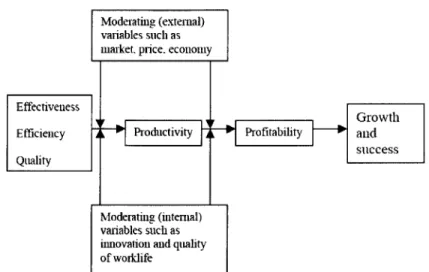
Sink and Tuttle's definition is one of the most widely accepted one. The authors also establish a very high level model to depict the causal relations between "efficiency, effectiveness, quality" and "business growth and success" (Sink, Tuttle, & Devries, 1984).
Moderating (external) variables such as market. price. economy
Effectiveness
]F Growth
Efficiency ~ o Productivity L inkbty and
success
Quality
Moderating (internal) variables such as innovation and quality of worklie
Figure 17 Sink and Tuttle Model for Causal Link between Performance Variables and Success
In this high level model, "'quality", "productivity" and "'profitability" also play an important role. However, these terms also have a broad scope and do not have a single accepted definition in literature. "Productivity", being one of the most widely referred measures of performance, has the widest variation in its definition depending on the context it is defined within. In general, it can be defined as the relation of output (e.g. products, results) to input (consumed materials or resources) in a transformation process. "Profitability" is a result of performance of the products and services of the business processed by the mechanisms of market and competition (see Figure 18).
Inputs Outputs Financial Results
Materials Business Processes Products Market Revenues
Re (TransformationProcess) s E Mechanisms / Processes Product Profits
I
T
Productivity
f
(Business Processes)Profitability
f (Business Processes, Market Processes) Figure 18 Profitability and productivity
In addition to the effectiveness and efficiency, as commonly accepted measures of process performance, we will introduce another dimension; "goal setting". This can be explained with a simple analogy of shooting at an unknown target. With the addition of "goal setting", the overall performance can be abstracted into three main dimensions.
Business
Process
Goal Setting Performance
Effectiveness
Efficiency
Figure 19 Three dimensions of performance Goal Setting Performance:
Best goal may not be selected at first place due to uncertainty and unknown unknowns in the environment. The difference between the "best goal" (which may not be known at the time of objective setting) and the "selected goal" is an