.:
S-L
eRESs
mR
X~:
... ... . . . .. . .. . . . . ,-. . ... . .. .. ... . . ... . ... .-. , . ~ .~~~~~~~~~~~~~~~~~~~~~~~~~~~~~~~~~~~~~~~~~~~~~~~~~~~~~~~~~~~~~~~~~~~~~~~~~~7 - :~i-:- I j0:0: : :~::: -::-: L:_ ; f ,. ... ,- . · .' ... r. ": . ". ;:.. ,! " ' ; ;,.' " ": -. :'0 -:~~~~~~~~, : :'! .-;:. .:-.. - :. :;:.:- .. ., "f; : ; : ! :0 :0:
:0l-· :
: 0 ''d;
: :: D;f
00
.,,-.- ., . . . , , .., . -::'; : : -- i---·~~~~~~~:: :- :.;: ,-.(~' ,.,.r:,.- o~ ,, cHUS INSTITUTE OF. T.cHNOLOG Ti· : : ·I · : . :·; ;.i· · ··-. ; ii - I: -·. -. ;'r -"·' ' .·. . -.·-- _: .·- .i:l.--r-.--i· .1 : ·i ;; ··i-)`· ·· .-1. .··--. :· - ·. i -; · ··;(·; · i ;.... 1·: i --I IIA Distributed Poisson Approximation For Preempt-Resume Clocked Schedules
by
J. Keilson and L.D. Servi
I
A DISTRIBUTED POISSON APPROXIMATION FOR
PREEMPT-RESUME CLOCKED SCHEDULES
J. Keilson*
University of Rochester
Rochester, New York
L. D. Servi
GTE Laboratories
Walthan, Mass
ABSTRACT
Many telecommunication systems with time-critical requirements use a preemptive-resume clocked schedule. An approximation to the ergodic distribution of the time to completion of a low priority task is obtained by treating the preemptive service time distribution as the limit of compound Poisson distributions. Explicit formulae for the first two moments are given which are highly accurate. For random clocked loads, a stochastic bounds is provided for the discrepancy between the exact and approximate distributions. For deterministic clocked loads, sample path bounds are found. Finally, simulation results are exhibited to demonstrate the accuracy of the model.
* Now at The Sloan School of Management, Massachusetts Institute of Technology, 50 Memorial Drive, Cambridge, Massachusetts 02139
* The first author acknowledges the support by the IBM Program of Support for Education in the Management of Information Systems.
L
O
1. INTRODUCTION
Computer systems and telecommunication systems must often perform ordinary tasks together with priority tasks arriving at periodic epochs kA which have strict time-critical requirements. To meet these requirements, the ordinary tasks are interrupted preemptively by the priority tasks and resumed only after their completion. Such a
"clocked" schedule degrades the performance of the ordinary tasks and this degradation must be quantified accurately.
Schedules of this type have been treated previously in [Fl] and [F2]. There, the authors introduce two approximations: (i) Using [F3] they approximate the waiting time of a D/G/1 queue with an exponential distribution, (ii) They approximate the amount of backlog that can be worked off in n clock intervals as normally distributed when n is large. The conclusion is an expression for the delay in terms of the error function. An alternative approach may be found in [Al] where a set of Lindley-like vector equations describing the clocked schedule are identified and then solved using Fast Fourier Transforms [Al] or Levinson's method [A2]. This method of solution requires considerably more computation but is exact. The interactions between an M/G load and a preemptive D/G load through a common single server have also been studied exactly in [01], [02], [03], [S1], [S2] giving rise to structural insights of a somewhat complex nature. One simple relationship found is an upper and lower bound for the delay of an M/M stream by a preemptive D/D stream [02].
The exact analysis of the system needed is intrinsically difficult. The difficulty arises from the mismatch between the discrete periodic input epochs of the priority tasks and the Poisson arrival epochs of the input process. For a certain broad class of priority task distributions Al(x), a simplifying property of infinite divisibility (defined below) is present. This property will be seen in §3 to permit the priority cumulative load process to be approximated with great fidelity as a compound poisson process or as the limit of a sequence of such processes. The system one must then investigate is an M/G/1 system with two classes of customers and preempt-resume discipline. This permits direct application of the results in [KS 1]. In particular simple expressions are obtained for the mean and variance of the steady-state delay of the ordinary customers. This approach is unlike the diffusion approximation in that the latter matches only the first two moments of the load. In our approximation, there is no appeal to the Central Limit Theorem nor are the natural discontinuities induced by tasks suppressed by the sample path continuity of the diffusion approximation.
The simplicity of the M/G/1 apparatus permits one to find sample path bounds and simple stochastic bounds for the discrepancy between the backlog of the approximate system and that of the real periodic system. The accuracy of the distributed approximation is validated through these bounds as well as simulation results.
2. THE SYSTEM
The system consists of a single server and two service classes:
a) ordinary tasks arrive in a Poisson stream of rate X2. The tasks have i.i.d. service times T2with c.d.f. A2(x), and tansform a2(c) = E[exp(-cT 2)];
b) priority tasks arrive at clock epochs kA, k = 0,1,2,.... These tasks have i.i.d. service times T1with c.d.f. Al(x) and transform otl(c) = E[exp(-oTl)]; the
priority tasks preemptively interrupt the ordinary tasks. These are resumed where left off when no priority tasks are present.
The server backlog process BR(t) is Markov but is not time-homogeneous since the priority input is periodic. For any fixed e in [0, A), the discrete time process BR(kA+ 6) is Markov and for stable systems is ergodic. Correspondingly the delay of an ordinary customer arriving with phase 0 will have a steady state distribution.
It will be assumed that the priority service time T1is infinitely divisible [ F] ,
i.e. that for every integer N, T1 is distributed as the sum of N independent and
identically distributed random variables. The simplest and perhaps most important priority task distribution of interest, the deterministic case, has this key property. It is well known [F], [S3] that such continuously distributed variates as the gamma, normal and mixture of exponentials have the property as do the discretely distributed deterministic, negative binomial, and Poisson variables. A variate having this property may be scaled and shifted without losing it. It follows that any variate concentrated in the neighborhood of some value with specified mean and standard deviation may be approximated by some shifted gamma or negative binomial variate having the same moments. Even though such a variate is theoretically unbounded, its extent can be kept small.
By virtue of de Finetti's Theorem F]1 any infinitely divisible random variate is the limit in distribution of some sequence of compound Poisson variates. Let the cumulative priority (periodic) load process over an interval of length t be designated by X(t). Then, as we see next, de Finetti's Theorem assures that X(t) may be approximated
by a process with independent increments which is the limit of a sequence of compound Poisson input processes XN(t). The cumulative distribution of the priority load at clock ticks for both the actual system and the approximating system epochs will be, by construction, identical.. Indeed, X(kA) - X((k- 1)A) =d limN.[XN(kA) -XN((k- 1)A)
]
=d T1for all k.Specifically, let
(2.1) AN =N / A
and let TAN be a random variable with transform
(2.2) aAN(s) = allN(s)
where al(s) is the transform of T1. Then, as in the classical proof of de Finetti's
Theorem [F],
(2.3) al(s) = lim Noo
[
exp({-.AN A[1- IAN(s)] ].and, from (2.2) the mean and variance of T1, I.1and o12 , are related to AN and TAN
by
(2.4) a) l = lim N-..AXANE[TAN]; b) c12 = lim N-o AXAN E [T2AN ].
The preempt-resume clocked system is thereby approximated as the limit of a sequence of preempt-resume systems with two input streams, both having Poisson arrivals of finite rate. This treatment of the clocked load may be called the distributed Poisson approximation.
A comparison of the real clocked system' and the distributed Poisson system approximation is needed to validate the approximation. For this comparison the following notation will be used throughout this paper.
The distributed Poisson aproximation Here no load arrives at clock ticks. Instead the priority load arrives as a compound Poisson process.
Let
WAk(c,t) be the cumulanive priority load in [kA, kA +); Wk(co,t) be the cumulative ordinary load in [k kA +bt);
IAk(co,') be the cumulative idle time for the server in [ kA, kA +);
The workoff rate in [0,) is (d/ds) BRk(co,¶) = -1. Then, for k= 0,1,...
(2.5) BA(Co,') = BAk(C, 0-) + WAk(co,t) + Wkk(C,t) + IAk (o,'t) - ', ' e [0,)
where BAk(c, 0-) is defined as BA(k.1)(O, A-) for kgO and as the initial system backlog if
k=0.
The real system. The cumulative ordinary load Wkk(o,t) is exactly the same. Tlk(co) is the priority load that arrives at kA- and, by construction equals WAk(co,A'). Let
IR(co,'t) be the cumulative idle time for the server in [ kA, kA +r); BRpk(c,'t) be the backlog at time kA +', 'r e [0,A).
The process BRk(c,'t) is taken to be be right-continuous with
(2.6) BRk(Co,O) = BRk(co, 0- ) + Tlk(co), k = 1,2,...; BRO(C,O) = T1 0(co)
(where BRk(o, 0-) is defined as BRk.l(c, A- ) for k*0 and as the initial system backlog if k=0).
The workoff rate in [0,A) is defined as (d/dt) BRpk(o,t) = -1. Then, for k = 0,1,...
(2.7) BRk(o,t) = BR(co, 0- ) + Tlk(CO) + WAk(oW,T) + IRV(,) - , 't [0).
The discrepancy between the backlog process of the real and approximate system is given by
(2.8) Dk(co,t) = BRk(o,r) -BAk(co,), r [o0,).
Then from (2.5) and (2.7) one has for k =0,1,...
(2.9) Dk(o,) = Dk(co, 0-) + Tlk(co) - WAk(o),t) + IRk(co,,) - IA(O,r), r e [0,A).
As previously noted the cumulative load of the approximate system over [kA, (k+1)A) equals the load arriving at the real system at t = kA-. Hence,
(2.10) Tlk(C) WAk(w,t) , te [0),
3. RESULTS FOR THE DISTRIBUTED POISSON APPROXIMATION
The system approximating the clocked system is equivalent to the limit of a sequence of systems SN parameterized by N. System SN is a single server system with a first stream of Poisson traffic with arrival rate XAN and service time TAN having preempt resume priority over a second stream of Poisson traffic with arrival rate %2 and service time T2. From [KS 1] the ergodic time in system for the lower priority traffic
can be found. THEOREM 1:
The ergodic time in system for the lower prioirty traffic has an expected value of
(3.1) E[U2A] = 2/A X +
2E[T] 22 +E[T 2]
2(1-ps)(1-p l) 1-pi
and a variance of
(3.2) V2A = lim NooVar(U2N )
E[U2A]O12 + As2 + Var[T2]
(1-Pl) 3 4(1-p
5)2 (1-pl)2
E[T23]AX, + E[T13] + 3E[TI]ErT 2] - 2E3[T1]
A (1 - Ps) where (3.3) As = l12/ A + 2E[T22], (3.4) P1 =,/A, and (3.5) Ps = g1/A + 2E[T2J.
Proof: See Appendix. ,
4. DETERMINISTIC HIGH PRIORITY LOADS
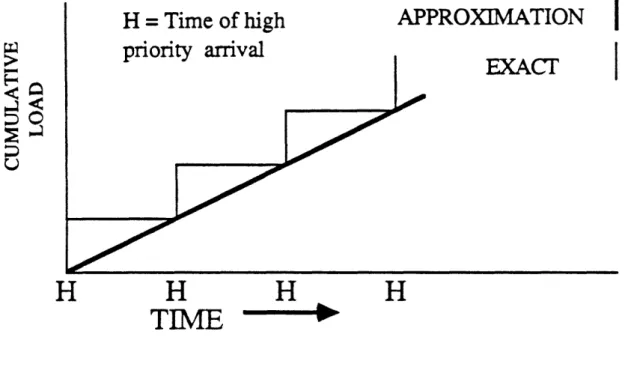
Of particular interest is the case where the high priority tasks are deterministic, i.e. where o12 = 0. This important case may be treated in a simple intuitive way which sheds light on the distributed Poisson approximation of §3 and provides a simple
rederivation of the more general result We observe that when the high priority tasks all have the same service time T1, a sample path of the cumulative high priority load is a
deterministic staircase function whose time average is a straight line with growth rate equal to pl1/A as illustrated in Figure 4.1.
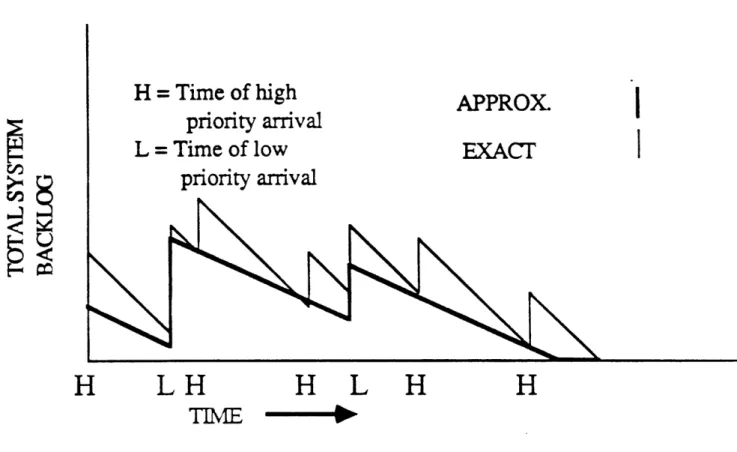
The staircase input is approximated by a high arrival rate of short loads. In the limit the cumulative high priority load would be a straight line with constant growth rate 1g/A as illustrated in Figure 4.2. For this approximation the system backlog process, designated by BA(t) and illustrated in Figure 4.3, has the compound Poisson input of the low priority customers arriving with service time T2 at rate 2 and worked off at rate v =
1 - 1l/A. This approximating backlog process BA(t) would be identical in structure with
the backlog process of the M/G/I queue if the work-off rate v were 1. If time were sped
up by a factor (l/v), the new Poisson arrival rate would be X2# = X2 (1 - 1/A) -1, the
low priority load would still be T2 and the ergodic distribution of BA(t), would be
unchanged since ergodic distributions are independent of time scale. The ergodic distribution is therefore described by the Pollaczek - Khinchine transform
(4.1) E[ exp (- BA () ] -- P2
1 - a2(w) 1 - P2# 1
-oEFT23 where P2# = 2#T 2 = %2T2(1 - 91/A) 1= P2 (1-Pl)' 1.
The mean backlog is therefore given by
P; # £P~[T] 22
EIBA
() ]-2(1 -
2#)
"T-which simplifies to (4.2) E[BA () ] =2 - p
T] 2(1- s)where P2 = X2E[T2] and PS -= 2 E[T2]+ L /A.
Note that PS = X2E[T2]+ D1 /A < 1 corresponds to the stability condition P2# < 1.
When a low priority task arrives at time t and finds a backlog y, it experiences a delay y divided by the work-off rate v. Hence WA(), the ergodic waiting time distribution of the low priority tasks, is given by WA(o) = BA(oo)/v and has transform
E[exp(-WA()C0/v]. The time to completion is given by WA(b) + E[T2]/ v and has
transform
E[exp(- (BA(O) + T2)0/v )] and a mean of
(4.3) U2 = ( E[BA() ] + E[T2] )v-1.
Note that (4.2) and (4.3) simplify to (3.1) for the case a12= 0.
This more intuitive argument does not extend to the non-deterministic case. If, for example, the premptive load at clock ticks were itself compound Poisson, the preemptive load process replacing it in our approximation would be a compound Poisson process with random jumps at its Poisson epochs. The full apparatus of [KS 1] is then needed. 5. ERROR BOUNDS FOR THE BACKLOG PROCESS
Upper and lower bounds are provided for the discrepancy between the backlog BRk(t) for the real clocked schedule and that for the approximation BA(t) to the clocked schedule.The following two thereoms summarize the analysis given in the appendix of this paper. The thereoms provide stochastic upper and lower bounds for the error Dk(cO,') for random clocked loads, and provide a sample path bound as well as a time -averaged error bound for deterministic clocked loads.
THEOREM 2. Let Do(O-) = 0 and let Tlk be the i.i.d. random loads. Then one has (5.1) A <st Dk(r) <St T1, E [ 0, A ), k = 0,1,....
where <st refers to a stochastic inequality.
Proof: Using an induction argument with Prop. A.5 and Prop. A.6 one can show that -A < Dk(o,0-)< 0 for k = 0,1,2.... Hence, from (A. 10) and Prop. A.6, (5.1) follows,
THEOREM 3: Let Do(O-) = 0 and let Tlk be deterministic and independent of k with Tlk = T< A. Then one has
(5.2) T12/A -T l /A < Dk(O),')< T1 -TT 1/A, E[O, A),k=
0,1,... and
T12/A - .5 T1 < (1/A) 0A Dk(c, ) d <.5T1, k = 0,1,....
Proof: Using an induction argument with Prop. A.5 and Prop. A.7 one can show that T12/A - T1 Dk(Co,O-) for k = 0,1,2.... Hence, from Prop. A.7 and Prop. A.8,
equation (5.2) follows. Equation (5.3) follows immediately from (5.2)
Remark: Note that (5.3) implies that the error range is T1( 1 - T1 / A) which approaches
zero as the clocked load, T1, approaches zero and as the high prioirty utilization, T1 /A,
approaches 1. Note also that (5.3) shows that the bounds of the average error are A
asymmetric with respect to A
of (I/A) JBAk(CO,') dt then
(1/A)J Dk(O,r) dr and if.5T12/A were added to the value
the error bounds would be symmetric.
6. ACCURACY OF THE COMPLETION TIME DISTRIBUTION
If an ordinary customer arrives to find a system backlog level BR(o) then the expected value of the completion time, E[U2] will equal the E[BR(b)] plus the expected
value of the priority load that arrives during U2 . The number of clocked loads that arrive
during U2 is between U2/A - 1 and U2/A+ 1. The average load of each clocked load is
E[T1].
Hence,
E[BR()] +(E[U2]/A - 1) E[T1] < E[U2] E[BR(o)] +( E[U2]/A+ 1) E[T1]
Therefore, (5.3)
(6.1) ( EBR()] - E[T1]) / ( 1- P ) E[U2] 5 (EIBR()] + E[T1] ) / ( 1 - P )
where Pi = E[T1] /A.
(Note that (6.1) corresponds to the formula
(6.2) E[U2 = EBR(-)] / ( 1- Pi )
which holds if the the high priority load is instead Poisson distributed[KS 1].) If the priority load is random then, from (5.1)
(6.3) E[BA(e)] - A < E[BR(o)] < E[BA(°o)] + E[T 1 ].
Hence, from (6.1) and (6.3),
E[BA(00)] - A -E[T 1 - P1
E[U2] < E[BA()] 1 -One can show [KS1] that (3.1) implies that
(6.4) E[U2A] = E[BA(c)] + E[T 2] 1 -P
The error incurred is then
A + E[T]+ E[T2]
1
-P 1< E[U2] - E[U2A] < 2E[T1] - E[T2] 1 - P1
and the relative error incurred'is
(6.6) - A + E[TI] + E[T2] E[BA(o)] - (A+ E[T1])
2E[T1] - E[T2]
E[BA()] - (A+ E[TI])
provided E[BA(o)] > A + E[T1].
From (3.1) and (6.4) + 2E[T 1] P1 (6.5) -< E[U EIU2A]
(6.7) EBA 12/D + ,2E[T22]
(6.7) E[^A(c)] 2
2(1-pl-p2) so, from (6.6) and (6.7)
(6.8) - A+E[T,]+E[T 2] (1-Pl-P2)
.5a12/A+.5X2E[T22 -(A+E[TI])(1-pl-P2)
E[U-E[U2A] 2E[T1]-E[T2
E[U2] < .5a12/A+.5)%2E[T22]-(A+E T1])(l-p-PlP2)
Note that as the system load p1+ p2 aproaches 1 the error approaches zero. 7. THE TAIL DISTRIBUTION
As a special case of Kingman's heavy traffic theorem [K4] , one sees that for any M/G1 system with finite E[T2], the ergodic waiting time WOO is such that
P[WJE[Wo] > x] converges to e-x when the traffic intensity p goes to 1.
For an M/G/1 system, the virtual FIFO waiting time at ergodicity and the ergodic backlog coincide. For the distributed Poisson approximation the ordinary customers with FIFO discipline have Poisson arrivals and have an effective servcie time Teff induced by the interruptions at Poisson epochs of the preempting tasks. For this effective time one has
[K3] E[exp(-sTeff) ] = aT( s + - XaI(s).). Kingman's theorem is thereby seen to be
directly applicable to the waiting time at ergodicity of the ordinary customers under the distributed Poisson approximation. The accuracy of the distributed Poisson approximation inferred from the error bounds, then implies that when ps is near one, say larger than .75, the ergodic FIFO waiting time distribution of the ordinary customers will be exponentially distributed to good approximation. The completion time is the waiting time plus the effective service time induced by the interruptions.
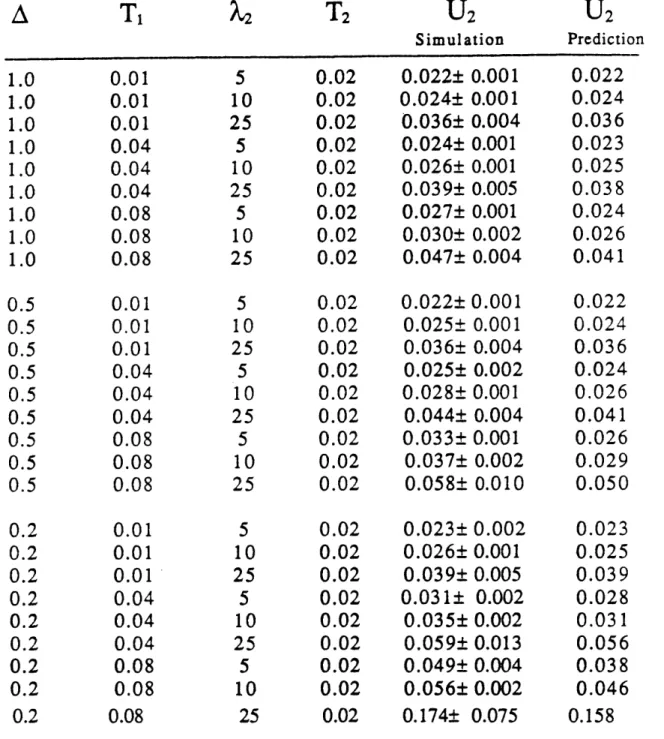
Tables 8.1, 8.2 and 8.3 summarizes some computer simulations that illustrate the accuracy of equation (3.1). In Table 8.1 and Table 8.2 the high priority load, T1, is
deterministic and the low priority load, T2, is Erlang-2. In Table 8.3, T1 is
exponential and T2, is Erlang-2.The tables list simulated values of U2 along with 98%
confidence interval In the examples the high priority utilization is between 1% and 40% and the low priority utilization is between 10% and 20%. In Table 8.1 all of the predictions are within the confidence interval of the simulations. The examples in Table 8.2 are identical to those of Table 8.1 except that the clock intervals, A, are increased by a factor of 10 times and the clocked load, T1, are decreased by a factor of 10. Although
the accuracy of the predictions is less with this change one might note that the predicted value minus the simulated value is always between 0 and .1T1. The examples in Table
8.3 are identical to those of Table 8.2 except that the clock load is exponentially distributed. Here, all of the predictions are within the confidence interval of the simulations.
9. DISCUSSION
In this paper, motivated by de Finitti's Theorem, an approximation to a clock schedule with preemptive resume infinitely divisible loads was introduced and using computer simulations was shown to be accurate. The key assumption was to replace a periodic infinitely divisible high priority load by a sequence of Poisson compound processes. This permited previous analysis of preemptive resume Poisson systems to be used. Acknowledgment: The authors wish to thank T. Tedijanto for using the University of Maryland version of PAWS [M1] to create computer simulations necessary for Tables 8.1, 8.2 and 8.3. This paper is dedicated to Amelia T. Servi.
REFERENCES:
[Al] Ackroyd, M. H., " Numerical Computation of Delays in Clocked Schedules", AT&T Technical Journal, Vol. 64, No. 2, 1985, pp.617-631.
[A2] Ackroyd,, M. H., "Stationary and Cyclostationary Finite Buffer Behaviour Computation via Levinson's Method," AT&T Bell Lab. Tech. J., Vol. 63, No. 10, (December, 1984), pp. 2159-2170.
[D] Doshi, B. T., "Analysis of Clocked Schedules -Technical Journal, Vol. 64, No. 2, 1985, pp. 633-660.
[F] Feller, W., "An Introduction to Probability Theory John Wiley and Sons, New York, 1971.
High Priority Tasks", AT&T
and Its Applications", Vol. 2,
[F1] Fredericks, A. A., "Analysis and Design of Processor Schedules for Real Time Applications", Applied Probability - Computer Science Interface, Vol. 1, 1981, Boca Raton, Florida, pp. 433-451.
[F2] Fredericks, A. A., and B. L. Farrell, and D. F. DeMaio, "Approximate Analysis of a Generalized Clocked Schedule", AT&T Technical Journal , Vol. 64, No. 2, 1985, pp. 597-615.
[F3] Fredericks, A. A., " A Class of Approximations for the Waiting Time Distribution in a G/G/I Queueing Syste, " B. S. T. J., Vol. 61, No. 3, (March, 1982), pp. 295-325.
[K1] Keilson, J. and U. Sumita, "Evaluation of the Total Time in System in a Preempt/ Resume Priority Queue via a Modified Lindley Process, Advances in Applied Probabilit,
Vol. 15, pp. 840-859 (1983).
[K2] Keilson, J. and L. D. Servi, "Dynamics of the M/G/1 Queue", to appear in Operations Research, (1987).
[K3] Keilson, J."Queues Subject to Service Interruption", Annuals of Math. Statis., Vol. 33, No. 4, December, 1962, pp. 1314-1322.
[K4] Kingman, J. F. C., " The Heavy Traffic Approximation in the Theory of Queues", Proceedings of the Symposium on Congestion Theory, ed. W. L. Smith and W. E. Wilkinson, 1965, University of North Carolina Press, pp. 137-169.
[M1] Melamed, B. "The Performance Analysis Workstation (PAWS 2.0) User Guide and Refernce Manual," UNIX System Toolchest documentation, 1986.
[01] Ott, T., "Simple Inequalities for the D/G/1 Queue", unpublished.
[02] Ott, T., "The Single Server Queue with Independent GI/G and M/G Input Streams", unpublished.
[03] Ott, T. "On the Single Server Queue with Independent GI/G and D/G Input Streams", unpublished.
[04] Ott, T, " On the M/G/1 Queue with Additional Inputs", J. Appl. Prob., Vol. 21, 1984, pp. 129-142.
[S1] Sahin, I. "Equilibrium Behavior of a Stochastic System with Secondary Input", J. Appl. Prob., Vol. 8, 1971, pp. 252-260.
[S2] Sahin, I. and U. N. Bhat, "A Stochastic System with Scheduled Secondary Inputs," Operations Research, Vol 19, 1971, pp. 436-446.
[S3] Steutel, F. W., "A Class of Infinitely Divisible Distributions", Ann. Math. Statis. Vol. 39, 1968, pp. 1153-1157.
TA
2
T
2
U
2
U
2
Simulation Prediction 0.1 0.001 5 0.02 0.022±.003 0.0220.1
0.001
10
0.02
0.024±.003
0.024
0.1
0.001
25
0.02
0.036+.009
0.036
0.1
0.004
5
0.02
0.023±.003
0.023
0.1
0.004
10
0.02
0.025±.003
0.025
0.1
0.004
25
0.02
0.037±.006
0.038
0.1
0.008
5
0.02
0.024±.003
0.024
0.1
0.008
10
0.02
0.026±.003
0.026
0.1
0.008
25
0.02
0.043±.009
0.041
0.05
0.001
5
0.02
0.022+.003
0.022
0.05
0.001
10
0.02
0.025+.003
0.024
0.05
0.001
25
0.02
0.037±.006
0.036
0.05
0.004
5
0.02
0.024±.003
0.024
0.05
0.004
10
0.02
0.026±.003
0.026
0.05
0.004
25
0.02
0.041±.006
0.041
0.05
0.008
5
0.02
0.026±.003
0.026
0.05
0.008
10
0.02
0.030±.003
0.029
0.05
0.008
25
0.02
0.051+.012
0.050
0.02
0.001
5
0.02
0.023+.003
0.023
0.02
0.001
10
0.02
0.025±.003
0.025
0.02
0.001
25
0.02
0.040±.009
0.039
0.02
0.004
5
0.02
0.028±.003
0.028
0.02
0.004
10
0.02
0.031+.003
0.031
0.02
0.004
25
0.02
0.059±.018
0.056
0.02
0.008
5
0.02
0.038±.003
0.038
0.02
0.008
10
0.02
0.045±.003
0.046
0.02
0.008
25
0.02
0.150±.090
0.156
TABLE 8.1 - COMPARISONS OF ANALYSIS WITH SIMULATION TI: deterministic; T2 Erlang-2
U
2
Simulation0.022± 0.001
0.024± 0.001
0.036± 0.004
0.024± 0.001
0.026± 0.001
0.039± 0.005
0.027+ 0.001
0.030± 0.002
0.047± 0.004
0.022± 0.001
0.025± 0.001
0.036± 0.004
0.025± 0.002
0.028± 0.001
0.044± 0.004
0.033+ 0.001
0.037± 0.002
0.058± 0.010
0.023± 0.002
0.026+ 0.001
0.039± 0.005
0.031± 0.002
0.035± 0.002
0.059± 0.013
0.049± 0.004
0.056± 0.002
0.174± 0.075
TABLE 8.2 - COMPARISONS OF ANALYSIS WITH SIMULATION TI: deterministic; T2: Erlang-2
A
T
1
1.0
1.0
1.0
1.0
1.0
1.0
1.0
1.0
1.0
0.01
0.01
0.01
0.04
0.04
0.04
0.08
0.08
0.08
0.5
0.5
0.5
0.5
0.5
0.5
0.5
0.5
0.5
0.01
0.01
0.01
0.04
0.04
0.04
0.08
0.08
0.08
5
10
25
5
10
25
5
10
25
5
10
25
5
10
25
5
10
25
5
10
25
5
10
25
5
10
25
0.02
0.02
0.02
0.02
0.02
0.02
0.02
0.02
0.02
0.02
0.02
0.02
0.02
0.02
0.02
0.02
0.02
0.02
0.02
0.02
0.02
0.02
0.02
0.02
0.02
0.02
0.02
U
2
Prediction0.022
0.024
0.036
0.023
0.025
0.038
0.024
0.026
0.041
0.022
0.024
0.036
0.024
0.026
0.041
0.026
0.029
0.050
0.023
0.025
0.039
0.028
0.031
0.056
0.038
0.046
0.158
0.2
0.2
0.2
0.2
0.2
0.2
0.2
0.2
0.2
0.01
0.01
0.01
0.04
0.04
0.04
0.08
0.08
0.08
__U
2
Simulation0.022±
0.024±
0.036±
0.024±
0.027±
0.040±
0.031±
0.033±
0.054±
0.022±
0.025±
0.036±
0.027±
0.030±
0.047±
0.040±
0.044±
0.079±
0.024±
0.026±
0.039±
0.036±
0.041±
0.077±
0.092±
0.118±
0.401±
0.001
0001
0.003
0.002
0.002
0.007
0.003
0.004
0.010
0.001
0.002
0.003
0.002
0.002
0.007
0.006
0.007
0.025
0.001
0.001
0.006
0.003
0.003
0.016
0.014
0.027
0.444
U
2
Prediction0.022
0.024
0.036
0.024
0.026
0.040
0.028
0.031
0.049
0.022
0.025
0.037
0.026
0.029
0.045
0.037
0.041
0.073
0.023
0.026
0.039
0.035
0.040
0.073
0.092
0.112
0.425
TABLE 8.3 - COMPARISONS OF ANALYSIS WITH SIMULATION TI: exponential; T2 Erlang-2
A
1.0
1.0
1.0
1.0
1.0
1.0
1.0
1.0
1.0
0.01
0.01
0.01
0.04
0.04
0.04
0.08
0.08
0.08
0.5
0.5
0.5
0.5
0.5
0.5
0.5
0.5
0.5
T
2
0.02
0.02
0.02
0.02
0.02
0.02
0.02
0.02
0.02
0.02
0.02
0.02
0.02
0.02
0.02
0.02
0.02
0.02
0.02
0.02
0.02
0.02
0.02
0.02
0.02
0.02
0.02
0.01
0.01
0.01
0.04
0.04
0.04
0.08
0.08
0.08
5
10
25
5
10
25
5
10
25
5
10
25
5
10
25
5
10
25
5
10
25
5
10
25
5
10
25
0.2
0.2
0.2
0.2
0.2
0.2
0.2
0.2
0.2
0.01
0.01
0.01
0.04
0.04
0.04
0.08
0.08
0.08
r ~
H = Time of high
H
H
H
H
TIME
e
FIGURE 4.1: CUMULATIVE LOAD VS. TIME
FOR THE EXACT SYSTEM AND THE DISTRIBUTED POISSON
APPROXIMATION SYSTEM
.
I
H = Time of high
priority arrival
L = Time of low
priority arrival
APPROX
I
EXACr
I
H
LH
H L
H
H
TIME - aFIGURE 4.2: TOTAL SYSTEM BACKLOG VS. TIME
FOR THE EXACT SYSTEM AND THE DISTRIBUTED POISSON
APPROXIMATION SYSTEM
cQ
APPENDIX
Proof of THEOREM 3.1: From [KS1] Laplace transform of the ergodic time in
system for the lower priority traffic is
(A. 1) U2 (s) =lim No°a{
IPKSN
(S + AN - AN BN(S)) a2 (s + AAN -AN aBN(S))}.Here:
a) OBN(S) =E[exp(-sTBN)] where TBN is the busy period of an M/G/1 queue with arrival rate
AAN
and service time transform aAN(s);b) OPKSN(S) = E[exp(-sWsN)] where WSN is the ergodic waiting time of an
M/G/1 queue with arrival rate kSN = AN + X2and service time transform
(A.2) aSN(S) = (XANaAN(S) + 2aC2(s) )/XSN
From the Takacs equation,
(A.3) CBN(S) = AN( S + AN - AN aBN(S) )
so that E[TBN] = E[TAN] / (1 - AN E[TAN] ). One then has from (2.4),
(A.4) limN- XAN E[TBN] = iANE[TAN]
- XANE[TANI
P1
1 -P1
where p is defined in (3.4).
By definition, PKSN(S) satisfies the Pollaczek - Khinchine formula,
(A.5) OPKSN(S) 1 - PSN
1 - PSN SETSN] sE[TSN1 where
which is defined in (3.5).
From (A. 1) and (A.5) the average time to completion for the lower priority traffic is
(A.7) U2 = lim N--* (E[WSN] + E[T21 ) /( 1 - Pl )
where, from (2.1), (2.2) and (A.2)
(A.8) E[TSN2] = (C
12 /A + X2E[T22] + 2/NA ) / XSN.
Since, from (A.5),
(A.9) lim N E[WPKSN] = lim N 2( PS)
one has (3.1) using equations (A.7), A.8) and (A.9). The variance of the time to completion of the ordinary customers , (3.2) is found by straightforward but lengthy calculations. ·
Prop. A.1: If Dk(co, t0) < 0, for some r0e [0, A), then Dk(CO,) < 0 in [, A).
Proof: From (2.9) that Dk(co,t) is continuous in [0, A). Hence Dk(co,t) can become positive at a time n* in [O, A) only if Dk(co,t) is increasing at '* and Dk(co,*) = 0. Note
also that : -WAk(co,t) is a non-increasing function of time and is a point of strict increase for IRk(,t) - IAk(co,T) only if IRk(ox') is increasing and IAk(Co),) is not increasing, i.e.only if BRk(Co,t) = 0 and BAk(co,t) > 0. Hence, from (2.9), is a point of strict increase for Dk(Co,') only if Dk(Co,) = BRk(Co,t) - BAk(co,t) < 0. From this it follows that Dk(o,) will remain non-positive in [0, A). *
Note that Prop. A. 1 implies that the process Bk(co,t) is absorbing in the set (bR , bA): bR - bA 0) .
Prop A.2: If Dk(Co,T) > 0 and 't0• A for k = 0,1,... then D(c,'t) is non-increasing at
T=to.
Proof: If Dk(o,0ro) = BRk(CO,O) - BAk(co,'O) > 0 then BRk(o,SO) 0. Therefore
IRk(o,t) is not increasing at Z= Z. Note also that -IAk(Co,Z) - WAk(Co,) cannot be an increasing function of time at ' = o0 .Therefore, from (2.9), Dk(o,Z) is non-increasing at
Prop A.3: Every sample path BAk(co,t) with common WAk(o,'t) and WXk(o,'t) is monotonically non-decreasing in BAk(O,Ot0) for all e [ 0, A).
Proof: Let two such sample paths be labeled BAkj(,t) and BAk2(c,'r). From (2.5),
BAkl(o,'t) - BAk2(c0,t) is a continuous function. Furthermore, if for some t',
BAkl(c,'t) - BAk2(Co,t') then either both sample paths are zero at ' - tr' or both are strictly positive at X = ''. In either case d/dt ( IAk, (C,T)) = d/dt ( IA2(co,') at t = t'.
Therefore, from (2.5), d/dt (BAkl(o,',) - BAk2(co,t)) = 0 at ' = 't'. But if BAkl(co,'t) > BAk2(o,'t0 ) and BAkl(O,') < BAk2(cO,') then it must be true that, BAkl(co,t) =
BA2(C,) for some X = t' and BAkl(c,'t) - BAk2(o,t) is strictly decreasing at t = t'. But
from the above discussion we showed that this is impossible. ·
For simplicity the notation A(co,) u v will be employed to denote A(co,v) - A(co,u) for the remainder of the appendix.
Prop A.4: If Dk(c,'o) < 0 for some to e [ 0, A) then
(A.9) IRk(,) I O
V2
IAk( , ')1rO
v, v [ TO, A) .Proof: From Prop. A. 1, for all t e [ t0A), Dk(co,t) 0 , i.e, BRk(co,) < BAk(co,).
Therefore in the interval [t0, A) the cumulative duration that BRk(co,t) is zero cannot be
less than the cumulative duration that BAk(cO,t) is zero. Hence (A.9) follows. · Prop. A.5: If Dk(co,0) < 0 then
(A.10) Dk(C,) < Tlk(O) - WAk(o,'t), e [ 0, A)
and
(A. 11) Dk+l(oJ,0) = Dk(cO),) < 0
Proof: From Prop. A.1 there exists to < A such that
(A. 12) Dk(cO,t) > 0, for t e [ 0, to) and Dk(co,') < 0 for t e [t, A).
If Dk(co,) = BRk(o,t) - BAk(O,t) > 0 for t [0, To) then BRk(CO,'t) > BAk(Wo, ) for t E
[0,
TO).
Hence BAk(c,t) must be idle at least as long as BRk(o,t) is idle. Hence(A. 13) IRk(C, ') < IA(CO, ), [ T [0, 'O).
Dk(co,') Dk(c,O-)+ Tlk(o) - WAk(co,') < Tlk(co) - WAk(o,).
From (A.12) and (2.10) for
r
e [ 0, A), Dk(co,) <0 < Tlk(CO) -WAk(co,t). Therefore (A.10) follows. (A.11) follows from (A. 10) and (2.10).*Prop A.6: For k = 0,1,..., if -min (A, Tlk(c0)) Dk(c, 0-) then -min (A, Tlk(cO)) < Dk(c, ) for all T [0,A).
Proof: The proof contains three cases:
Case (i): Suppose Tlk(co) < A and Dk(o,0-) = -min (A, Tlk(Co)) = -Tlk(o): In this case Dk(w, 0) = Dk(co,0-) + Tlk(O) = 0 so from Prop. A.4,
(A. 15) IRk(Ct, ) - IAk( CD, ) 0, e [Oa)
But (2.9), (2.10) and (A.15) implies Dk(O, ) Dk(O, 0-) =
-min
(A, Tlk(co)) which implies the conclusion of Prop. A.6.Case (ii): Suppose Tlk(co) 2 A and Dk(o,O-) = -min (A, Tlk(o)) = -A:
In this case Dk(o,O-) = BRk(Co,0-) - BAk(CO,O-) = -A so BAk(to,0) > A. Because the
workoff rate of BAk(co,',) is -1, for all t e [0,A), BAk(co,r) will be non-negative, i.e, it
will not be idle. Hence,
(A. 16) IAk( to, ) = 0 £ [0).,
But from (2.9), (2.10), and (A.16), for ' e [0,A), Dk(co, ) > Dk(o, 0-) = -min (A, Tk(co)) which is the conclusion of Prop. A.6
Case (iii): Suppose Dk(,0-) >
-min
(A, Tlk()):Two sample paths will be constructed and compared: Suppose Dkl(co,O) = BRkl(co,O)
-BAkl(CO,0) = Tlk(Co) and Dk2(O,0) = BRk2(O,0) - BAk2(O,0) > Tlk(co) where
BAk1(Co,0) ŽBAk2(C), 0) and BRkl(Ci,O) = BRk2(c)o, 0) From Prop. A.3 for all
£
[0,A),BAkl(), Z) must be greater than BAk2(, t) and by construction, BRkl(o, ) =
BRk2(o,). Hence Dk2(co, ) Dkl(co,'). But from Case (i), Dkl(o, ) > -min (A, Tlk(Co)). Hence Dk2(o,
r)
-min (A, Tlk(CO)) which implies the conclusion of Prop. A.6.Prop A.7: Let Tlk be deterministic and independent of k with Tlk = T1< A and -TI(l
- T1/A) < Dk(c,O-). Then
(A.17) T12/A - T1 /A Dk(co,t), E [0, A)
Proof: The proof consists of two cases: (A.14)
Case (i): Suppose first that Dk(co,0-) = -Ti(1 - T1/A):
If Dk(Co,O-) = BRk(CO,0-) - BAk(C,O-) = -T(1 - T1/A) then BAk(,O-) T1(1 - T1/A) .
If Tlk is deterministic then the backlog of the approximating clock load is increasing at a rate of TA, i.e.,
(A.18) WAk(o), r) = TI/, x e [0, a)
and both Wk(co, x) and IAk(co, r) are, by definition non-negative. Therefore, from (2.5),
and (A.18), BAk(C,') T1(1 - T1/A) - (1 - T1/A) for all x e [0, T1) and so the
approximate system is not idle. Hence
(A.19) IA(CO, ) = 0, e £ [0, T1).
If the T1is deterministic then Tlk(co) = T1for all k and the backlog BRk(C,O-) > 0 and
both Wk(co, r) and IRk(C, 'r) are, by definition non-negative.Therefore, from (2.7), for z £ [0, T1), BRk(co, ) T1 - and so the real system is not idle. Hence,
(A.20) IR(CI), ' ) = 0, e [0, T1).
From (2.9), (A.18),(A.19), and (A.20) and the assumption Dk(c),O-) = -T1(1 - T1/A)
(A.21) Dk(c,Z) = T12/A - T1 /A,
From (A.21), Dk(co, T1) = O so Prop. A.4 implies
(A.22) [ IRk(Co,) - IAk(O, )] IT1 > 0,
From (2.9),
]IT1 T
e[ 0, T1].
E [T1 ,A)
for x e [ T1 , A), Dk(co, ) = Dk(co,Tl) + [ IR,(Co,-) - IAk(Co, ) - WA( , .)
which, from (A.18), (A.21), and (A.227) implies (A.17) for e [ T 1, A).
Case (ii) :Suppose instead that -T1(1 - T1/A) < Dk(co,0). Using the argument of Prop.
A.6, case (ii) the conclusion of this proposition follows
Prop. A.8: Let Dk(co,O-) < 0 and let Tlk be deterministic and independent of k with
Tlk = T< A. Then one has
Proof: If Tlk be deterministic then WAk(o,,t ) = , T1/A. Therefore (A.22) folows