HAL Id: hal-00317254
https://hal.archives-ouvertes.fr/hal-00317254
Submitted on 19 Mar 2004
HAL is a multi-disciplinary open access
archive for the deposit and dissemination of
sci-entific research documents, whether they are
pub-lished or not. The documents may come from
teaching and research institutions in France or
abroad, or from public or private research centers.
L’archive ouverte pluridisciplinaire HAL, est
destinée au dépôt et à la diffusion de documents
scientifiques de niveau recherche, publiés ou non,
émanant des établissements d’enseignement et de
recherche français ou étrangers, des laboratoires
publics ou privés.
Geomagnetic activity forcing of the Northern Annular
Mode via the stratosphere
D. R. Palamara, E. A. Bryant
To cite this version:
D. R. Palamara, E. A. Bryant. Geomagnetic activity forcing of the Northern Annular Mode via the
stratosphere. Annales Geophysicae, European Geosciences Union, 2004, 22 (3), pp.725-731.
�hal-00317254�
SRef-ID: 1432-0576/ag/2004-22-725 © European Geosciences Union 2004
Annales
Geophysicae
Geomagnetic activity forcing of the Northern Annular Mode via the
stratosphere
D. R. Palamara and E. A. Bryant
University of Wollongong, School of Geosciences, NSW 2522, Australia
Received: 1 May 2003 – Revised: 8 October 2003 – Accepted: 12 November 2003 – Published: 19 March 2004
Abstract. We consider various aspects of the link be-tween solar-modulated geomagnetic activity and the North-ern Annular Mode (NAM). Our results indicate that the geo-magnetic forcing of atmospheric circulation in the Northern Hemisphere is temporally and seasonally restricted, modu-lated by the Quasi-Biennial Oscillation (QBO), and reliant on stratosphere-troposphere coupling. When the data are restricted to January values after 1965, for years in which the January QBO is eastwards, the correlation coefficient between the geomagnetic AA index and the NAM is 0.85. These results can account for many of the enigmatic features of Northern Hemisphere circulation.
Key words. Meterology and atmospheric dynamics (general circulation, climatology)
1 Introduction
Changes in atmospheric circulation, as represented by the Northern Annular Mode (NAM), impact upon global climate. Despite the important role that the NAM and the closely as-sociated North Atlantic Oscillation (NAO) index play in re-cent climate change (Hurrell, 1996; Thompson et al., 2000) their forcing mechanisms and behaviour are not well under-stood (Perry, 2000). For example, it is not clear to what extent changes in the NAO are an accumulation of stochas-tic weather events (Stephenson et al., 2000), the product of ocean-atmosphere coupling (Marshall et al., 2001), or the re-sult of internal atmospheric dynamics, possibly originating in the stratosphere (Perlwitz and Graf, 1995). There are also a number of specific uncertainties about these atmospheric modes. Researchers note a period of uncharacteristically low values in the NAO and NAM indices between the 1950s and 1970s (Greatbatch, 2000), followed by a strong positive trend extending to the present day (Stephenson et al., 2000). Al-though Wunsch (1999) has described similar nonstationary
Correspondence to: D. R. Palamara
periods in a synthetic NAO index, one cannot exclude the possibility that the recent changes in these indices of atmo-spheric circulation are deterministic. The literature also ex-presses uncertainty about the origin of decadal variations ev-ident since the 1960s (Hurrell, 1995), the year-to-year win-ter persistence of anomalies (Stephenson et al., 2000), and the nature of interannual variations of the NAO (Feldstein, 2000).
There are a number of reasons to suspect that the afore-mentioned uncertainties can be explained in part by solar ac-tivity, as represented by geomagnetic activity. For example, geomagnetic activity also exhibits an uncharacteristic period of low values centred in the 1960s, and its power spectrum is dominated by decadal variations. The most compelling ev-idence that the recent changes in these atmospheric indices are related to solar-modulated geomagnetic activity is found in Bucha and Bucha (1998), who presented correlations link-ing the NAO to geomagnetic activity, and more recently, in Thejll et al. (2003), who also correlated geomagnetic activity to the North Atlantic Oscillation. However, many aspects of this relationship remain unexplored. These aspects re-late to the nature of this relationship at different time scales, especially the interannual level, as well as its temporal and seasonal characteristics, and its possible dependence on the phase of the Quasi-Biennial Oscillation (QBO). Correlations presented in other solar-climate studies are often strongly de-pendant on the phase of the QBO; Labitzke and van Loon (2000), for instance, noted that correlations between strato-spheric geopotential heights in the Arctic and the 11-year so-lar cycle are positive during the QBO west phase, negative during the QBO east phase, and nonexistent when the data are not separated according to the QBO phase. In this paper, we test the hypothesis that geomagnetic activity is a signifi-cant forcing mechanism behind recent changes in Northern Hemisphere atmospheric circulation changes and examine the aforementioned aspects of the relationship.
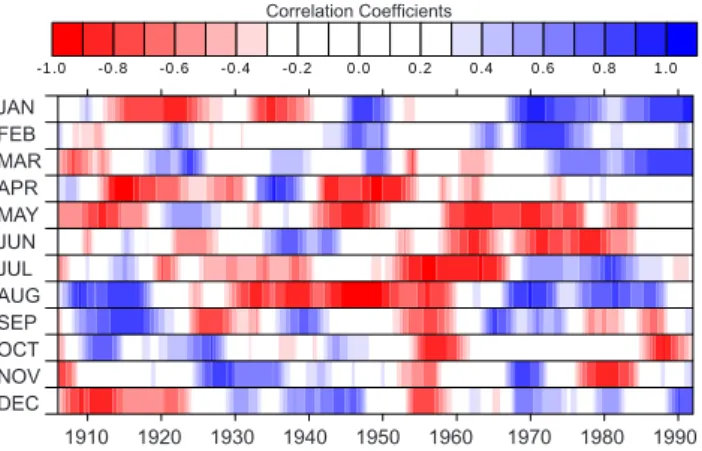
726 D. R. Palamara and E. A. Bryant: Geomagnetic activity forcing of the NAM via the stratosphere -1 .0 -0 .8 -0 .6 -0 .4 -0 .2 0 .0 0 .2 0 .4 0 .6 0 .8 1 .0 Correlation Coefficients JAN FEB MAR APR MAY JUN JUL AUG SEP OCT NOV DEC 1910 1920 1930 1940 1950 1960 1970 1980 1990
Fig. 1. Sliding correlations between the decadal variations of the geomagnetic AA and NAM indices. The decadal variations were extracted by applying an unweighted five-point moving average to the original data. The sliding correlation window width is 11 years, with a one-year increment. Correlation coefficients below 0.30 are unshaded. Note the period of consistently high, positive correla-tions for the January data, from approximately 1967 onwards. This indicates that the geomagnetic forcing of the Northern Hemisphere circulation is temporally and seasonally restricted.
2 Data and methods
Monthly values of the (NAM) are provided online by David Thompson at the Annular Modes website (http://www.atmos.
colostate.edu/ao/Data/ao index.html). The monthly NAM
indices used in our study span 1899 to 2000, and are the same as those used by Thompson and Wallace (2000) and Thompson et al. (2000). The NAM indices were derived, by their providers, from the regression of monthly anomaly fields on the leading principal component of sea level pres-sure data in the Northern Hemisphere. The geomagnetic AA index was obtained from the NOAA NGDC Solar Terrestrial Physics Division website (ftp://ftp/ngdc.gov/STP/SOLAR\ DATA/RELATED INDICES), and is available from 1868 to 1999. The AA index, which is measured in nanoTesla (nT), was devised by Mayaud (1972) and is based on geo-magnetic data from two antipodal stations, Hartland (Eng-land) and Canberra (Australia). Monthly zonal-mean zonal wind and zonal-mean temperature data were created by aver-aging the appropriate variables from the NCEP/NCAR Re-analysis data set (Kalnay et al. 1996), available from the NOAA-CIRES Climate Diagnostics Center website (http:
//www.cdc.noaa.gov/cdc/reanalysis). The zonal wind and
temperature data are available for 17 geopotential heights
ranging from 1000 hPa to 10 hPa, and 2.5◦intervals of
lat-itude and longlat-itude. The data for the QBO, which consist of equatorial 30 hPa zonal wind values, were obtained from the Joint Institute for the Study of the Atmosphere and Ocean (JISAO) website (http://tao.atmos.washington.edu/data sets/ qbo/) and are provided by Barbara Naujokat.
A five point unweighted moving average (i.e. with a half-width of two years) was used to facilitate the study of geo-magnetic activity forcing of the NAM at different time scales.
Decadal variations were isolated by applying the moving av-erage to the year-to-year variations for each month for both the NAM and AA indices. Short-term (two-to five-year) vari-ations were isolated by subtracting the smoothed data from the original indices. The use of the moving average resulted in the loss of the last two years of data. Therefore decadal and interannual versions of the AA and NAM indices only extend to 1997.
The results of Bucha and Bucha (1998) indicate that the re-lationship between the geomagnetic AA index and the NAO index, which is tantamount to the NAM index, is not con-stant over time. Therefore, the temporal nature of the rela-tionship between the AA and NAM indices has been exam-ined objectively for each month using sliding correlations for the decadal (smoothed) data and the cumulative sum of the squares of deviations for the interannual data. For the slid-ing correlations, 11-year windows were used so that at least one complete decadal cycle was covered, with one-year in-crements. The cumulative sums technique is demonstrated in Taylor et al. (2002), who developed it to extract a weak climatic signal from ecological data. It involves calculat-ing the sum of the squares of the differences between two normalised time series. The slope of the cumulative sums reflects the strength of the correlation; uncorrelated data re-sults in a slope of two, while strong positive correlations pro-duce a slope close to zero (Taylor et al., 2002). Although the cumulative sums technique is not widespread in climate research, or well-developed in the literature, it is used in this instance because the sliding correlations method is inappro-priate for the noisy interannual data. Sliding correlations performed on the interannual data (not shown) using both 11-year and 5-year windows yield highly variable, very low correlations that provide no information about the temporal aspect of possible correlations between geomagnetic activity and the NAM. The cumulative sums method is more dynamic because it is not necessary to specify a window width, and abrupt changes in the relationship between the two time se-ries are well represented by the slope of the cumulative sums line.
One of Pittock’s (1978) guidelines to solar-climate re-searchers emphasises the need to “critically examine the sta-tistical significance of the result, making proper allowance
for...autocorrelation and smoothing...”. Serial correlation
was taken into consideration when performing t -tests on cor-relation coefficients by replacing the actual number of
ob-servations with the effective number of obob-servations (Neff),
which was calculated as follows (from Slonosky et al., 2000):
Neff=N ×
(1 − r1r2)
(1 + r1r2)
,
where N is the total number of observations, and r1and r2
are the lag-one serial correlation coefficients of the two time
series under consideration. The use of Neffis especially
per-tinent to the correlations involving smoothed data, as the smoothing processes greatly increases serial correlation in the data.
1900 1920 1940 1960 1980 2000 0 50 100 150 200 250 300 Cumulative Sum
JAN (AA index, Arctic Oscillation)
Fig. 2. The cumulative sum of squares for differences between the January interannual geomagnetic AA and NAM indices. The stip-pled line has a slope of two and represents uncorrelated data. The intervals from 1940 to 1950 and from the early 1960s onwards have a small slope, indicating that interannual variations of the geomag-netic AA index are well correlated to the interannual variations of the NAM index for those intervals.
3 Results
The magnitude and sign of the sliding correlations (Fig. 1) are highly variable with time, indicating that the relationship between geomagnetic activity and the NAM is temporally in-consistent, and that for most months and decades there is no link between the two geophysical parameters. One interval that stands out, however, is the period of positive correla-tions between the decadal January AA and NAM indices, from 1967 onwards. This indicates that decadal variations in the winter NAM (and NAO), evident since the 1960s, are in-phase with decadal variations in geomagnetic activity. There is also a period of consistently high negative correlations be-tween the decadal August AA and NAM indices from 1930 to 1960. Since our aim is to examine the role of solar-forcing in recent, unexplained winter circulation changes, we do not discuss the results for the August data further. We note, how-ever, that the correlations for the August data between 1930 and 1960 are strong (r<−0.60) on all time scales, and there-fore, warrant future attention.
The cumulative sums, calculated for the interannual data, show a similar seasonal and temporal pattern as the sliding correlations. The results for January (Fig. 2), in particular, display intervals during which the interannual variations in the AA and NAM indices are correlated. The slope of the cumulative sums is shallow (and hence, the correlations are strong) between 1940 and 1950 and from the early 1960s onwards.
For the original (unmodified) January AA and NAM in-dices, the correlation coefficient between the two series from
1965 to 1997 is 0.62 (Neff=28), which is statistically
sig-nificant from zero at the 95% confidence level when Neff is used. Correlations for the interannual variations for the
same period (r=0.49; Neff=33) are also statistically
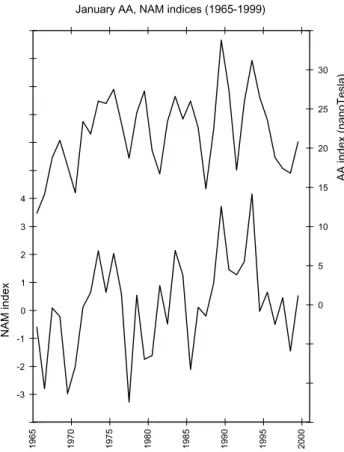
signif-January AA, NAM indices (1965-1999)
-3 -2 -1 0 1 2 3 4 1965 1970 1975 1980 1985 1990 1995 2000 NAM index 0 5 10 15 20 25 30 AA index (nanoTesla)
Fig. 3. The January geomagnetic AA index (top) and the January NAM index (bottom), from 1965–1999. The correlation coefficient between these two time series is 0.62, which is statistically signifi-cant at the 95% confidence level.
icant from zero at the 95% confidence level. The correla-tion coefficient for the 1965 to 1997 decadal data (r=0.82) does not yield statistically significant results due to the
lim-ited number of effective observations (Neff=5). This is a
re-sult of the smoothing process employed to extract the decadal variations, which has enhanced the already high serial lation in both the AA and NAM indices. The strong corre-spondence between the January AA and NAM indices, from the mid 1960s onwards, is shown in Fig. 3. Correlation coef-ficients for other months, even December and February, are considerably lower and do not achieve statistical significance on any time scale.
When describing links between the solar cycle and the lower atmosphere, much of the modern literature indicates that the QBO plays an important role, modulating solar-climate relationships based on the direction of the QBO winds (Labitzke and van Loon, 2000). It is not clear, how-ever, if geomagnetic forcing of the lower atmosphere is also contingent on the phase of the QBO, especially since the results so far have yielded statistically significant and rela-tively robust results without any consideration of the QBO. A strong improvement in the results was evident, however, when the January data were separated according to the phase
of the QBO (Fig. 4). When the QBO phase is easterly,
728 D. R. Palamara and E. A. Bryant: Geomagnetic activity forcing of the NAM via the stratosphere -5 -4 -3 -2 -1 0 1 2 3 4 5 10 15 20 25 30 35 AA index (nanoTesla) NAM Index
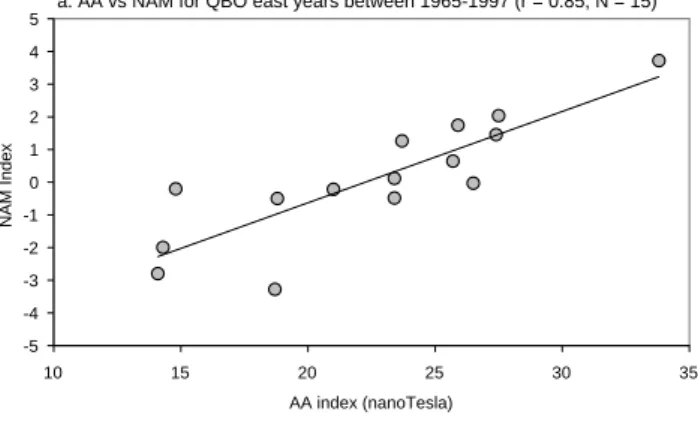
a. AA vs NAM for QBO east years between 1965-1997 (r = 0.85, N = 15)
-5 -4 -3 -2 -1 0 1 2 3 4 5 10 15 20 25 30 35 AA index (nanoTesla) NAM Index
b. AA vs NAM for QBO west years between 1965-1997 (r = 0.38, N = 18)
Fig. 4. Scatter plot of the January geomagnetic AA index and the January NAM index from 1965–1997 for (a) Januaries in which the QBO winds are easterly, and (b) Januaries in which the QBO winds are westerly. The correlation coefficient between these two time series for the QBO east years is 0.85, which is statistically signif-icant at the 95% confidence level. Conversely, the correlation for the QBO west years is only 0.38 and is not statistically significant at the 95% confidence level.
(r=0.85, N =15). This correlation is statistically significant from zero at the 95% confidence level, and the improvement in correlation magnitude over the unseparated data is not a function of the reduced sample size. This is evident because the original January AA and NAM indices for QBO west data are poorly correlated (r=0.38, N =18) and do not achieve statistical significance at the 95% confidence level. Incorpo-rating the QBO into analysis for other boreal winter months did not appreciably improve the magnitude of the correlation coefficients.
Our analyses so far have revealed that strong correlations between the geomagnetic AA index and the NAM only oc-cur in January, are restricted to periods after the early 1960s (though interannual variations show some correspondence between 1940 and 1950), and are strongest during the QBO east phase. We now examine the spatial signature of geomag-netic activity forcing on zonal-mean zonal wind and temper-ature data from 1965–1997. Correlations between the un-modified AA index and zonal-mean zonal wind data from the NCEP/NCAR reanalyses are shown for December and January in Figs. 5a and 5b. In all cases, N =33, requiring
an approximate correlation coefficient of 0.35 for a statisti-cal significance at the 95% confidence level. The effective number of observations is not considered because the data have not been smoothed and the zonal wind time series are not strongly serially correlated. These correlations include data for both phases of the QBO, and therefore, incorpo-rate all years from 1965 to 1997 in order to capture both the decadal and the interannual similarities between the AA and the NAM. When restricted to interannual data for the QBO east phase only, the signature of geomagnetic activity is generally the same but the January correlation coefficients are greater (not shown). The geomagnetic activity signature in the January zonal-mean zonal wind data matches that of the NAM. It is characterised by a broad area of positive
cor-relations between 45◦N and 65◦N, and an area of negative
correlations between 15◦N and 40◦N. Although these
corre-lations extend beyond the troposphere into the lower strato-sphere, statistically significant coefficients are limited to al-titudes below ∼20 km.
The dipole pattern of correlations in December, however, is strongest in the stratosphere and is statistically significant only above altitudes of ∼12 km. Christiansen (2002) indi-cated that zonal-mean zonal wind anomalies at a
geopoten-tial height of 10 hPa and a latitude of 60◦N influence the
phase of the Arctic Oscillation 30 days later. The correla-tions shown in Fig. 5a for December encompass this area, and suggest that zonal-mean zonal wind variations resulting from geomagnetic activity can influence the January zonal wind field. The correlation between the geomagnetic AA in-dex and the zonal-mean zonal wind at this particular point
(60◦N, 10 hPa) is 0.44. Correlations for other months (not
shown) do not show a pattern similar to the NAM signature in zonal-mean zonal wind, and generally lack statistically sig-nificant correlations. We note, however, that although the December geomagnetic activity has some influence on tro-pospheric circulation in January (as represented by the NAM index), geomagnetic activity in January still has a stronger influence. For instance, the correlation between the January
NAM index and the December AA index is 0.41 (Neff=31),
which is statistically significant at the 95% confidence level, and confirms that the impact of geomagnetic activity on De-cember circulation (Fig. 5a) is carrying forward to the fol-lowing Januaries, shown in Fig. 5b. However, the correlation between the January NAM and AA indices (presented ear-lier as r=0.49) is even stronger, indicating that geomagnetic activity in January has a greater influence on January circu-lation than the follow-on effect from December.
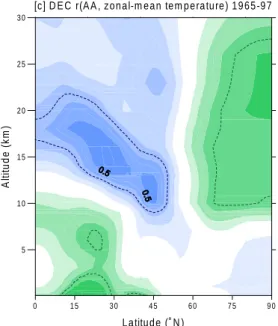
The zonal-mean zonal wind changes associated with geo-magnetic activity are accompanied by the zonal-mean tem-perature changes shown in Figs. 5c and 5d. In December, zonal-mean temperatures in the stratospheric polar night
re-gion (north of 60◦N and above 10 km) are negatively
corre-lated to the AA index. Many of the correlation coefficients in this area are statistically significant at the 95% confidence level. These correlations are matched by positive correlations
south of 60◦N, still above an altitude of 10 km. In January,
0 1 5 3 0 4 5 6 0 7 5 9 0 La titud e (˚ N ) [a ] D E C r(A A , zo na l-m ea n zon a l w in d ) 1 96 5 -9 7 5 1 0 1 5 2 0 2 5 3 0 A lti tu d e ( k m ) 0 1 5 3 0 4 5 6 0 7 5 9 0 L a titu d e (˚ N ) [b ] J A N r(A A , zo n a l-m e a n zo n a l w in d ) 1 9 6 5 -9 7 5 1 0 1 5 2 0 2 5 3 0 A lt it ude ( k m ) 0 1 5 3 0 4 5 6 0 7 5 9 0 L a titu d e (˚ N ) [c] D E C r(A A , zo n a l-m e a n te m p e ra tu re ) 1 9 6 5 -9 7 5 1 0 1 5 2 0 2 5 3 0 A lti tu d e ( k m ) 0 1 5 3 0 4 5 6 0 7 5 9 0 L a titu d e (˚ N ) [d ] JA N r(A A , zo n a l-m e a n te m p e ra tu re ) 1 9 6 5 -9 7 5 1 0 1 5 2 0 2 5 3 0 A lti tu d e ( k m ) -1 .0 -0 .9 -0 .8 -0 .7 -0 .6 -0 .5 -0 .4 -0 .3 -0 .2 -0 .1 0 .0 0 .1 0 .2 0 .3 0 .4 0 .5 0 .6 0 .7 0 .8 0 .9 1 .0 Correlation Coefficients
Fig. 5. Correlation coefficients between the geomagnetic AA index and (a) December zonal-mean zonal wind, (b) January zonal-mean zonal wind, (c) December zonal-mean temperature, (d) January zonal-mean temperature, from 1965–1997. The r=0.35 contour is indicated by a solid line, and represents the approximate threshold for statistical significance at the 95% confidence level. (a) and (b) show that the geomagnetic activity signal is restricted to the stratosphere in December, but is most pronounced in the troposphere during January. The strong similarity between the geomagnetic activity signature in the January zonal-mean zonal wind data and the corresponding NAM signature confirms the reality of the relationship. (c) and (d) show the corresponding geomagnetic activity signal in temperature data. In December, temperatures in the stratospheric polar region are inversely correlated to the geomagnetic AA index. By modifying the latitudinal temperature gradient of the lower stratosphere, geomagnetic activity is coupled to the troposphere. This is evident in the January correlations, which are strongest in the upper troposphere. It appears that although the impact of geomagnetic activity on the December stratosphere influences tropospheric circulation in January through stratosphere-troposphere coupling, geomagnetic activity in January also impacts strongly on January zonal wind and temperature, as demonstrated by the correlations presented in the text.
730 D. R. Palamara and E. A. Bryant: Geomagnetic activity forcing of the NAM via the stratosphere ones that are statistically significant, are found lower in the
northern atmosphere, below 10 km. This coincides with the spatial pattern of the maximum zonal-mean zonal wind cor-relations, and may reflect the downward propagation of geo-magnetic activity induced anomalies from the stratosphere to the troposphere.
4 Discussion
There is a marked change in the NAM at the beginning of the 1960s associated with the onset of external forcing (Feld-stein, 2002). By comparing the trend and variance of the winter NAM for the 1899–1967 period to that of the 1967– 1997 period, Feldstein (2002) concludes that the interannual variability for the earlier period is derived from climate noise (i.e. internal forcing), and the latter period is characterised by external forcing. Feldstein (2002) associates the external forcing with either hydrosphere/cryosphere coupling to the atmosphere or with a source external to the climate system, such as changes in stratospheric aerosol or ozone concentra-tion. We conclude that solar-modulated geomagnetic activity represents the external process that has forced part of the re-cent changes in the NAM and NAO.
Therefore, we attribute some of the winter trend in the NAM index to solar processes associated with geomagnetic activity, which also display an increasing trend since the mid 1960s. Similarly, the period of uncharacteristic low NAM values can be attributed to a concurrent low period in the AA index. The origin of the interannual variations in the NAM and NAO can also be explained in part by this rela-tionship, at least for winters in which the QBO winds are easterly. Our findings allow us to present an alternative hy-pothesis regarding the origin of the decadal variations evident in North Atlantic climate parameters since the 1960s. Tourre et al. (1999) described a quasi-decadal frequency in sea sur-face temperature and sea level pressure variability in the At-lantic Ocean with a frequency of around 11.4 years. They presented a figure showing that, in recent years, variations at this frequency only occur after 1960 (see their Fig. 1b), and indicated that it represents an extension of the North Atlantic Oscillation. Similarly, Venegas and Mysak (2000) note a change in sea ice concentrations and sea level pres-sures in the North Atlantic between 1950 and 1960. Decadal variations in both of these climatic parameters are evident from 1960 onwards, but are predominantly a winter phe-nomenon. Through the analysis of Northern Hemisphere 500 hPa geopotential heights, Knox et al. (1988) describe a climatic jump around 1962 that marks the abrupt beginning of a different climate regime. The strong correlations be-tween the January AA and NAM indices from 1965 onwards suggest that the onset of solar forcing of the Northern Hemi-sphere circulation may be the cause of this regime change and the source of the decadal variations in North Atlantic cli-mate.
We note that differences between our findings and those of Thejll et al. (2003), who deal with similar questions, are
largely due to different analytical techniques and overall, our findings can be used as confirmation of earlier findings, in-cluding theirs. Thejll et al. (2003), for example, used a much wider window (31 years compared to our 11 years) for their sliding correlations, and subsequently placed the onset of the geomagnetic forcing at the early 1970s compared to our esti-mate of the mid-1960s. We also note that our use of monthly indices, rather than the seasonal indices used by Thejll et al. (2003), has allowed us to restrict the geomagnetic forc-ing of the Northern Hemisphere in the lower atmosphere specifically to January, whereas they have described it as a winter phenomenon. Finally, we have separated annual and decadal variations in our analyses, allowing us to incorporate the QBO into our correlations, and argue against the point made in Thejll et al. (2003) that the correlation is “driven by variability on time scales of 7–10 years”, as we found strong correlations on interannual time scales when data cor-responding to QBO’s east years only were considered.
Our findings represent a solar-climate relationship that has practical, as well as statistical significance, evidenced by the importance of the NAM to Northern Hemisphere climate. The crucial question now relates to how solar/geomagnetic
activity is coupled to the lower atmosphere. For part of
this mechanism it is likely that geomagnetic activity in-fluences the meridional temperature gradient, and subse-quently the stratosphere zonal wind structure of the strato-sphere, which, in turn, impacts upon tropospheric circulation through a number of possible processes outlined in Shin-dell et al. (2001) and Baldwin and Dunkerton (2001). The seasonality of the relationship is a function of stratosphere-troposphere coupling, which only occurs during winter months.
Further research must consider how these stratospheric changes originate. Crucial to this endeavour is the elucida-tion of which physical processes in the atmosphere can be associated with geomagnetic activity. It is also important to explain the temporal pattern, as well as the role of the QBO in modulating the relationship.Therefore, we conclude that geomagnetic activity plays an important role in recent cli-mate change, but that the mechanism behind this relationship needs further clarification.
Acknowledgements. D. Palamara would like to thank A. Golab for her revisions of the manuscript and comments regarding the re-search. The authors also thank the individuals and organisations that provided the atmospheric and solar data used in this study, and two anonymous reviewers for their comments and insights.
Topical Editor O. Boucher thanks two referees for their help in evaluating this paper.
References
Baldwin, M. P. and Dunkerton, T. J.: Stratospheric harbingers of anomalous weather regimes, Science, 294, 581–584, 2001. Bucha, V. and Bucha, V.: Geomagnetic forcing of changes in
cli-mate and in the atmospheric circulation, J. Atmos. Solar-Terr. Phys., 60, 145–169, 1998.
Christiansen, B.: On the physical nature of the arctic oscillation, Geophys. Res. Lett., 29, 10.1029/2002GL015208, 2002. Feldstein, S. B.: The timescale, power spectra, and climate noise
properties of teleconnection patterns, J. Climate, 13, 4430–4440, 2000.
Feldstein, S. B.: The recent trend and variance increase of the an-nular mode, J. Climate, 15, 88–94, 2002.
Greatbatch, R. J.: The north atlantic oscillation, stochastic environ-mental research and risk assessment, 14, 213–242, 2000. Hurrell, J. W.: Decadal trends in the north atlantic oscillation:
re-gional temperatures and precipitation, Science, 269, 676–679, 1995.
Hurrell, J. W.: Influence of variations in extratropical wintertime teleconnections on northern hemisphere temperature, Geophys. Res. Lett., 23, 665–668, 1996.
Kalnay, E., Kanamitsu, M., Kistler, R., Collins, W., Deaven, D., Gandin, L., Iredell, M., Saha, S., White, G., Woollen, J., Zhu, Y., Chelliah, M., Ebisuzaki, W., Higgins, W., Janowiak, J., Mo, K. C., Repelewski, C., Wang, J., Leetmaa, A., Reynolds, R., Jenne, R., and Jospeh, D.: The NCEP/NCAR 40–year reanal-ysis project, Bulletin of the American Meteorological Society, 77, 437–471, 1996.
Knox, J. L., Higuchi, K., Shabbar, A., and Sargent, N. E.: Secular variation of northern hemisphere 50 kPa geopotential height, J. Climate, 1, 500–511, 1988.
Labitzke, K. and van Loon, H.: The QBO effect on the solar sig-nal in the global stratosphere in the winter of the northern hemi-sphere, J. Atmos. Solar-Terr. Phys., 62, 621–628, 2000. Marshall, J., Johnson, H., and Goodman, J.: A study of the
inter-action of the north atlantic oscillation with ocean circulation, J. Climate, 14, 1399–1421, 2001.
Mayaud, P.-N.: The aa indices: A 100-year series characterizing the magnetic activity, J. Geophys. Res., 77, 6870–6874, 1972. Perlwitz, J. and Graf, H.-F.: The statistical connection between tropospheric and strat ospheric circulation of the Northern
hemi-sphere in winter, J. of Climate, Vol. 8, No. 10, 2281–2295, 1995. Perry, A.: The north atlantic oscillation: An enigmatic see-saw,
Prog. P. Geo., 24, 289–294, 2000.
Pittock, A. B.: A critical look at long-term sun-weather relation-ships, Rev. Geophys. Sp. Phys., 16, 400–420, 1978.
Shindell, D. T., Schmidt, G. A., Miller, R. L., and Rind, D.: Northern hemisphere winter climate response to greenhouse gas, ozone, solar, and volcanic forcing, J. Geophys. Res., 106, 7193– 7210, 2001.
Slonosky, V. C., Jones, P. D., and Davies, T. D.: Variability of the surface atmospheric circulation over Europe 1774–1995, Int. J. Clim., 20, 1875–1897, 2000.
Stephenson, D. B., Pavan, V., and Bojariu, R.: Is the north atlantic oscillation a random walk?, Int. J. Clim., 20, 1–18, 2000. Taylor, A. H., Allen, J. I., and Clark, P. A.: Extraction of a weak
climatic signal by an ecosystem, Nature, 416, 629–632, 2002. Thejll, P., Christiansen, B., and Gleisner, H.: On correlations
between the north atlantic oscillation, geopotential heights, and geomagnetic activity, Geophys. Res. Lett., 30, 81–84 (doi:10.1029/2002GL016598), 2003.
Thompson, D. W. J., Wallace, J. M., and Hegerl, G. C.: Annular modes in the extratropical circulation, Part II: Trends, J. Climate, 13, 1018–1036, 2000.
Thompson, D. W. and Wallace, J. M.: Annular modes in the ex-tratropical circulation. Part I: Month-to-month variability, J. Cli-mate, 13, 1000–1016, 2000.
Tourre, Y. M., Rajagopalan, B., and Kushnir, Y.: Dominant patterns of climate variability in the atlantic ocean during the last 136 years, J. Climate, 12, 2285–2299, 1999.
Venegas, S. A. and Mysak, L. A.: Is there a dominant timescale of natural climate variability in the arctic? J. Climate, 13, 3412– 3434, 2000.
Wunsch, C.: The interpretation of short climate records, with com-ments on the north atlantic and southern oscillations, Bulletin of the American Meteorological Society, 80, 245–255, 1999.