Effect of Higher Stress Harmonics and Spectral
Width on Fatigue Damage of Marine Risers
The MIT Faculty has made this article openly available.
Please share
how this access benefits you. Your story matters.
Citation
Price, R., H. Zheng, Y. Modarres-Sadeghi, and M. S. Triantafyllou.
“Effect of Higher Stress Harmonics and Spectral Width on Fatigue
Damage of Marine Risers.” Proceedings of the ASME 2011
30th International Conference on Ocean, Offshore, and Arctic
Engineering, 19-24 June, 2011, Rotterdam, The Netherlands, ASME,
2011.
As Published
http://dx.doi.org/10.1115/OMAE2011-49728
Publisher
ASME International
Version
Final published version
Citable link
http://hdl.handle.net/1721.1/119894
Terms of Use
Article is made available in accordance with the publisher's
policy and may be subject to US copyright law. Please refer to the
publisher's site for terms of use.
Proceedings of the ASME 2011 30th International Conference on Ocean, Offshore, and Arctic Engineering
OMAE 2011 June 19-24, 2011, Rotterdam, The Netherlands
OMAE2011-49728
EFFECT OF HIGHER STRESS HARMONICS AND SPECTRAL WIDTH
ON FATIGUE DAMAGE OF MARINE RISERS
R. Pricea H. Zhenga
Y. Modarres-Sadeghib M.S. Triantafylloua
aDepartment of Mechanical Engineering, MIT, Cambridge, MA, USA b
Department of Mechanical and Industrial Engineering, University of Massachusetts, Amherst, MA, USA
ABSTRACT
Recently, experimental data from vortex induced vibrations (VIV) of long flexible cylinders have revealed the existence of (i) higher harmonic stress components, and (ii) chaotic response characteristics, in addition to the well-known first harmonic responses. To assess the effect of these phenomena on fatigue damage of long flexible structures, we generate alternative stress time series, with and then without higher harmonic components; as well as time series, which have either sharply peaked power spectral densities (PSD), or broad-banded PSDs, characteristic of chaotic response. We show that for stresses containing higher harmonics, the predicted fatigue damage to the riser can increase by a factor of 2.5 relative to the damage caused by stresses containing only the first harmonic and having equivalent total power. Likewise, for stresses with a significantly spread PSD, an indicator of chaotic response, the damage to the riser is increased by a factor of 1.8, relative to a stress with narrow-band PSD and the same total power. Thus, it is found that the increase in fatigue damage caused by chaotic response can be as significant as that caused by the stress higher harmonic components.
1. INTRODUCTION
The study of vortex-induced vibrations (VIV) and the resulting material fatigue is particularly important in design for ultra-deepwater oil exploration and development. Long cylindrical structures such as risers and mooring lines can be outfitted with VIV-cancellation systems or subjected to aggressive replacement schedules; however the cost of these measures can be high. Effective VIV and fatigue prediction programs offer the prospect of design and replacement schedule optimization.
Work to improve these methods by including various factors, which are not encompassed by current models, is
ongoing. Jauvtis and Williamson [1], Vandiver et al. [2], and Dahl et al. [3] have shown that both for rigid and flexible cylinders, the in-line oscillations cause drastic changes in the wake and the resulting fluid forces, including a significant 3rd and in some cases 5th harmonic components in the measured cross-flow fluid force signals and even-harmonics in the in-line force. The inclusion of the higher harmonic components of the stress in the fatigue analysis can increase the predicted damage by an order of magnitude [4].
Recently, it has been shown that in addition to the well-known statistically stationary regions, VIV signals of long flexible risers contain time intervals of chaotic response, followed or preceded by periods of statistically stationary response [5, 6]. We call the statistically stationary regions, mainly periodic, or Type-I signals and the regions with qualitatively chaotic characteristics (e.g., rather broad-banded PSD), Type-II signals. If a Type-II signal is approximated through an “equivalent” Type-I signal, as is often the case in semi-empirical methods, fatigue calculations seriously under-predict the fatigue damage [6].
Separately assessing the impact on fatigue damage caused by the inclusion of higher harmonic forces compared with that caused by a broad-banded PSD, indicative of chaotic response, cannot be done using the experimental data alone, because they usually exhibit both effects simultaneously. In this paper, we use statistical methods to generate alternative stress time series with systematically altered spectra. A detailed analysis of data from the Norwegian Deepwater Programme (NDP) High Mode VIV tests is performed to find representative values for these effects.
For a review of literature on the subject of VIV in rigid cylinders, the reader is referred to Sarpkaya [7] and Williamson and Govardhan [8]. Vandiver [9] gives a review of flexible cylinder studies.
Proceedings of the ASME 2011 30th International Conference on Ocean, Offshore and Arctic Engineering OMAE2011 June 19-24, 2011, Rotterdam, The Netherlands
2. BACKGROUND AND METHODS 2.1 NDP Experimental Data
The Norwegian Deepwater Programme (NDP) Riser High Mode VIV tests [10] consisted of tests on a 38 m riser with the characteristics shown in Table 1, kept under tension and towed horizontally at varying speeds in either uniform or sheared flow conditions. The tests were conducted both on a bare riser and either a partially or fully straked riser. Various strake configurations were tested, and the case we use here is the one in which 50% of the riser length was covered by 17.5D/0.25D pitch to height ratio strakes.
In the uniform flow cases, the flow velocity was varied from 0.3 to 2.2 m/s, in 0.1m/s increments. In the sheared flow cases, the flow velocity increased linearly from 0 at one end to a maximum velocity at the other; the same range of maximum velocities as for the uniform flow cases was selected. Measurements of the in-line strain were taken at 40 points along the riser, while measurements of the cross-flow strain were taken at 24 points. The data from the strain gauges will be referred to as the original data.
Table 1: NDP 38m Test Riser Properties
Riser Properties Length between pinned ends 38m
Outer Diameter 0.027m Wall Thickness 0.003m Young's Modulus 2.25x10⁹ N/m2 Bending Stiffness 37.2 Nm2 Mass/Unit Length (air filled) 0.761 kg/m Mass/Unit Length (water filled) 0.933 kg/m
Strake Properties
Outer Sleeve Diameter 0.032 m Pitch/Diameter 17.5 Height/Diameter 0.25 Weight in Water 2.79 N/m
Stress time series can be found using the strain data and Young's modulus given in Table 1.
2.2 Effect of Spectral Shape on Fatigue Damage To find the impact on fatigue of higher harmonics and chaotic, or Type-II behavior (widely-spread spectrum), it is necessary to generate alternative stress time series from systematically altered stress PSDs, which retain the same total power. The experimental data exhibit both higher harmonics and PSD spreading, while in simulation we are able to modify their spectrum so as to study separately the effect of each component. PSDs of the NDP experimental data were taken using MATLAB, then various parts of the spectrum were altered to suit each trial, as explained below.
First, we change the spectrum by lumping the power into individual peaks, as shown in Figure 1, which depicts the PSD of an example time series before and after this
modification was made. Figure 1(a) shows the original stress PSD of the signal, where the power is distributed around individual peaks. Figure 1(b) shows the revised PSD consisting of individual lumped harmonics; the power is preserved for each peak.
a) Unmodified: PSD as originally calculated
b) Modified: Each Harmonic Lumped to 1 Peak
Figure 1: Example Original and Modified Stress PSDs
2.3 Time Series Construction
Once the altered PSD has been selected, we construct time histories, which we use to calculate the fatigue damage. For a series with M frequency components the constructed stress signal is,
( ) ∑ ( ) (1) where fi, φi, and Ai are the modal frequencies, phases and stress
amplitudes, respectively. φi are randomly generated phase
angles while Ai is a given as
√𝑺 𝒅 (2) where Si is the value of the PSD at frequency fi separated from
fi+1 by a space of df hz. The modal frequencies are randomly
selected within narrow bands of width df, to avoid periodicity of the signal.
2.4 Fatigue Calculations Using Rainflow Algorithm The rainflow algorithm is an established way of applying Miner's Rule to complex time series. It was first proposed by Matsuishi and Endo [11]. We follow the procedure and programs used to calculate riser fatigue life by Mukundan et al [12].
2.5 Nomenclature
We present the results of the simulations in the form of the ratio of the damage caused by a signal with a certain PSD over the damage caused by a signal with a different PSD, both having the same total power. As an example, the damage caused by a PSD whose spectrum is spread, D1S3S5S, over the
damage caused by a sharply peaked spectrum, D1D3D5D, gives
the damage increase ratio:
𝒅 𝑺 𝑺 𝑺
𝒅
𝒅 (3)
We refer to this ratio as the damage increase factor (DIF). The subscripts in the damage D denote whether each harmonic is spread or not; an “S” indicates spread and a “D” indicates that the peak has been lumped into single harmonics.
Likewise, for trials studying the influence of the higher harmonics, the results are given in terms of damage increase factors. To calculate the contribution of the higher harmonics, the damage for a signal with higher harmonics was compared with the damage for a time signal with the same total power lumped at the first harmonic.
(4) 3. IMPORTANCE OF HIGHER HARMONICS
In this section we study the effect of omitting the higher harmonics and representing the response through single individual spectral peaks. We preserve the same total power in the signal; this is different that in previous studies, which simply omitted the effect of higher stress harmonics, for example.
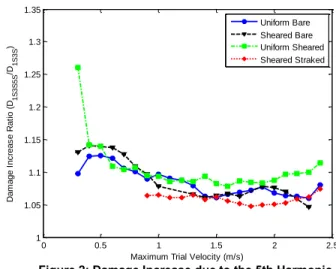
DIF5H denotes the damage increase factor when the
fifth harmonic is included relative to a signal without the fifth harmonic. It is defined as the ratio of the damage caused by the original signal (D1S3S5S) to the damage caused by the signal
excluding the fifth harmonic (D1S3S). It should be noted, again,
that both signals have the same total stress power; in the latter signal the power from the fifth harmonic was transferred to the first harmonic. Figure 2 shows a plot of DIF5H for the NDP
Data: The typical DIF value is around 1.1, implying that there is a 10% increase in the damage when the fifth harmonic is included.
Figure 2: Damage Increase due to the 5th Harmonic
Similarly, DIF3H is the damage increase factor when
the third harmonic is included relative to a signal that has no 3rd harmonic. It is defined as the ratio of the damage caused by the original signal (D1S3S5S) to the damage caused by the signal
without the third harmonic (D1S5S); once again, the signals have
the same amount of total stress power. Figure 3 shows a plot of DIF3H for the NDP data. In cases where there is a significant
third harmonic component, the typical values are between 1.2 and 1.4, suggesting a 20-40% increase in the damage when the third harmonic is included.
Figure 3: Damage Increase due to the 3rd Harmonic
Finally, DIFHH is the damage increase factor when
both the 3rd and the 5th harmonic components are included. It is the ratio of the damage caused by the original signal (D1S3S5S) to
the damage caused by the signal without the higher harmonics (D1S). Figure 4 shows a plot of DIFHH for the NDP data.
Typical values for cases with significant power in the higher harmonics are around 2, with some occasional values greater than 6. This suggests a minimum of 100% increase in the damage if the higher harmonics are not considered.
0 0.5 1 1.5 2 2.5 1 1.05 1.1 1.15 1.2 1.25 1.3 1.35
Maximum Trial Velocity (m/s)
D a m a g e I n c re a s e R a ti o ( D1 S 3 S 5 S /D1 S 3 S ) Uniform Bare Sheared Bare Uniform Sheared Sheared Straked 0 0.5 1 1.5 2 2.5 1 1.1 1.2 1.3 1.4 1.5 1.6 1.7
Maximum Trial Velocity (m/s)
D a m a g e I n c re a s e R a ti o ( D1 S 3 S 5 S /D 1 S 5 S ) Uniform Bare Sheared Bare Uniform Sheared Sheared Straked
Figure 4: Damage Increase from Omitting HH
The results confirm the importance of the higher harmonic components of the signal, showing that significant differences in the fatigue damage occur, even when the total stress power is held constant. Note that this comparison is not the same as in [4] where the difference was found to be an order of magnitude larger, at a minimum. This difference is merely the result of our methodology, where the total stress power was held constant, whereas in [4] the power of the higher harmonics was simply omitted.
4. POWER DISTRIBUTION AMONG STRESS HARMONICS
In the previous section we considered the effect of simply omitting the higher harmonics. In this section we consider the effect of changing the relative magnitude of the higher harmonics.
Figure 5 shows the total stress power for each of the NDP experimental data cases. Since the uniform bare case has much more power than the sheared straked case, the results are shown in both linear scale (a), and on a logarithmic scale (b).
To assess the significance of the third high harmonic, we define its power ratio as
(5)
where P3 is the power associated with the third harmonic and
PTotal is the total power in the signal. We use a similar definition
for the fifth harmonic.
b) Logarithmic Scale
Figure 5: Total Stress Power for NDP Experimental Data
Figure 6 shows the fraction of the total power at the first, third, and fifth harmonics. The uniform bare case contains about half of its power at the first harmonic, 40% at the third, and 10-20% at the fifth harmonic. Thus, it is expected that neglecting the third harmonic component will play an important role in determining the fatigue damage of this series while factors related to the fifth harmonic will be less important.
The uniform bare and sheared straked cases have about 80-85% of their power at the first harmonic and 15-20% at the third harmonic, with the fifth harmonic contributing less than 5% of the total stress power. Finally, the power distribution for the sheared straked case shows that it almost entirely concentrated at the first harmonic.
It is simple to explain why spreading the power to higher frequencies causes more damage. The stress power allocated to the higher frequency is associated with a larger number of cycles within the same life-time period, relative to the original signal; hence added power in the 3rd harmonic increases the corresponding damage by roughly a factor of 3, and likewise for the 5th harmonic.
0 0.5 1 1.5 2 2.5 1 2 3 4 5 6 7 8 9
Maximum Trial Velocity (m/s)
D a m a g e I n c re a s e R a ti o ( D1 S 3 S 5 S /D 1D ) Uniform Bare Sheared Bare Uniform Sheared Sheared Straked 0 0.5 1 1.5 2 2.5 0 1 2 3 4 5x 10 11 Maximum Velocity (m/s) T o ta l S tr e s s P o w e r (P a 2) Uniform Bare Sheared Bare Uniform Straked Sheared Straked 0 0.5 1 1.5 2 2.5 106 108 1010 1012 Maximum Velocity (m/s) T o ta l S tr e s s P o w e r (P a 2) a) Absolute Scale
First we compare the fatigue damage of a stress signal that has a single peak at the 1st harmonic with a stress signal that has two peaks, one at the first and another at the 3rd harmonic; both signals have the same total power. We derive a ratio DIF1D3D whose numerator is the damage caused by the
latter (D1D3D) and the denominator is the damage caused by the
former signal (Dsingle). The PSD of the numerator resembles a
delta function for positive frequencies, while the numerator PSD resembles two delta functions.
Figure 7 shows a plot of DIF1D3D for the NDP data. As
expected, the sheared straked case does not exhibit a significant change in fatigue life when the third harmonic is included. The uniform bare case shows the largest increase in fatigue damage, with a factor of about 2.1 while a factor of 1.8 is exhibited in the uniform straked and sheared bare cases.
Figure 7: Increase in Fatigue Damage due to Single-peak Third Harmonic
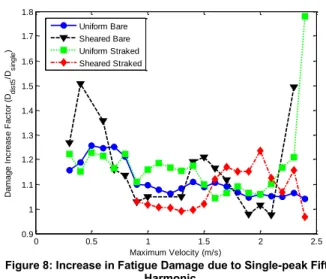
Similarly, we define DIF1D5D as the corresponding
damage increase factor for the fifth harmonic. The denominator
is the damage caused by a signal with only the first-harmonic
(Dsingle), while the numerator is the damage caused by a signal
with the first and fifth harmonic (D1D5D).
Figure 8 shows a plot of DIF1D5D for the NDP data. In
general, there is a minor average change in damage with the inclusion of the fifth harmonic. Comparison with the rightmost plot in Figure 6 confirms that the points where there are significant increases are points with significant fifth harmonic stress power. For instance, the fifth harmonic power of the uniform straked data increased for velocities greater that 2m/s, and DIF1D5D (shown in dotted green) increases accordingly.
Figure 8: Increase in Fatigue Damage due to Single-peak Fifth Harmonic
We conclude by studying the effect of including both the 3rd and 5th harmonics simultaneously. We define the ratio
DIF1D3D5D with its denominator equal to the damage caused by
a PSD with only one first-harmonic peak containing all of the power of the original signal (Dsingle), while the numerator is the
damage caused by a PSD with peaks at the first, third, and fifth harmonics. 0 0.5 1 1.5 2 2.5 0.8 1 1.2 1.4 1.6 1.8 2 2.2 2.4 2.6 Maximum Velocity (m/s) D a m a g e I n c re a s e F a c to r (D d is t3 /D s in g le ) Uniform Bare Sheared Bare Uniform Straked Sheared Straked 0 0.5 1 1.5 2 2.5 0.9 1 1.1 1.2 1.3 1.4 1.5 1.6 1.7 1.8 Maximum Velocity (m/s) D a m a g e I n c re a s e F a c to r (Dd is t5 /D s in g le ) Uniform Bare Sheared Bare Uniform Straked Sheared Straked 0 0.5 1 1.5 2 2.5 0 0.1 0.2 0.3 0.4 0.5 0.6 0.7 0.8 0.9 1 Maximum Velocity (m/s) F ra c ti o n o f T o ta l S tr e s s P o w e r (P 1 /P to ta l ) 1st Harmonic 0 0.5 1 1.5 2 2.5 0 0.1 0.2 0.3 0.4 0.5 0.6 0.7 0.8 0.9 1 Maximum Velocity (m/s) F ra c ti o n o f T o ta l S tr e s s P o w e r (P3 /Pto ta l ) 3rd Harmonic 0 0.5 1 1.5 2 2.5 0 0.1 0.2 0.3 0.4 0.5 0.6 0.7 0.8 0.9 1 Maximum Velocity (m/s) F ra c ti o n o f T o ta l S tr e s s P o w e r (P5 /Pto ta l ) 5th Harmonic
Uniform Bare Sheared Bare Uniform Straked Sheared Straked
Figure 9: Increase in Fatigue Damage due to Higher Harmonics
Figure 9 shows a plot of DIF1D3D5D for the NDP data.
The uniform bare data shows a damage increase ratio around 2.7, while the uniform straked data shows a ratio near 2.4. The sheared bare increase factor varies between 1.5 and 5.0. As anticipated, the sheared straked ratio is close to 1. In all cases except for the sheared straked data, neglecting the higher harmonics leads to at least a 60% under-prediction of the damage.
5. EFFECT OF CHAOTIC VIV RESPONSE ON FATIGUE DAMAGE
As observed in several experimental and field data, the power spectrum is not narrow-band but is spread out, as observed, for example, in Figure 1. In some cases this spreading is so pronounced that it is hard to find a specific peak at a frequency close to the Strouhal frequency, and the signal can be considered chaotic or of Type-II as described in [2] and [3].
In this section, we study the influence of the spectrum spread on fatigue damage calculation. To do this, we compare the damage caused by the original time series (with harmonics spread out as shown in Figure 1a) versus the damage caused by single peaks as in Figure 1b). We find that when a higher harmonic peak contains comparable power to the first harmonic, spreading has a much more pronounced effect.
To show the influence of the spectrum spreading at a particular harmonic, we calculate the damage increase factor
DIFX, defined, when X=1, as the ratio of the damage caused
when the first harmonic retains the original spread spectrum shape and the 3rd and 5th harmonics are lumped into sharp peaks, to the damage caused when all harmonics are lumped into a single peak. Similar definitions follow for X=3, and X=5. For instance, DIF1 is defined for the sequence with the case
shown in Figure 1 as the ratio of the damage caused by a time series made by combining the solid blue portion of Figure 1(a) with the dashed black and dotted green portions of Figure 1(b), to a time series made from the entire PSD shown in Figure 1(b).
Figure 10: Damage Increase Factors due to the First Harmonic Spreading
Figure 10 shows the damage increase factors, D1, of
the first harmonic for the NDP experimental data. For all cases, except the sheared straked case, there is an increase of about 50% associated with a spread first harmonic. For the sheared straked case, the increase is nearly 100%. The impact of the first harmonic spread is greatest for the sheared straked case, because it has the largest first harmonic.
Figure 11 shows the damage increase factor, D3,
associated with a spread third harmonic. Overall, the damage increase factors are larger for the third harmonic than for the first harmonic, except for the sheared straked case, for which there is little power at the higher harmonics. For the uniform bare case, the damage increase factor hovers around 3, while for the other cases it is near 2. Hence, the third harmonic spread can increase the damage by 100-200%. Figure 12 shows similar results for the fifth harmonic, with 20-40% increase in damage for the uniform bare case, and 0-20% increase for the other cases.
Finally, we calculate the total damage increase associated with all the harmonics being spread, simultaneously. This is the ratio of the damage caused by the full signal with all harmonics spread as shown in Figure 1(a), to the damage caused by a signal with sharp peaks in each harmonic, as shown in Figure 1(b).
Figure 13 shows a plot of the DIF values for the NDP experimental data. The damage increase associated with spreading is around 1.8. It can be seen that the damage increase for all of the harmonics together is lower than the total damage increase factors associated with changing just a single harmonic. This is due to destructive interference between the harmonics when all of the frequency components are included.
0 0.5 1 1.5 2 2.5 0.5 1 1.5 2 2.5 3 3.5 4 4.5 5 Maximum Velocity (m/s) D a m a g e I n c re a s e F a c to r (D d is t /D s in g le ) Uniform Bare Sheared Bare Uniform Straked Sheared Straked 0 0.5 1 1.5 2 2.5 1.3 1.4 1.5 1.6 1.7 1.8 1.9 2 2.1 Maximum Velocity (m/s) D a m a g e I n c re a s e F a c to r (D s p re a d /D s in g le ) Uniform Bare Sheared Bare Uniform Straked Sheared Straked
Figure 11: Damage Increase Factors due to the Third Harmonic Spreading
Figure 12: Damage Increase Factors due to the Fifth Harmonic Spreading
6. CONCLUSIONS
We have studied the impact on fatigue damage of (a) the presence of higher harmonic stress components, and (b) the spread of the power spectral density (PSD). First, statistical analysis methods are used to calculate the stress PSD from experimental data and then to reconstruct time series with the same total power but different PSD shape. The rainflow algorithm is applied to the time series to find the fatigue life and damage on the riser. To assess the impact of the variations introduced, the ratio of the fatigue damage resulting from the changes introduced, relative to the fatigue damage of the original signal, is calculated.
In cases where significant higher harmonics exist, the damage can be increased up to five times, while on average there is a damage increase of 2.5 times relative to damage by first harmonic stresses alone.
Figure 13: Total Spreading Damage Increase Factor
The fatigue damage increases, on average, by another factor of 2 due to a spread PSD, characteristic of Type-II (chaotic) behavior of the riser. In some cases the fatigue damage increase can be as large as two orders of magnitude. ACKNOWLEDGMENTS
The authors acknowledge with gratitude the permission granted by the Norwegian Deepwater Program me (NDP) Riser and Mooring Project to use the Riser High Mode VIV tests. Support was provided by the BP-MIT Major Programs. The first author would like to acknowledge the financial support given to her by the Dumbros Scholarship & Fellowship Fund at MIT.
REFERENCES
[1] N. Jauvtis, C.H.K. Williamson, 2004. “A High-Amplitude 2T Mode of Vortex Formation, and the Effects of Non-Hamonic Forcing in Vortex-Induced Vibration.” European
Journal of MechanicsB/Fluids, Vol. 23, pp 107-114.
[2] J, Vandiver, S. Swithenbank, V. Jaiswal, V. Jungran, 2006.
ASME Offshore Mechanics and Arctic Engineering Conference, Hamburg, Germany.
[3] J.M. Dahl, F.S. Hover, M.S. Triantafyllou, S. Dong, G.E. Karniadakis, 2007. “Resonant Vibrations of Bluff Bodies Cause Multi-Vortex Shedding and High Frequency Forces.” Physical Review Letters, Vol. 99, 144503. [4] Modarres-Sadeghi, Y., Mukundan, H., Dahl, H.M., Hover,
F.S., Triantafyllou, M.S. “The Effect of Higher Harmonic Forces of Fatigue Life of Marine Risers,” Journal of Sound
and Vibration, Vol. 329 (2010), pp.43-55.
[5] F. Chasparis, Y. Modarres-Sadeghi, F. Hover, M.S. Triantafyllou, M. Tognarelli, P. Beynet (2009). Lock-in, Transient and Chaotic Response in Riser VIV. Proceedings
of the 28th International Conference on Offshore Mechanics and Arctic Engineering OMAE, 31 May - 5
June 2009, Honolulu, Hawaii.
0 0.5 1 1.5 2 2.5 0.5 1 1.5 2 2.5 3 Maximum Velocity (m/s) D a m a g e I n c re a s e F a c to r (Ds p re a d /D s in g le ) Uniform Bare Sheared Bare Uniform Straked Sheared Straked 0 0.5 1 1.5 2 2.5 0.8 1 1.2 1.4 1.6 1.8 2 Maximum Velocity (m/s) D a m a g e I n c re a s e F a c to r (Ds p re a d /D s in g le ) Uniform Bare Sheared Bare Uniform Straked Sheared Straked 0 0.5 1 1.5 2 2.5 0.4 0.6 0.8 1 1.2 1.4 1.6 1.8 2 2.2 2.4 Maximum Velocity (m/s) D a m a g e I n c re a s e F a c to r (D s p re a d /D d is t ) Uniform Bare Sheared Bare Uniform Straked Sheared Straked
[6] Modarres-Sadeghi, Y., Chasparis, F., Triantafyllou, M.S., Tognarelli, M., Beynet, P., 2011. Chaotic Response is a Generic Feature of Vortex-Induced Vibrations of Flexible Risers, Journal of Sound and Vibration,
doi:10.1016/j.jsv.2010.12.007.
[7] T.Sarpkaya, “A critical review of the intrinsic nature of vortex-induced vibrations,” Journal of Fluids and
Structures, vol. 19 (2004), pp. 389–447.
[8] C.H.K.Williamson, R.Govardhan, ”Vortex-Induced Vibrations,” Annual Review of Fluid Mechanics, vol. 36, (2004), pp. 413–455.
[9] J.K.Vandiver, “Dimensionless parameters important to the prediction of vortex-induced vibration of long, flexible
cylinders in ocean currents”, Journal of Fluids and
Structures, vol. 7 (1993), pp. 423–455.
[10] H. Braaten, H. Lie, NDP riser high mode VIV tests, Main Report no. 512394.00.01, Norwegian Marine Technology Research Institute, 2004.
[11] Matsuishi, M and Endo, T. “Fatigue of Metals Subjected to Varying Stress,” Japan Society of Mechanical Engineers, Juvoka, 1968.
[12] Mukundan, H, Modarres-Sadeghi, Y., Dahl, J.M., Hover, F.S., Triantafyllou, M.S. “Monitoring VIV Fatigue Damage on Marine Risers,” Journal of Fluids and