HAL Id: hal-00305058
https://hal.archives-ouvertes.fr/hal-00305058
Submitted on 22 Feb 2007
HAL is a multi-disciplinary open access
archive for the deposit and dissemination of
sci-entific research documents, whether they are
pub-lished or not. The documents may come from
teaching and research institutions in France or
abroad, or from public or private research centers.
L’archive ouverte pluridisciplinaire HAL, est
destinée au dépôt et à la diffusion de documents
scientifiques de niveau recherche, publiés ou non,
émanant des établissements d’enseignement et de
recherche français ou étrangers, des laboratoires
publics ou privés.
scale
P. Schmocker-Fackel, F. Naef, S. Scherrer
To cite this version:
P. Schmocker-Fackel, F. Naef, S. Scherrer. Identifying runoff processes on the plot and catchment
scale. Hydrology and Earth System Sciences Discussions, European Geosciences Union, 2007, 11 (2),
pp.891-906. �hal-00305058�
© Author(s) 2007. This work is licensed under a Creative Commons License.
Earth System
Sciences
Identifying runoff processes on the plot and catchment scale
P. Schmocker-Fackel1,2, F. Naef1, and S. Scherrer3
1Insitute of Environmental Engineering, ETH Zurich, ETH H¨onggerberg, 8093 Z¨urich, Switzerland
2Swiss Federal Institute for Forest, Snow and Landscape Research, WSL, Z¨urcherstrasse 111, 8903 Birmensdorf, Switzerland 3Scherrer AG Hydrologie und Hochwasserschutz, Stockackerstrasse 25, 4153 Reinach, Schwitzerland
Received: 27 June 2006 – Published in Hydrol. Earth Syst. Sci. Discuss.: 7 August 2006 Revised: 30 January 2007 – Accepted: 11 February 2007 – Published: 22 February 2007
Abstract. Rainfall-runoff models that adequately represent the real hydrological processes and that do not have to be calibrated, are needed in hydrology. Such a model would require information about the runoff processes occurring in a catchment and their spatial distribution. Therefore, the aim of this article is (1) to develop a methodology that allows the delineation of dominant runoff processes (DRP) in the field and with a GIS, and (2) to illustrate how such a map can be used in rainfall-runoff modelling.
Soil properties were assessed of 44 soil profiles in two Swiss catchments. On some profiles, sprinkling experiments were performed and soil-water levels measured. With these data, the dominant runoff processes (DRP) were determined using the Scherrer and Naef (2003) process decision scheme. At the same time, a simplified method was developed to make it possible to determine the DRP only on the basis of maps of the soil, topography and geology. In 67% of the soil profiles, the two methods indicated the same processes; in 24% with minor deviations.
By transforming the simplified method into a set of rules that could be introduced into a GIS, the distributions of the different DRPs in two catchments could be delineated au-tomatically so that maps of the dominant runoff processes could be produced. These maps agreed well with manually derived maps and field observations.
Flood-runoff volumes could be quite accurately predicted on the basis of the rainfall measured and information on the water retention capacity contained in the DRP map. This illustrates the potential of the DRP maps for defining the in-filtration parameters used in rainfall-runoff models.
Correspondence to: P. Schmocker-Fackel
1 Introduction
Rivers react differently to extreme precipitation. Some pro-duce flash floods of frightening magnitude while others alter their flow only sluggishly. Climate, catchment size and to-pography are factors that clearly influence the behaviour of rivers. An additional crucial factor is the infiltration and stor-age behaviour of the soils in a catchment. On some soils, rain hardly infiltrates and is then rapidly transformed into runoff. On others, nearly all precipitation infiltrates and is either stored in the soil or the bedrock, or flows underground with some delay towards the river. The majority of rainfall-runoff models reproduce this behaviour by adapting the pa-rameters of a previously defined model concept, using mea-sured rainfall and discharge data.
The problems connected with this approach are well known. It is difficult to identify the parameters correctly and to prove that a model is a valid representation of the pro-cesses in the catchment (e.g. Beven, 2001; Grayson et al., 1992; Naef, 1981). In addition, most catchments are un-gauged and parameter calibration to runoff is not possible. Concepts for identifying hydrologic similarity and methods for determining the model parameters are needed (Bl¨oschl, 2005). To this purpose, the International Association of Hy-drological Sciences (IAHS) launched the IAHS Decade on Predictions in Ungauged Basis PUB (Sivapalan et al., 2003). On the plot and hillslope scale, many different aspects of runoff formation have been studied in recent years (e.g. An-derson and Burt, 1990; Buttle and McDonald, 2002; Mc-Donnell, 2003; Scherrer et al., 2006; Scherrer, 1997; Weiler et al., 2005; Weiler and Naef, 2003). To integrate this pro-cess knowledge into rainfall-runoff modelling, a methodol-ogy is needed to define the spatial distribution of the runoff processes in a catchment.
Few such methodologies exist. A widely used example of a spatially differentiated method is the SCS CN method, which was developed by the U.S. Soil Conservation Service
(SCS) for small ungauged streams (USDA, 1985). It uses runoff-curve numbers (CN), which are a function of soil type and land use. The method’s simplicity and straightforward-ness is probably the main reason for its popularity, although it cannot reproduce the full range of catchment responses that have been observed (Naef et al., 1998; Titmarsh et al., 1995). A more recent approach for classifying the hydrology of soils is the HOST (Hydrology Of Soil Types) classification of Great Britain, published on maps with a scale of 1:250 000 (Boorman et al., 1995). Soils are grouped according to whether a similar hydrological reaction is expected. The small scale of the published map limits its suitability for esti-mating flood discharge in small catchments. Dunn and Lilly (2001) transferred model parameter sets from one catchment to another based on the HOST class distribution. Soulsby et al. (2006a) used HOST to predict catchment response in small to mesoscale catchments.
The definition of landscape or geomorphological units with similar hydrological behaviour has been proposed as another type of hydrological classification. McGlynn and McDonnell (2003a) distinguish between hillslope and ri-parian zones. Sidle et al. (2000) added zero-order basins such as shallow groundwater reservoirs as a distinct class. Merz and Mosely (1998) differentiated between undisturbed land, landslide scars and landslide deposits, and Uhlen-brook et al. (2004) considered landscape units like moraine, periglacial drift cover or saturated areas. Although some of these classifications are rather coarse and do not take into consideration all processes that occur, they are useful for de-scribing and modelling the hydrology of a specific catchment or for investigating a specific hydrological problem. These top-down approaches try to identify homogeneous landscape units. The assumption is that the hydrological response will also be homogeneous. By contrast, in bottom-up approaches, runoff formation is investigated on the plot scale and then units with the same runoff forming process are identified.
Methods to determine the runoff processes on the plot scale have been developed for example by Peschke et al. (1999) and Scherrer and Naef (2003). Both use soil data, geology, topography and vegetation for the process identifi-cation but differ in their definition of the runoff processes and in the parameters they use for the classification. In this paper we follow the approach used by Scherrer and Naef (2003).
To investigate runoff formation, Scherrer (1997) and Faeh (1997) conducted sprinkling experiments on 18 grassland hillslopes with varying slopes, geology and soils throughout Switzerland. They applied 50 to 100 mm/h of rainfall for 3 to 5 h to 60 m2plots and measured the resulting surface and subsurface flow. They also recorded the soil-water levels, soil-water content and soil-water tension in each plot. The sites reacted very differently with different surface and sub-surface runoff, timing of runoff and flow paths (Scherrer et al., 2006). Scherrer and Naef (2003) used this research as a basis for developing process decision schemes (SN schemes) to determine the dominant runoff process (DRP) on a soil
profile. Several runoff processes can occur on one site, the one that contributes most to runoff is called dominant. Which process dominates depends on the site characteristics and the rainfall event. The SN decision schemes distinguish between rainfall events of long duration with medium intensities and events with high intensities but short duration. The schemes reflect the complex nature of runoff formation.
The SN schemes have so far only been applied on the plot scale or in small catchments based on extensive field work. The objectives of this paper are therefore: 1) to introduce a methodology that allows the use of the SN schemes to au-tomatically delineate the dominant runoff processes on the catchment scale, based on soil maps; and 2) to illustrate the potential of the resulting DRP maps for simulating flood dis-charge.
For this purpose, the SN schemes had to be simplified to reduce their data requirements so that they could be used only with the data available in maps of soils, geology, land use and topography. Then a set of rules was developed, which allowed an automatic determination of the dominant runoff processes in a Geographic Information System (GIS). This new set of rules was used to automatically produce DRP maps for two catchments. The resulting maps were tested with hydrologic observations during flood events and the DRP determined with the original SN scheme.
We argue that such maps could help to improve rainfall-runoff modelling of flood events. In addition, they might be used to predict potential risk areas like for pesticide loss or soil erosion.
2 Study site and data collection 2.1 Study site
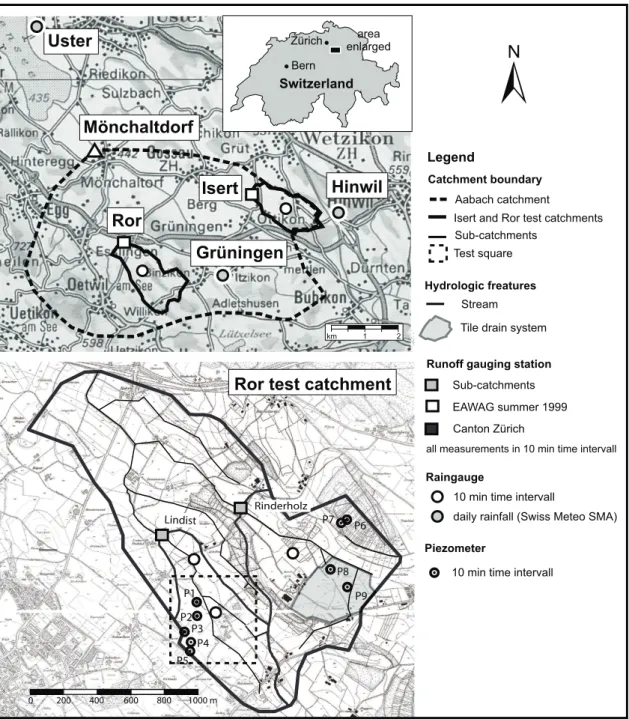
The Ror catchment (2.1 km2) and the Isert catchment (1.7 km2)are located 30 km northeast of Zurich, on the Swiss Central Plateau (Fig. 1). They form part of the larger Aabach catchment (46.0 km2). The underlying bedrock is composed of sandstone, marl and conglomerates of the Upper Fresh-water Molasse (OSM) and is partially overlain by glacial till of the W¨urm ice age (Ror) or fluvial gravel deposits (Isert) (Hantke et al., 1967). Groundwater bodies with high hy-draulic permeabilities are found in the fluvial deposits, while the molasse and glacial till have low permeabilities (Haer-ing et al., 1993). Drumlins and ice-carved rocks form the relief in this rolling countryside. In the depressions and val-leys between the hills, swamps developed. The majority of them were artificially drained in the middle of the 20th cen-tury. The main land use in the catchments is livestock farm-ing with a dominance of meadows and pastures, followed by agricultural fields (corn and grain). In the Insert catchment about 15% and in Ror about 8% of the area is forested while another 10% is built over (houses and roads). In the Ror catchment, additionally two nested sub-catchments (Lindist
Rinderholz Lindist P1 P2 P3 P4 P5 P6 P7 P8 P9
Ror test catchment
all measurements in 10 min time intervall Tile drain system
±
0 200 400 600 800 1000 m
Runoff gauging station
Piezometer
EAWAG summer 1999
Raingauge
10 min time intervall Canton Zürich
daily rainfall (Swiss Meteo SMA)
Catchment boundary
Isert and Ror test catchments Aabach catchment Legend Sub-catchments Hydrologic freatures Stream Sub-catchments
10 min time intervall Test square
Ror
Isert
Grüningen
Mönchaltdorf
Hinwil
Uster
1 2 km Bern Zürich Switzerland area enlargedFig. 1. Isert and Ror test catchments and the sub-catchments Rinderholz and Lindist. Locations of the measurement stations and test square
(Fig. 8) are shown as well.
and Rinderholz) were investigated. More details about the catchments is given in Table 1.
The mean annual precipitation is 1370 mm, the mean an-nual temperature is 7◦C, and the mean annual
evapotranspi-ration is about 46% of the annual rainfall. Precipitation has a slight peak in summer (May to September). Mean annual runoff of the Aabach at M¨onchaltdorf is 740 mm (Kanton Z¨urich, 2000).
2.2 Catchment instrumentation
Runoff of the Aabach has been measured at M¨onchaltdorf since 1980 (Kanton Z¨urich, 2000). Runoff of the Isert and Ror catchments was measured in summer 1999 (Leu et al., 2004) and in the sub-catchments Lindist and Rinderholz from summer 2001 to fall 2003 in 10 min intervals.
Table 1. Catchment characteristics.
Sub-catchment Size Elevation range Geology Land use [%]
[km2] [m a.s.l] Grassland Culti
v ated field F orest Settlements and roads T ile drained 1
Isert 1.70 514–575 Interglacial fluvial 42 33 15 10 14
gravel, overlain by glacial till in the northern part.
Ror 2.10 490–550 Sandstone, marl and 60 25 8 7 27
Lindist 0.39 512–547 conglomerates of OSM2, 66 24 1 9 2
overlain by glacial till
Rinderholz 0.67 509–550 in the north-eastern part. 61 21 11 7 35
1% of total area2OSM: Upper freshwater molasse
Several daily rain gauges are located in the Aabach catchment. Additionally, rainfall was measured in the sub-catchments in 10 min intervals during the runoff measure-ments. In spring 2001, nine piezometers were installed in the Ror catchment to measure soil-water levels in 10 min inter-vals. The locations of all stations are shown in Fig. 1. 2.3 Available data and field methods
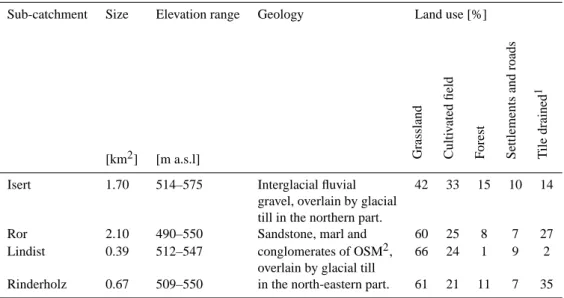
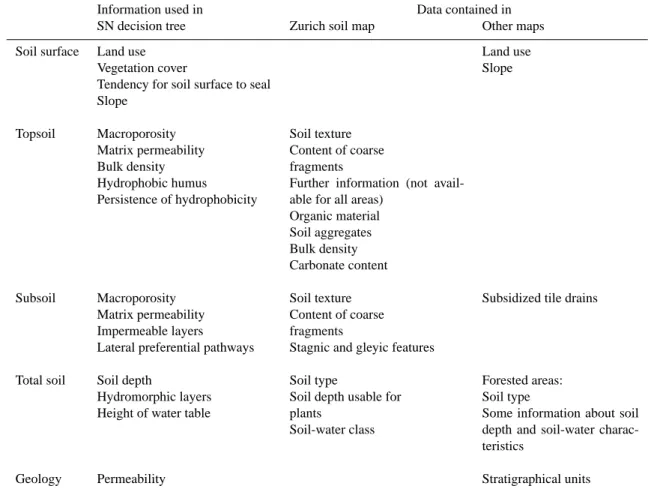
In Table 2 all spatial data sources available in digital or ana-logue form are listed. A soil map, also referred to as the Zurich soil map, covers the agricultural areas of the catch-ments investigated (FAL, 1997). This map is of high quality in a scale of 1:5000 and is based on 3 to 7 sample soil profiles per square kilometre. For the forests, only some basic soil information is available in a forest vegetation map. Plans of artificially drained areas exist for the Canton Zurich, but not all tile drain systems are included. Therefore, ditches, chan-nels, drain pipes exiting to rivers and man-holes or shafts were mapped in the field to identify artificially drained areas. Land use was mapped in the field and from aerial photogra-phy.
During the project, fifteen soil pits were excavated and 21 soil core samples taken in the Ror catchment. In the Isert catchment, six soil pits were excavated and two soil core samples taken. The locations of the profiles represent the typ-ical types of soil and land use in the catchments. Most pro-files lie along hillslope transects (catena mapping approach). For each soil profile or soil horizon, soil parameters like soil texture, bulk density and content of coarse fragments were determined. Hydrologically relevant parameters, which in-clude aggregate stability, number of macropores and prefer-ential lateral flowpaths, were determined as well (for details
see Schmocker-Fackel, 2004). Near some profiles, sprinkling experiments over an area of 1 m2or infiltration experiments with a double ring infiltrometer were conducted.
3 Determination of the dominant runoff processes on a soil profile
3.1 Basic principles
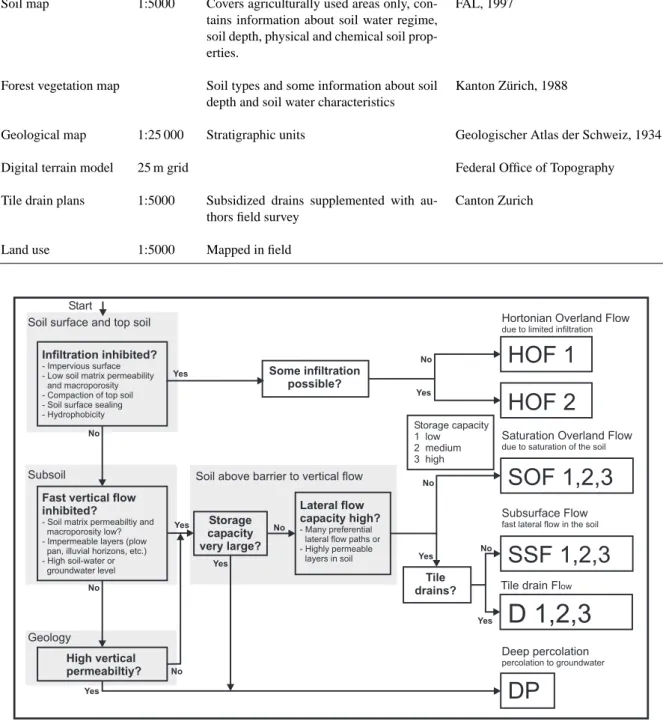
The following runoff processes are distinguished: “Hor-tonian Overland Flow” HOF, “Saturated Overland Flow” SOF, “fast Subsurface Flow” and “Deep Percolation” DP. The fast subsurface flow is further divided into “natural sub-surface flow” SSF on hillslopes and “tile drain flow” D. Sev-eral runoff processes can occur on one site during a storm event. The process that contributes most to runoff is called “dominant”.
Which runoff process dominates depends on the factors shown in Fig. 2. The most important are infiltration, the storage capacity and the lateral flow capacity of the soil and the underlying geology. To distinguish between different soil storage capacities, numbers from 1 to 3 are added to the pro-cess abbreviations (1 very low storage capacity to 3 large storage capacity). An exception to this rule is the HOF pro-cess.
Estimation of infiltration
Hortonian overland flow occurs, if rainfall intensity exceeds infiltration capacity. Fast HOF, which occurs on roads and in settlements is called HOF 1. On soils, the infiltration capac-ity depends on the soil texture, the bulk denscapac-ity and the water
Table 2. Maps and spatial data used for the process determination.
Scale Comments Reference or data holder
Soil map 1:5000 Covers agriculturally used areas only, con-tains information about soil water regime, soil depth, physical and chemical soil prop-erties.
FAL, 1997
Forest vegetation map Soil types and some information about soil depth and soil water characteristics
Kanton Z¨urich, 1988
Geological map 1:25 000 Stratigraphic units Geologischer Atlas der Schweiz, 1934
Digital terrain model 25 m grid Federal Office of Topography
Tile drain plans 1:5000 Subsidized drains supplemented with au-thors field survey
Canton Zurich
Land use 1:5000 Mapped in field
Soil surface and top soil
Subsoil Soil above barrier to vertical flow
Geology
Infiltration inhibited? - Impervious surface - Low soil matrix permeability
and macroporosity - Compaction of top soil - Soil surface sealing - Hydrophobicity
Fast vertical flow inhibited?
- Soil matrix permeabiltiy and macroporosity low? - Impermeable layers (plow
pan, illuvial horizons, etc.) - High soil-water or
groundwater level
Lateral flow capacity high? - Many preferential
lateral flow paths or - Highly permeable layers in soil Storage capacity very large? Some infiltration possible? Tile drains? High vertical permeabiltiy?
HOF 1
HOF 2
SOF 1,2,3
SSF 1,2,3
D 1,2,3
DP
Yes Yes Yes Yes Yes Yes Yes No No No No No No NoHortonian Overland Flow
due to limited infiltration
Saturation Overland Flow
due to saturation of the soil
Deep percolation
percolation to groundwater
Subsurface Flow
fast lateral flow in the soil
Tile drain Flow Storage capacity 1 low 2 medium 3 high Start
Fig. 2. Schematic representation of how the dominant runoff processes can be determined on a soil profile.
content of the soil matrix and the number and properties of macropores. On permeable, not compacted and macro-porous soils, infiltration normally exceeds rainfall intensity even during flood events. However, soil-surface sealing, water-repellency or compaction of the topsoil can reduce in-filtration significantly in otherwise permeable soils and HOF 2 occurs. Soil surface sealing is most likely to occur on soils
rich in silt and low in carbonate and organic material. These soils tend to have unstable soil aggregates in combination with low vegetation cover. Silt-rich soils are also suscepti-ble to top soil compaction. Water repellency, which occurs in Switzerland mainly on areas with heath vegetation or on alpine meadows was not observed in the test catchements.
(a)
(b)
(c)
(d)
(e)
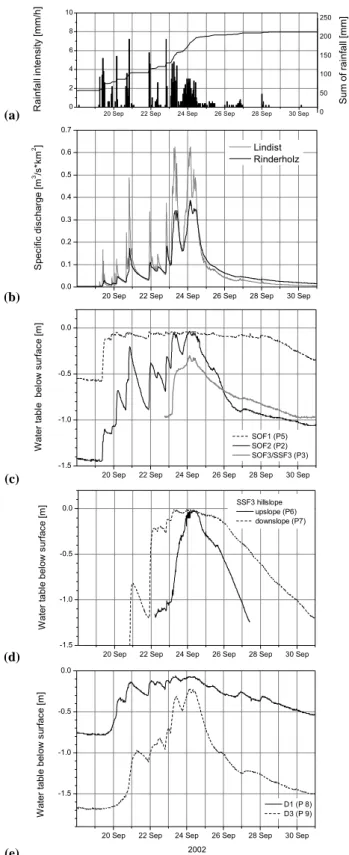
Fig. 3. Rainfall (a), catchment runoff (b) and soil-water levels
mea-sured in different process areas (c)–(e) in the Lindist and Rinderholz sub-catchments during the September 2002 flood event.
Estimation of water storage capacity
Further downward flow in the soil is inhibited if the water encounters a layer with significantly lower permeability. In this case, the water starts to saturate the soil above this layer. A significant decrease in permeability and in the number of macropores often occurs at the soil-bedrock interface if the soil stratum changes (e.g. there are soil textural changes in alternating deposits) or if compaction has occurred (e.g. in plough pans). Macropores, such as animal burrows and root channels, have a distinct vertical distribution and cannot be found below a certain depth. High ground- or soilwater levels also limit vertical flow.
In this study, the water storage capacity of each soil hori-zon corresponds to the depth of the horihori-zon times the drain-able porosity (porosity between field capacity and satura-tion). The German handbook for soil classification (AG Bo-den, 1994) lists porosity values for different soil textures and bulk densities. The drainable porosity of each soil horizon could be estimated by determining its soil texture and bulk density in the laboratory. The total storage capacity is the sum of the storage capacities of all horizons above an imper-meable layer. In the investigated soil profiles the storage ca-pacities range from 8 to 240 mm, with a mean of 80 mm and a standard deviation of 50 mm. For the mapping, they were divided into three classes. Storage class 1 covers capacities between 0 and 40 mm, class 2 between 40 and 100 mm and class 3 between 100 and 200 mm. Capacities of more than 200 mm were classified as DP.
Lateral flow
On slopes the infiltrated water can flow laterally in the soil matrix as well as in preferential lateral flowpaths, like pipes, highly permeable layers or tile drains. Such structures allow a fast lateral transport of water even in unsaturated soils. Sub-surface flow can contribute to flood runoff. Even if the lateral flow capacity is only small, it can influence runoff formation as it prevents saturation of the soil during very long rain-fall events. Preferential lateral flowpaths are often difficult to find, but they can sometimes be identified by depressions of collapsed pipes or by observing return flow during or after rainfall events.
3.2 Determination of dominant runoff processes in the field For 44 soil profiles in the Ror and Isert catchments, the SN parameters and other soil properties were collected and the dominant runoff processes determined using the SN scheme. Next to some of these profiles, continuous soil-water level measurements and or sprinkling experiments were conducted to test the process evaluation based on the SN schemes (Sect. 3.3).
The collected soil data was compared to the soil map and other maps. This comparison helped in the development of the automated process determination (Sect. 3.4).
3.3 Soil-water level fluctuations in soils with different dominant runoff process
The dominant runoff processes indicate where the hydrolog-ical behaviour of the soil is different. Saturation of an SOF 1 area occurs faster than that of an SOF 3 area, while an SSF area drains faster than an SOF area. Nine piezometers were installed in the Ror catchment on areas where different dom-inant runoff processes were expected. Figure 3 shows some examples of the soil-water level fluctuations during a flood in September 2002, which had an estimated return period of 3 to 5 years. Between the 19 and 25 September 2002, 130 to 140 mm of rainfall were recorded with a maximum intensity of 7 mm/h (Fig. 3a).
In piezometer P 5, situated on an SOF 1 area, the water level reached the surface after only 20 mm of rain, whereas in P 8, on a drained D 1 area, it reached the surface after 40 mm of rainfall. On an SOF 2 area (P 2), however, 80 mm were required for the water level to reach the surface and the SOF 3/SSF 3 area (P 3) did not saturate (Fig. 3c). Saturation of the SOF 1 and SOF 2 areas occurred quickly enough for the runoff from these areas to contribute to peak discharge, while the SOF 3 area did not contribute.
Whereas the SOF 1 area remained saturated for several days after the event, the water levels in the SOF 2 well dropped quickly. In the SOF 3 well, water levels fell much more slowly than in the SOF 2 well. The water level fluctua-tions in the SOF areas illustrate that soil drainage also differs in different SOF areas.
No highly permeable layers were found on the soil bedrock interface or in the bedrock in the catchments. All the lateral subsurface flowpaths found were of biological ori-gin (mouse burrows or root channels under forest) and an estimation of their lateral flow capacity was difficult. Along a SSF hillslope, water levels rose faster and fell slower in the downslope well (P 7) than in the upslope well (P 6). The downslope well is located in a return flow area and showed prolonged saturation of the soil during the two days of the main event (23 and 24 September 2002).
The wells P 8 and P 9 are located in artificially drained alluvial deposits. While the water level in P 9 never reached the surface, P 8 reacted like a SOF 1 well. The variations in soil texture of the alluvial deposits led to marked differences in drainage rate. Additionally, the efficiency of the tile drain system and the distance of the well from a tile drain influence the water level in the soil.
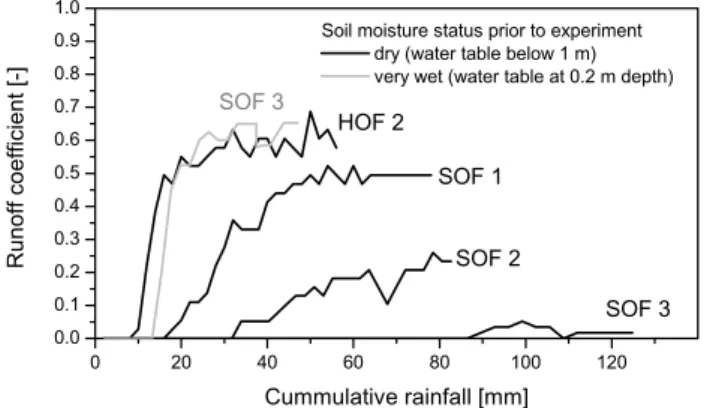
Figure 4 shows runoff measured from different process ar-eas when 1 m2 plots were sprinkled at the rate of 60 mm/h. On the HOF 2 area, runoff started after only 5 mm of rain and the runoff coefficient increased rapidly. On the SOF 1 and SOF 2 areas, runoff was delayed and on the SOF 3 area,
0 20 40 60 80 100 120 0.0 0.1 0.2 0.3 0.4 0.5 0.6 0.7 0.8 0.9 1.0 SOF 3
Soil moisture status prior to experiment dry (water table below 1 m) very wet (water table at 0.2 m depth)
R u n o ff co e ff ici e n t [-] Cummulative rainfall [mm] SOF 3 SOF 2 SOF 1 HOF 2
Fig. 4. Surface Runoff coefficients observed during sprinkling
ex-periments over 1 m2with an intensity of 60 mm/h on agricultural fields (HOF 2) and grassland (SOF 1 to 3).
hardly any runoff occurred at all. When the experiment was repeated on a nearly saturated SOF 3 area, the reaction was comparable to that of the HOF 2 experiment.
3.4 Automated process determination
The SN scheme allows the processes to be determined on a soil profile. The parameters needed are given in Table 3, but assessing them requires intensive fieldwork (Schmocker-Fackel, 2004). Additionally, many soil profiles have to be investigated to evaluate the spatial process distribution in a catchment. To reduce the fieldwork and to simplify the process delineation, we developed an automated, map-based methodology, using the high quality Zurich soil map and other spatial data.
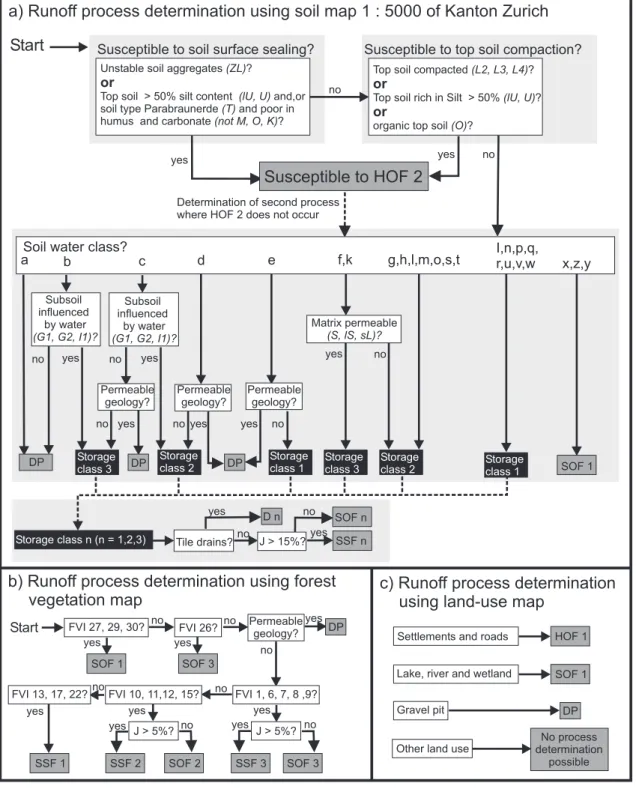
Although the Zurich soil map is detailed, it does not con-tain all the parameters required by the SN decision scheme. For instance macroporosity, impermeable layers or lateral preferential pathways are not recorded (Table 3). Other pa-rameters, such as hydromorphic layers and the height of the water table have to be inferred from the soil map on the basis of the soil type and soil-water class. For determining pro-cesses automatically, the SN schemes had therefore to be adapted (Fig. 2) so that the information from the soil map could be used to estimate infiltration capacity, soil storage capacity and lateral flow capacity (Fig. 5).
In the test catchments, HOF might occur on some areas during rainfall intensities of more than 50 mm/h. Therefore, the susceptibility of the soil to HOF during high rainfall in-tensities is assessed in the set of rules. For lower inin-tensities, the SN scheme might define another process as DRP.
Estimation of infiltration capacity
HOF 1 occurs in settlements or on roads (Fig. 5c). On natural areas, infiltration capacity is normally high, except on agri-cultural areas where HOF 2 might occur due to soil surface-sealing or soil compaction. Soil map information about soil
Table 3. Information used in the Scherrer and Naef (2003) decision scheme (SN scheme) compared to data found in the Zurich soil map and
other maps.
Information used in Data contained in
SN decision tree Zurich soil map Other maps
Soil surface Land use Vegetation cover
Tendency for soil surface to seal Slope Land use Slope Topsoil Macroporosity Matrix permeability Bulk density Hydrophobic humus Persistence of hydrophobicity Soil texture Content of coarse fragments
Further information (not avail-able for all areas)
Organic material Soil aggregates Bulk density Carbonate content Subsoil Macroporosity Matrix permeability Impermeable layers
Lateral preferential pathways
Soil texture Content of coarse fragments
Stagnic and gleyic features
Subsidized tile drains
Total soil Soil depth
Hydromorphic layers Height of water table
Soil type
Soil depth usable for plants
Soil-water class
Forested areas: Soil type
Some information about soil depth and soil-water charac-teristics
Geology Permeability Stratigraphical units
texture, soil aggregates, soil chemistry and bulk density were used to determine areas susceptible to HOF 2 (Fig. 5a). How-ever, HOF 2 only occurs on these areas in conjunction with other factors such as unfavourable land use and agricultural practices, lack of vegetation cover and high rainfall intensi-ties.
Estimation of storage capacity
The Zurich soil map distinguishes 25 soil-water classes ac-cording to soil-water characteristics and the soil depth us-able for plants (for the definitions of these classes see Leg-end Fig. 5). Based on the storage capacities estimated for the 44 soil profiles in the Ror and Isert catchments, the storage classes were allotted to the soil- water classes as shown in Fig. 5a.
In forests not covered by the Zurich soil map, forest vege-tation maps were used instead. These maps contain some in-formation about soil type, soil-water characteristics and soil depth. The allocation of the forest vegetation index to storage class is shown in Fig. 5b.
Estimation of lateral flow capacity
Natural preferential flowpaths are more likely to occur on steep slopes. In the two test catchments, SOF occurred on slopes below 15%, SSF on slopes above 10% in non-forested areas. Therefore, the set of rules specifies that SOF is likely to occur on slopes below 15% and SSF on slopes above 15%. In forests, preferential lateral flowpaths are more frequent due to the root systems. SSF was already found on slopes of 5%. This slope is used to distinguish SOF and SSF in forested areas in the automated process determination. 3.5 Example of process determination with the set of rules Process determination according to the set of rules shown in Fig. 5 is illustrated for the soil map units wW8 and fB9 in the Ror catchment. The first letter of the code indicates the soil-water class (see legend Fig. 5), the second letter stands for the soil type (W: Gleysol, B: Cambisol) and the digit refers to sub-soil type information like soil texture, content of coarse fragments or humus type.
yes yes yes yes yes yes yes yes
yes yes yes
yes yes yes yes yes yes yes no no no no no no no no no no no no no no no no no
Susceptible to soil surface sealing? Susceptible to top soil compaction?
Unstable soil aggregates ?
Top soil ilt content and,or
soil type Parabraunerde
(ZL) (lU, U) (T) or > 50% s and poor in
humus and carbonate(not M, O, K)?
Top soil compacted ?
Top soil rich in Silt > 50% ?
organic top soil ?
(L2, L3, L4) (lU, U) (O) or or
Susceptible to HOF 2
d cSoil water class?
f,k g,h,l,m,o,s,t I,n,p,q,r,u,v,w x,z,y
Subsoil influenced by water (G1, G2, I1)? Subsoil influenced by water (G1, G2, I1)? Permeable geology? Permeable geology? Permeable geology? Permeable geology? Matrix permeable (S, lS, sL)? DP DP DP DP DP SOF 1 SOF 1 SOF 1 HOF 1 SOF n SOF 3 SOF 2 SOF 3 SSF n SSF 2 SSF 1 SSF 3 D n Storage class 1 Storage class n (n = 1,2,3) Storage class 1 Storage class 2 Storage class 2 Storage class 3 Storage class 3 Tile drains? J > 15%? J > 5%? J > 5%?
a) Runoff process determination using soil map 1 : 5000 of Kanton Zurich
Start
Start b
a e
Determination of second process where HOF 2 does not occur
b) Runoff process determination using forest
vegetation map
c) Runoff process determination
using land-use map
Settlements and roadsLake, river and wetland
Gravel pit
FVI 27, 29, 30? FVI 26?
FVI 1, 6, 7, 8 ,9? FVI 10, 11,12, 15?
FVI 13, 17, 22?
Other land use
No process determination
possible
Fig. 5. Set of rules to determine the dominant runoff process with GIS using soil and other maps. For agricultural areas, determination is
based on the Zurich soil map (a), for forested areas on the forest vegetation map (b) and for other areas on the land-use map (c).
For example, the soil map code wW stands for an often sat-urated, 30–50 cm thick Gleysol (Buntgley), which is found in the valley floor and in a small strip along the river with slopes below 10%. The sub-soil type information indicates
an extremely gleyic soil. The soil map legend states that the humus type is mor, the parent material alluvium, the soil tex-ture loamy clay and that the content of coarse fragments is less than 5% by volume. This indicates that wW8 was a
Legend
Soil depth usable by plants1[cm]
Soil water regime >100 70-100 50-70 30-50 <30
Normal permeability. a b c d e
Vertically per-colated soils.
Slightly poor drainage f g h i
Slightly influenced by ground water k l m n
Seldom saturated o p
Soils with poor drainage Often saturated q r Seldom saturated s t u Soils influenced by groundwater Often saturated v w
Most of the time saturated x y
Permanently saturated z
1
Total soil depth minus content of coarse fragments minus compacted or permanently saturated zones
Soil type
T Parabraunerde (Luvisol, Podzoluvisol)
J Slope Others
L2 Compacted
L3 Very compacted
L4 Extremely compacted
K Rich in carbonate
M Mor, Moder, Mull humus or rich in humus
O Hydromorph organic material
ZL Unstable aggregates
Runoff processes HOF
Saturated Overland flow SSF Subsurface flow
D Tile drain flow
DP Deep percolation
Hortonian Overland flow SOF
Soil water subsoil
I1 Slightly stagnic
G1 Very slightly gleyic
G2 Slightly gleyic Soil texture U Silt lU Loamy Silt S Sand lS Loamy Sand Storage class 1 0 - 40 mm 2 40 - 100 mm 3 100 - 200 mm Decision Intermediate result Dominant runoff process
Soil-water class
Parameters of soil map 1 : 5000 Kanton Zurich (FAL, 1997)
(ZL) Parameter of soil map
1 : 5000
Soil information in the Forest Vegetation Index (FVI)
1,6,7,8,9 Braunerde (Cambisol) or Parabraunerde , deep and dry soils
10, 15 Rendzina (Rendzic Leptosol), medium deep and dry soils
11,12 Braunerde, deep and humid soils
13, 17, 22 Hillslope debris on steep slopes
26 Subsoil gelyic or stagnic, located at base of hillslopes
27 Gley soils
29, 30 Often or permanently saturated soils in hollows
(Luvisol, Podzoluvisol)
Fig. 5. Continued.
flood plain with periodic sedimentation of fine-grained mate-rial and permanently high groundwater tables. The low stor-age capacity of this shallow soil and the frequent saturation indicates that SOF 1 is the dominant runoff process. This process was also deduced from examining a soil pit in this area (vertical percolation was restricted because groundwa-ter levels were at a depth of 30 cm and the storage capacity was estimated to be 14 mm).
The aggregates of the topsoil in soil map unit fB9 are clas-sified as unstable. Corn is grown on part of this area and vegetation cover is therefore low for at least part of the year. Frequent traverses by heavy machinery in combination with low aggregate stability and low vegetation cover might re-sult in soil surface sealing or topsoil compaction, reducing
infiltration capacity. During rainfall events with high inten-sities (>50 mm/h), HOF 2 is expected. This was also ob-served during sprinkling experiments at this site. During medium intensity events or when vegetation cover is dense, however, another process normally occurs. The soil map unit covers part of a sandstone ridge with gently sloping hill-slopes. The sandstone has usually a low permeability which can be higher if fissures are present. Since the layering is nearly horizontal and was not under tectonic stress, fissures are rare and the underlying geology can therefore be regarded as lowly permeable. The vertically percolated Cambisol soil (Braunerde) has slightly poor drainage and reaches a depth of 70 to 100 cm. The subsoil has stagnic features and al-lows, therefore, only limited vertical percolation. The matrix
permeabilities are medium to low. Applying the set of rules indicates that SOF 2 is the dominant runoff process. In a soil pit, a barrier to vertical percolation was identified at a depth of 70 cm, and a storage capacity of 68 mm was estimated, which would also mean that SOF 2 is the dominant runoff process.
3.6 Results of the automated process determination At the sites of the 44 soil profiles and core samples taken in the Ror and Isert catchments, the dominant runoff pro-cesses were assessed using the detailed SN decision scheme of Scherrer and Naef (2003), with detailed field data, includ-ing sprinklinclud-ing experiments evaluated at these sites as input. At the same time, the processes at these sites were also deter-mined with the generalized set of rules (Fig. 5). At 67% of the sites, the automatically determined processes and storage classes agreed with the results of the detailed examination of the soil and the sprinkling experiment data. For 31% either the process (24%) or the storage class (7%) were correct. In only one case did both process and storage class differ. Prob-lems occurred mainly in the differentiation between the SOF and SSF areas.
3.7 Evaluation of the automated process determination on the point scale
The dominant runoff process on a plot can be determined through a detailed examination of a soil profile and of sprin-kling experiment data or, if good soil data is available, through using the generalized set of rules (Fig. 5). These rules worked reasonably well on the point scale. Discrepan-cies occurred mostly in the identification of the storage class rather than in the identification of the process itself.
We were able to test the process determination through sprinkling experiments and soil-water-level measurements. The processes were mostly identified correctly and the evalu-ated storage capacities corresponded with the amount of rain-fall needed to saturate the soil.
Where we encountered problems was with the identifica-tion of preferential lateral flow paths in the field and the quan-tification of their lateral flow capacity. In addition, it was not possible to infer the existence of lateral flow paths from the soil map or from maps of geology alone. The automated pro-cess determination therefore uses slope to differentiate be-tween SOF and SSF. However, it is well known that slope is only one factor controlling lateral flow and often not the most important one (e.g. Grayson and Western, 2001).
4 Process delineation in catchments 4.1 Dominant runoff process maps
For the Ror and Isert catchments, the dominant runoff pro-cess maps were automatically derived in a GIS using the
de-Slow Subsurface Flow Fast Subsurface Flow Saturated Overland Flow Hortonian Overland Flow
HOF 1 Susceptible to HOF 2 SSF 3 SSF 2 SSF 1 SOF 3 SOF 2 SOF 1 DP D 3 D 2 D 1
Dominant runoff process
0 250 500 1'000 m
Ror
Isert
N
Fig. 6. Maps of dominant runoff processes in the Ror and Isert
catchment produced with set of rules given in Fig. 5.
veloped set of rules, the Zurich soil map, the forest vegetation map and maps of geology, topography and land use (Fig. 6). The two catchments differ considerably in their DRP dis-tribution even though they are only 3 km apart. In Ror, most soils are influenced by water in the subsoil and show stagnic or gleyic features due to the low permeability of the bedrock. SOF occurs on 55% of the area, while DP occurs only on 2% in areas with thick soils and deep groundwater tables (Fig. 7). In Isert, 27% of the soils lie over permeable gravel deposits or permeable moraine and are not influenced by groundwa-ter, leading to DP as DRP. Only 25% of the Isert catchment is SOF dominated.
In Isert 14% of the catchment is covered with well-developed Parabraunerden (Luvisol, Podzoluvisol) under agricultural use. In Parabraunerden silicate clays have ac-cumulated under an eluvial horizon with clay and carbonate depletion. The illuvial horizon with high clay content re-stricts vertical percolation if the macropores bypassing this layer are disrupted by ploughing. These soils also tend to have unstable topsoil aggregates and are susceptible to soil-surface sealing. HOF 2 or SOF 1 to 3 might occur during high rainfall intensity. Most soils in Ror are less susceptible to soil-surface sealing since carbonate-rich Braunerden and Gleys dominate. An exception are some small areas of silt rich top soils.
Forested or steep, extensively cultivated grassland hill-slopes were classified as SSF areas (8% in Ror and 14% in Isert). 27% of the area in Ror and and 14% in Isert are artifi-cially drained and were classified as D.
0 5 10 15 20 25 30 A re a [ % ]
SOF1 SOF2 SOF3 SSF1,2 and D1,2
SSF3 and D3
DP
Dominant runoff process
Ror Isert
Fig. 7. Percentage of total catchment area assigned to each
domi-nant runoff process in the Ror and Isert catchment according to the set of rules given in Fig. 5.
In the automated process determination, the DRP are de-termined for each soil map unit without taking interactions between neighbouring process areas (e.g. runoff – run-on sit-uations) into account. These interactions are only considered when they influence the soils directly. To study the effect of not considering spatial dependencies in the process deter-mination, the dominant runoff process maps were compared to hydrologically relevant features observed and mapped in the field and by studying individual hillslopes in detail. The procedure used will be illustrated on a 500 m×500 m square (Fig. 8) within the Ror experimental catchment (the location of the square is shown in Fig. 1).
4.2 Mapping of hydrologically relevant features
SOF 1 areas can be identified in the field or from aerial pho-tographs by mapping permanently or often wet areas and swamps. Surface runoff, signs of erosion or ponding water during or after flood events indicate HOF or SOF areas. Re-turn flow, springs and spring horizons help to identify prefer-ential lateral flowpaths and SSF areas.
During the floods in May 1999 and September 2001, sur-face flow was observed in some places (Fig. 8), confirming the SOF 1 or 2 process determination on these areas. Pond-ing water in the center of the test square is also evidence of the SOF process.
4.3 Hillslope interactions between DRP – the process catena
Where a fast reacting upslope area drains onto an area with large storage capacity (delayed reacting area), the runoff from above might be absorbed by or could cause premature saturation of the delayed reacting area. The extent of this
in-540 535 530 525 540 535 530 525 SOF 1 SSF 3 HOF 1 SOF 2 SOF 3 Dominant runoff process
Susceptible to HOF2
Location of process catena
530 Elevation [m asl] 0 100 200 m
Ponding water after heavy rainfall event in Sep. 2 0 0 1 Surface flow observed after heavy rainfall event Surface flow observed during May 1999 flood Stream, pipe, tile drain or closed channel
Fig. 8. Dominant runoff process map of the test square and
hydro-logical relevant features mapped in the field. The location of the process catena (Fig. 9) is shown as well.
fluence was studied on a process catena in the Ror catchment (Fig. 9, location see Fig. 8). On top of the hillslope, SOF 2 occurs because the low permeable moraine prevents vertical percolation and the lateral flow capacity is low to medium (P 5). At profile P 4, slope and soil thickness decrease, re-sulting in quick saturation of the soil and in return flow. Fur-ther downslope (P 3), where the slope increases again and the moraine and molasse material is overlain by more permeable colluvium, the water infiltrates into the thick soil layers and flows laterally in the colluvium. Saturation at P 3 was ob-served only after more than 150 mm of rainfall within 2 days. The process in this area is therefore either SOF 3 or SSF 3.
Further downslope the colluvium decreases in thickness and grain size, the slopes become gentler and bedrock changes to molasse, overlain with a thin layer of loamy col-luvium with low permeability. In the upper part of this area, SOF 3 is dominant, while in the lower part at P 2, SOF 2 was identified. Close to the river (P 1) groundwater levels are high and soils often saturated. The observed water lev-els suggest that the few tile drains are not able to drain the soil during flood events, resulting in SOF 1 as the dominant runoff process.
In the test catchments, the process catena consideration is of minor importance since the runoff run-on situation only occurs in small areas which are mostly very well drained (of-ten artificially). Considering the process ca(of-tena brought only marginal changes to the DRP mapping.
Two theoretical considerations suggest that the problem of not considering spatial dependencies in the DRP mapping is less severe than might be expected. First of all, runoff processes are not only a result of soil properties but soil de-velopment along a hillslope also results from the way water moves through the soil (Lin et al., 2005). Therefore, some of the hydrologic hillslope interactions are already captured in the soil and consequently in the DRP mapping. Secondly, for heavy rainfall and large flood events, the premature con-tribution of the downslope area often compensates for the
30 m 20 m 10 m 50 m 100 m 150 m 200 m P1 P 2 P 3 P 4 P 5 SOF 1 tile drains SOF 2 SOF 1 SOF 3 SOF 2 SOF 3 SSF 3 SSF 3/SOF 3 Thick layer of permeable c
ateral flow is possible. olluvium has high infiltration and storage capacity. Some l
SOF 3 and SOF 2 Gentler slopes, thickness of permeable colluvium and storage capacity of
soil decreases downslope. SOF 1
Permanently high groundwater levels. Some tile drains exist but are not efficient enough to prevent saturation of the soil during flood events.
SOF 1 Shallow soil over impermeable bedrock. Water table permanently close to soil surface. Return flow possible. SOF 2
Clayey moraine is barrier to vertical percolation and n
Therefore, subsoil is often saturated and SOF 2 occurs.
o preferential lateral
flowpaths exist. Upper Freshwater Molasse
Colluvium Moraine
Alluvium
Permanently saturated soil Stream
Dominant runoff process
Piezometer Tile drains
Runoff process of minor importance P 3
Fig. 9. Process catena in Ror catchment (Location see Fig. 8).
reduced contribution of the upslope area. Alternatively the surface runoff from the upslope area may even bypass the downslope area via preferential surface flow.
4.4 Evaluation of the process delineation in catchments In the Isert and Ror catchments, the dominant runoff pro-cesses were delineated automatically with a GIS using the set of rules applied to soil maps and other kinds of maps. The derived process maps were confirmed at most places by hydrologic field observations and the soil-water levels mea-sured.
Maps of dominant runoff processes show the potential of each area to contribute to runoff. The actual contribution of an area to streamflow depends on its connection to the river network. A DRP map shows therefore “active areas” as de-fined by Ambroise (2004), and not necessarily contributing areas. Active and contributing areas both generate runoff, but not all active areas contribute to total catchment outflow, as water might reinfiltrate or be held back in depressions. To deal with this problem the interactions between process areas and their connectivity to the river network have to be consid-ered. However, this is subject to ongoing research. In the Isert and Ror catchments, however, the active and contribut-ing area coincide due to the high drainage density, the short hillslopes and the runoff process distribution. The presented automatic, GIS based method can be applied to catchments of any size, if maps and data in digital form exist. For ex-ample, a DRP map was produced for the Canton of Zurich
with an area of 1730 km2(Naef et al., 2007). If no soil map is available, the necessary data to use the SN scheme have to be collected in the field. Up to now, Dominant Runoff Processes (DRP) maps have been produced for more than 40 catchments in Switzerland, Germany and Chile with areas between 1 km2and 300 km2.
5 DRP maps and catchment reaction to intense precipi-tation
Heavy rainfall, corresponding to a 15 to 30 year event, oc-curred between 11 and 13 of May 1999 on the Aabach catchment (Fig. 10). 74 mm of rainfall were measured at Gr¨uningen in one day and 150 mm in three days (SMA, 1999). In M¨onchaltdorf, the highest discharge of the 23-year measurement period (46.5 m3s−1or 1 m3s−1km−2)was
ob-served in the Aabach.
Ror received 30 mm less rainfall than Isert. However, the specific peak discharge was three times higher in Ror than in Isert (1.2 m3s−1km−2in Ror, 0.4 m3s−1km−2in Isert) and
the volumetric runoff coefficient in Ror (0.58) was twice the coefficient of Isert (0.25).
The different distributions of DRP in the two catchments explain these differences. In Isert, one third of the area con-sists of DP, which hardly contributes to runoff. Delayed re-acting processes like D 3, SSF 3 and SOF 3 cover another 50% of the area. Only 5% are fast reacting SOF 1 and SOF 2 areas. In Ror, on the other hand, 31% are SOF 1 or SOF 2
0.0 0.2 0.4 0.6 0.8 1.0 0 50 100 150 200 250 11.05.1999 00:00 12.05.1999 00:00 13.05.1999 00:00 14.05.1999 00:00 15.05.1999 00:00 0 20 40 60 80 100 120 S tre a m ru n o ff [ m 3s -1km 2] 0 1 2 3 4 5 R a in fa ll in te n s it y [ m m /1 0 m in ] C u m u la ti v e r a in fa ll [m m ] Ror Isert Ror Isert Observed Calculated Ror Isert C u m u la ti ve r u n o ff [ m m ] (a) (b) (c)
Fig. 10. The May 1999 flood event in the Ror and Isert catchment.
Displayed are the rainfall intensity and sum of rainfall (a), runoff
(b) and observed and calculated sum of runoff (c).
areas, another 22% are SSF/D 1 or 2 areas, while little DP occurs (2%).
A DRP map contains information about the water storage capacity of the soils in the catchment. It can therefore be used to quantify how much of the rainfall becomes runoff during a flood event, which is also called the runoff coefficient. On ar-eas with runoff process HOF, no significant amounts of water can be stored, while on areas with runoff process DP, prac-tically all water is stored during the event and released re-tarded. For all other runoff processes, three water storage classes were distinguished during the mapping. Soils with storage class 1 store 0 to 40 mm of water, soils with storage class 2 store 40 to 100 mm and soils with storage class 3 store 100 to 200 mm.
Based on the information about the storage capacities of the different DRP, we calculated the runoff coefficient us-ing a storage capacity of 5 mm for HOF areas and of 20 mm, 70 mm and 150 mm for areas with storage classes 1, 2, and 3, respectively, (mid-point of each of the three storage classes). DP areas do not contribute. The process areas from the DRP maps and the storage capacities were then used to calculate flood runoff volumes of the 1999 flood event and 16 smaller flood events in the Ror and Isert catchments. For the calcu-lations, event rainfall is cumulated. When the sum of rainfall exceeds the soil storage capacity of the respective process, runoff occurs. To reflect the initial wetness of the soil, the soil storages were filled with the 5 day pre-event rainfall dur-ing summer (May–September) and the 10 day pre-event rain-fall during winter (October–April).
0 20 40 60 80 100 0 20 40 60 80 100
Observed runoff volume [mm]
C a lc u la te d r u n o ff v o lu m e [ m m ] Lindist Rinderholz x = y
Fig. 11. Observed and calculated runoff volumes for all flood events
between summer 2001 and fall 2003 with a specific peak discharge larger than 0.2 m3*s−1*km−2in Lindist and Rinderholz.
In Ror the calculated 1999 flood runoff volume amounts to 100 mm or 50% of rainfall, and in Isert to 70 mm or 35% (Fig. 10c). Although runoff was slightly underestimated in the Ror catchment and overestimated in the Isert catchment, it was possible to quantitatively capture the differences in runoff volumes between the two catchments.
Flood volumes were also calculated for 16 events in the Lindist and Rinderholz sub-catchments. They were then compared to the measured flood volumes (Fig. 11). The sub-tracted baseflow was assumed constant through the event. Measured and calculated runoff volumes correspond quite well. The water storage capacity information contained in the DRP maps therefore allows a direct estimation of flood volumes from rainfall.
In these examples, only the information on storage capac-ity contained in the DRP maps was used. However, addi-tional information on lateral flow or infiltration can be ex-tracted from the maps and used for process based rainfall-runoff modelling, as shown by Schmocker-Fackel (2004).
6 Summary and conclusions
Process research on different scales has shown that runoff formation during intense precipitation is immensely variable and that the interactions involved are complex. Scherrer and Naef (2003) developed a decision scheme to classify this wide range of observed processes and determine the domi-nant runoff processes on natural soils in a robust way. How-ever, several of the parameters used have to be determined on the soil profile or in the laboratory.
In this paper, the complex decision scheme was simplified so that it would only require data from detailed soil maps, and from maps of geology, forest, vegetation, topography and land use. The new scheme was transformed into a set of rules to allow automatic process identification in a GIS. Thus it can be used to map the dominant runoff processes in larger areas. The method was tested in two catchments on the Swiss plateau and compared well with maps derived manually with the original decision scheme. Some problems occurred with the identification of SSF areas because parameters like pref-erential lateral flow paths could not be substituted for and needed to be replaced with parameters found in the soil map. In addition, the water storage capacity of each process was defined using again only parameters from the soil map. Start-ing from the mapped extent of the different process areas and their corresponding storage capacities, the runoff generation during flood events could be quantitatively reproduced with a simple procedure.
Maps of dominant runoff processes are a powerful tool to help understand the hydrology of a catchment and its reac-tions to intense precipitation. When fast processes like HOF or SOF 1 or 2 dominate, time to peak will be short and spe-cific discharges high. On the other hand, large areas with delayed processes like SOF 3, SSF or DP will lead to a slow rise of the hydrograph. The main benefit of such maps, how-ever, is that they can be used to quantify storm runoff directly and to define the infiltration parameters in rainfall – runoff models calibration procedures.
Some open questions remain, like the interaction between process areas and how they are connected to the river net-work or the identification of subsurface flow mechanisms and methods to identify them in the field. Also the importance of groundwater contributions to rapid runoff as found by Haria and Shand (2004) might have to be considered. Linking the DRP process maps to tracer investigations in a catchment as done by Soulsby et al. (2006b) is another promising field of research. Despite these questions, we think that the presented method meets the major challenge to hydrologists as defined by Sidle (2006) of how to address hydrological processes at changing spatial and temporal scales.
Acknowledgements. This study was funded by the ETH Zurich,
the Swiss Federal Office of Agriculture and the WarReLa Project (Water Retention by Land Use) in the framework of the INTEREG IIIB Programme. The spatial data used was kindly made available by the Canton of Zurich and Swiss Topo. We are grateful to A. Gericke, T. Keller, M. Margreth, F. Oberrauch, M. ten Voorde and R. van den Bos for their support in the field and laboratory and to S. Dingwall for the English editing of this paper.
Edited by: J. D. Kalma
References
AG Boden: Bodenkundliche Kartieranleitung, Bundesanstalt f¨ur Geowissenschaften und Rohstoffe und den Geologischen Lan-des¨amtern in der Bundesrepublik Deutschland, Hannover, 392 p., 1994.
Ambroise, B.: Variable “active” versus “contributing” areas or peri-ods: a necessary distinction, Hydrol. Processes, 18, 1149–1155, 2004.
Anderson, M. G. and Burt, T. P: Process Studies in Hillslope Hy-drology, John Wiley & Sons, Chichester, 1–8, 1990.
Beven, K.: How far can we go in distributed hydrological mod-elling?, Hydrol. Earth Syst. Sci., 5(1), 1–12, 2001.
Bl¨oschl, G.: Rainfall-runoff Modelling of Ungauged Catchments, edited by: Anderson, M. G. and McDonnell, J. J., Encyclopedia of Hydrol. Sci., 133, John Wiley & Sons, Ltd., 2061–2080, 2005. Boorman, D. B., Hollis, J. M., and Lilly, A.: Hydrology of soil types: a hydrologically based classification of the soils of the United Kingdom, 126, Institute of Hydrology, Wallingford, 1995.
Buttle, J. M. and McDonald, D. J.: Coupled vertical and lateral preferential flow on a forested slope, Water Resour. Res., 38(5), 1060, doi:10.1029/2001WR000773, 2002.
Dunn, S. M. and Lilly, A.: Investigating the relationship between a soils classification and the spatial parameters of a conceptual catchment-scale hydrological model, J. Hydrol., 252, 157–173, 2001.
FAL: Bodenkarte Kanton Z¨urich, Landwirtschaftsfl¨achen 1:5000, Volkswirtschaftsdirektion des Kantons Z¨urich, Z¨urich, 1997. Haering, C., J¨ackli, H., Kobel, M:, K¨undig, R., Lienert, O., Philipp,
R., Starck, P., and Wyssling, L.: Hydrogeologische Karte der Schweiz 1:100 000, Blatt Nr. 5 Toggenburg, Schweizerische Geotechnische Kommission, ETH-Zentrum, Z¨urich, 1993. Hantke, R., Kappeler, S., B¨achtiger, K., et al.: Geologische Karte
des Kantons Z¨urich und seiner Nachbargebiete 1:50 000, Kom-missionsverlag Leemann, Z¨urich, 1967.
Geologischer Atlas der Schweiz: Blatt 226 M¨onchaltdorf, 1934. Grayson, R. B. and Western, A. W.: Terrain and the distribution of
soil moisture, Hydrol. Proc., 15(13), 2689–2690, 2001. Grayson, R., Moore, I. D., and McMahon, T. A.: Physically based
hydrologic modelling. 2, Is the concept realistic?, Water Resour. Res., 26(10), 2659–2666, 1992.
Haria, A. H. and Shand, P.: Evidence for deep sub-surface flow routing in forested upland Wales: implications for contaminant transport and stream flow generation, Hydrol. Earth Syst. Sci., 8, 334–344, 2004,
http://www.hydrol-earth-syst-sci.net/8/334/2004/.
Kanton Z¨urich: Hydrologisches Jahrbuch, AWEL, Amt f¨ur Abfall, Wasser, Energie und Luft, 2000.
Kanton Z¨urich: Kommentar zur vegetationskundlichen Kartierung der W¨alder im Kanton Z¨urich, Forstkreis 2. Kanton Z¨urich, Oberforstamt und Amt f¨ur Raumplanung, Z¨urich, 1988. Leu, C. M., Singer, H., Stamm, C., M¨uller, S. R., and
Schwarzen-bach, R. P.: Simultaneous assessment of sources, processes, and factors influencing herbicide losses to surface waters in a small agricultural catchment, Environ. Sci. Technol., 38, 3827–3834, 2004.
Lin, H. S., Bouma J., Wilding L., Richardson J., Kut´ılek M., and Nielsen D.: Advances in hydropedology, Adv. Agron., 85, 1–89, 2005.
McDonnell, J. J.: Where does water go when it rains? Moving be-yond the variable source area concept of rainfall-runoff response, Hydrol. Processes, 17, 1869–1875, 2003.
McGlynn, B. L. and McDonnell, J. J.: Role of discrete landscape units in controlling catchment dissolved organic dynamics, Water Resour. Res., 39(4), 1090–1117, 2003.
Merz, J. and Mosley, M. P.: Hydrological behaviour of pastoral hill country modified by extensive landsliding, northern Hawkes’s Bay, New Zealand, J. Hydrol. (NZ), 37(2), 113–139, 1998. Naef, F.: Can we model the rainfall-runoff process today?, Hydrol.
Sci. Bull., 26(3), 281–289, 1981.
Naef, F., Scherrer, S., and Faeh, A.: Die Auswirkungen des R¨uckhalteverm¨ogens nat¨urlicher Einzugsgebiete bei extremen Niederschlagsereignissen auf die Gr¨osse extremer Hochwasser, Schlussbericht/NFP 31, Vdf Hochschulverlag an der ETH, Z¨urich, 1998.
Naef, F., Margreth, M., Schmocker-Fackel, P., Scherrer, S.: Automatisch hergeleitete Abflussprozesskarten – ein neues Werkzeug zur Absch¨atzung von Hochwasserabfl¨ussen, Wasser Energie Luft, 1/2, 2007, in press, 2007.
Peschke, G., Etzenberg, C., T¨opfer, J., Zimmermann, S., and M¨uller, G.: Runoff generation regionalization: analysis and a possible approach to a solution, IAHS Publ. 254 (Regionaliza-tion in Hydrology), 147–156, 1999.
Scherrer, S.: Abflussbildung bei Starkniederschl¨agen. Identifikation von Abflussprozessen mittels k¨unstlicher Niederschl¨age, 147, VAW – Versuchsanstalt f¨ur Wasserbau, Hydrologie und Glazi-ologie der ETH Z¨urich, Z¨urich, 1997.
Scherrer, S. and Naef, F.: A decision scheme to identify dominant flow processes at the plot-scale for the evaluation of contribut-ing areas at the catchments-scale, Hydrol. Proc., 17(2), 391–401, 2003.
Scherrer, S., Naef, F., Faeh, A. O., and Cordery, I.: Formation of runoff at the hillslope scale during intense precipitation, Hydrol. Earth Syst. Sci. Discuss., 3, 2523–2558, 2006,
http://www.hydrol-earth-syst-sci-discuss.net/3/2523/2006/. Schmocker-Fackel, P.: A method to delineate runoff
pro-cesses in a catchment and its implications for runoff sim-ulations, Diss., Swiss Federal Institute of Technology, ETH Z¨urich, Nr. 15638, http://e-collection.ethbib.ethz.ch/show?type= diss&nr=15638, 2004.
Sidle, R. C., Tsuboyama, Y., Noguchi, S., Hosoda, I., Motohisa, F., and Shimuizu, T.: Stormflow generation in steep forested head-waters: a linked hydrogeomorphic paradigm, Hydrol. Processes, 14, 369–385, 2000.
Sidle, R. C.: Field observations and process understanding in hy-drology: essential components in scaling, Hydrol. Processes, 20, 1439–1445, 2006.
Sivapalan, M., Takeuch,i K., Franks, S.W., Gupta, V.K., Karam-biri, H., Lakshmi, V., Liang, X., McDonnell, J. J., Mendiondo, E. M., O’Connell, P. E., Oki, T., Pomeroy, J. W., Schertzer, D., Uhlenbrook, S., and Zehe, E.: IAHS decade on Predictions in Ungauged Basins (PUB), 2003–2012: Shaping an exciting fu-ture for the hydrological sciences, Hydrol. Sci. J., 48, 857–880, 2003.
Soulsby, C., Tetzlaff, D., Dunn, S. M., and Waldron, S.: Scaling up and out in runoff process understanding – insights from nested experimental catchment studies, Hydrol. Processes, 20, 2461– 2465, 2006a.
Soulsby, C., Tetzlaff, D., Rodgers, P., Dunn, S., and Waldron, S.: Runoff processes,streamwater residence times and controlling landscape characteristics in a mesoscale catchment: an initial as-sessment, J. Hydrol., 325, 197–221, 2006b.
Titmarsh, G. W., Cordery, I., and Pilgrim, D. H.: Calibration proce-dures for rational and USSCS design flood methods, J. Hydraul. Eng., 121, 1, 61–70, 1995.
Uhlenbrook, S., Roser, S., and Tilch, N.: Hydrological process rep-resentation at the meso-scale: the potential of a distributed, con-ceptual catchment model, J. Hydrol., 291, 278–296, 2004. USDA-SCS (U.S. Department of Agriculture-Soil Conservation
Service): National Engineering Handbook, Section 4, Hydrol-ogy, U.S. Dept. of Agriculture, Washington D.C., 1985. Weiler, M., McDonnell, J. J., Tromp-van Meerveld, I., and Uchida,
T.: Subsurface Stormflow, edited by: Anderson, M. G. and Mc-Donnell, J. J., Encyclopedia of Hydrol. Sci., Chapter 112, John Wiley & Sons, Ltd., 1719–1733, 2005.
Weiler, M. and Naef, F.: Simulating surface and subsurface initia-tion of macropore flow, J. Hydrol., 273, 139–154, 2003.