HAL Id: hal-00304628
https://hal.archives-ouvertes.fr/hal-00304628
Submitted on 1 Jan 2001HAL is a multi-disciplinary open access archive for the deposit and dissemination of sci-entific research documents, whether they are pub-lished or not. The documents may come from teaching and research institutions in France or abroad, or from public or private research centers.
L’archive ouverte pluridisciplinaire HAL, est destinée au dépôt et à la diffusion de documents scientifiques de niveau recherche, publiés ou non, émanant des établissements d’enseignement et de recherche français ou étrangers, des laboratoires publics ou privés.
on soil and run-off chemistry at Risdalsheia, Norway
J. P. Mol-Dijkstra, H. Kros
To cite this version:
J. P. Mol-Dijkstra, H. Kros. Modelling effects of acid deposition and climate change on soil and run-off chemistry at Risdalsheia, Norway. Hydrology and Earth System Sciences Discussions, European Geosciences Union, 2001, 5 (3), pp.487-498. �hal-00304628�
Modelling effects of acid deposition and climate change on soil
and run-off chemistry at Risdalsheia, Norway
J.P. Mol-Dijkstra and H. Kros
DLO-Alterra, Green World Research, P.O. Box 47NL-6700 AA Wageningen, The Netherlands Email for corresponding author: [email protected]
Abstract
Elevated carbon dioxide levels, caused by anthropogenic emissions of carbon dioxide to the atmosphere, and higher temperature may lead to increased plant growth and uptake of nitrogen, but increased temperature may lead to increased nitrogen mineralisation causing enhanced nitrogen leaching. The overall result of both counteracting effects is largely unknown. To gain insight into the long-term effects, the geochemical model SMART2 was applied using data from the catchment-scale experiments of the RAIN and CLIMEX projects, conducted on boreal forest ecosystems at Risdalsheia, southern Norway. These unique experiments at the ecosystem scale provide information on the short-term effects and interactions of nitrogen deposition and increased temperature and carbon dioxide on carbon and nitrogen cycling and especially the run-off chemistry. To predict changes in soil processes in response to climate change, the model was extended by including the temperature effect on mineralisation, nitrification, denitrification, aluminium dissolution and mineral weathering. The extended model was tested on the two manipulated catchments at Risdalsheia and long-term effects were evaluated by performing long-time runs. The effects of climate change treatment, which resulted in increased nitrogen fluxes at both catchments, were slightly overestimated by SMART2. The temperature dependency of mineralisation was simulated adequately but the temperature effect on nitrification was slightly overestimated. Monitored changes in base cation concentrations and pH were quite well simulated with SMART2. The long-term simulations indicate that the increase in nitrogen run-off is only a temporary effect; in the long-term, no effect on total nitrogen leaching is predicted. At higher deposition levels the temporary increase in nitrogen leaching lasts longer than at low deposition. Contrary to nitrogen leaching, temperature increase leads to a permanent decrease in aluminium concentrations and pH.
Keywords: elevated carbon dioxide, temperature, forest ecosystem, modelling, nitrogen run-off.
Introduction
Emissions of carbon dioxide (CO2) and other greenhouse gases to the atmosphere may lead to an increase in global temperature over the next few decades. The largest changes are expected at high latitudes (Houghton et al., 1990). Primary productivity in boreal ecosystems has increased in large regions of northern Europe and eastern North America due to enhanced nitrogen (N) deposition, since these systems are N-limited (Kauppi et al., 1992). Higher CO2 concentrations may lead to increased plant growth, carbon (C) sequestration and uptake of N. Increased temperatures, on the other hand, may lead to increased mineralisation (Stanford et al., 1973; Edwards, 1975), causing CO2 production and enhanced N leaching. The overall result, particularly the long-term effects, are largely unknown.
Large-scale whole-ecosystem experiments provide a tool to study the response of ecosystems and to evaluate geochemical models that include global change processes. At Risdalsheia, southern Norway, the effects and interactions of N deposition, increased temperature and CO2 on C and N cycling and especially on the run-off chemistry have been examined using catchment-scale experiments on boreal forest ecosystems (Van Breemen et al. 1998; Wright, 1998). Run-off chemistry is of particular interest since it provides a sensitive integrated signal of change in terrestrial catchments while changes in the internal N cycle are often difficult to discern directly due to spatial and temporal variability.
To quantify the impacts of acid deposition, land use and climate change at large (regional to national) scale,
simulation models are being used. The models MERLIN (Wright et al., 1998b) and MAGIC7 (Wright et al., 1998a) have been applied at Risdalsheia to determine the effects of climate change on run-off chemistry and the same data set has been used to apply SMART2. SMART2 has been developed to integrate soil acidification processes and nutrient cycling and to predict long-term effects of acid deposition scenarios on a national and continental scale. To quantify the effects of climate change on soil processes, the effect of temperature on these processes was included to integrate effects of climate change, acid deposition and nutrient cycling in a quantitative way. This extended version of SMART has also been applied on the European scale (Ferrier and Helliwell, 2000).
In this paper, the enhanced SMART2 model is evaluated using the control and the manipulated catchments at Risdalsheia. The Risdalsheia experimental catchments are very suitable for application of SMART2 because the experimental design of the catchments corresponds with the temporal and spatial resolution of the model output. Annual fluxes of solutes in run-off are used corresponding to the time step of one year used by SMART2 (Wright, 1998). The aims are to: (i) test the hypothesised temperature effects by calibration and validation of the model on a manipulated catchment, and (ii) evaluate long-term effects of climate change on C and N cycling and especially on N run-off.
To test the temperature effect in SMART2, the model was first calibrated at the control catchment ROLF and next, after the incorporation of the temperature effect, at the EGIL catchment where soil temperature was increased. Finally, the model was evaluated at the KIM catchment which was subjected to elevated air temperature and CO2-pressure. The effect of deposition reduction was only evaluated at the KIM catchment. Long-term effects of deposition reduction, temperature rise and increase of CO2-pressure were evaluated by extrapolating the existing treatments at Risdalsheia for 30 years.
Site description and manipulation
experiments
SITE DESCRIPTION
Risdalsheia is located near Grimstad, southern Norway, (58°23’N, 8°19’E) at 300 m above sea level (Wright et al., 1998a). The site is representative of large areas of upland southern Norway. Mean annual precipitation is 1400 mm, run-off is 1200 mm and mean annual temperature is 5°C (mean of –3°C in January and +16°C in July). Vegetation is mainly a sparse cover of pine (Pinus sylvestris L.) and birch (Betula pubescens L.) with heather (Calluna Vulgaris L.)
and blueberry (Vaccinium myrtillus L.) as dominant ground species. Risdalsheia receives relatively high levels of acid deposition with mean values for 1984–1992 of 113 meq S m-2 yr-1 and 132 meq N m-2 yr-1 (Wright et al., 1993).
MANIPULATION EXPERIMENTS
Two sets of manipulation experiments have been conducted at Risdalsheia (Table 1). The first set of experiments (the RAIN-project; Reversing Acidification In Norway) entailed exclusion of ambient N and S deposition (Wright et al., 1993) at the roofed KIM catchment from June 1984 until August 1999. The roofed EGIL catchment received recycled ambient acid rain. The uncovered catchment ROLF served as outside control. The decrease in sulphur (S) and N deposition resulted in a strong decrease of sulphate (SO4) and N concentrations in the run-off, accompanied by decrease in base cation concentrations and increase in acid neutralising capacity (ANC) (Wright et al., 1993; Wright and Jenkins, 2001).
The second set of experiments (the CLIMEX-project; Climate change experiment) began in April 1994 and involved manipulation with CO2 and temperature. These new treatments (Dise and Jenkins, 1995) were superimposed on the ongoing RAIN treatments. Both the KIM catchment and the EGIL catchment were divided into a treatment section and a control section. At the KIM catchment, CO2 was added to the air during the growing season at target concentration of 560 ppm and the air was warmed by +5°C in January and +3°C in July, with intermediate temperature during the intervening months. Run-off chemistry of both treatment sections was analysed. Wright (1998) found increased nitrate (NO3) and ammonium (NH4) concentrations in run-off in response to elevated temperature. At the EGIL catchment, the soil was warmed by means of electric heating cables placed beneath the litter in the treatment section, resulting in an average soil
Table 1. Overview of the treatments at the catchments at
Risdalsheia in the CLIMEX project
Deposition1 Climate2
ROLF Control Ambient None
EGIL Control Ambient None
Treatment Ambient Soil warming
KIM Control Clean None
Treatment Clean CO2+air warming
1 Deposition manipulation started in 1984 2 Climate manipulation started in 1994
temperature rise of 3.7°C at 5 cm depth during the first three years of treatment. The run-off chemistry was analysed only in the treatment section of the EGIL catchment. Lükewille and Wright (1997) found a significant increase in N concentrations in run-off in response to elevated soil temperature during the first 15 months of treatment.
At the EGIL catchment, there was no change in growth or biomass of the shrubs or pine trees and no change in N concentrations in the shrub foliage (Arp, pers. comm.). Beier and Rasmussen (1997) found a small increase in N concentrations in pine needles at both catchments. Arp and Berendse (1997) found a small increase in growth of the shrubs at the KIM catchment.
Mineralisation and nitrification measurements were performed for three years: one control year (1994) and two treatment years (1995 and 1996). Verburg (1998) and Verburg et al. (1999) found an increase in net N-mineralisation and nitrification due to climate change, but variability was high. At the EGIL catchment there was no significant change in mineralisation and nitrification. At the KIM catchment the increase in net mineralisation was significant. Decomposition rates of fresh litter were not affected by temperature and CO2 treatments.
Modelling approach
MODEL DESCRIPTION
SMART2 (Kros et al., 1995) is a simple one-compartment soil acidification and nutrient cycling model that includes the major hydrological and biogeochemical processes in the vegetation, litter and mineral soil. Apart from pH, the model also predicts changes in aluminium (Al), divalent base cations (BC2, i.e. Magnesium (Mg) + Calcium (Ca)), monovalent base cations (BC, i.e. sodium (Na) + potassium (K)), NO3, SO4, chloride (Cl) and bicarbonate (HCO3) concentrations in the soil solution and solid phase characteristics that reflect the acid-base status of the soil, i.e. carbonate content, base saturation and readily available Al content. The SMART2 model consists of a set of mass balance equations, describing the soil input-output relationships and a set of equations describing the rate-limited and equilibrium soil processes.
The soil solution chemistry in SMART2 depends on the net element input from the atmosphere (the product of deposition and filtering factor) and groundwater (seepage), canopy interactions (foliar uptake, foliar exudation), geochemical interactions in the soil (CO2 equilibria, weathering of carbonates, silicates and/or Al-hydroxides, SO4 sorption and cation exchange) and a complete nutrient cycle (litterfall, mineralisation, root uptake, immobilisation,
nitrification and denitrification) for base cations and N. Litterfall and growth of the vegetation are modelled by a logistic growth function, which acts as a forcing function for nutrient uptake. Nutrient uptake is only limited when there is a shortage in the soil solution. Mineralisation of fresh litter is set as a fraction of the input of litterfall and root decay in the litter compartment. The remaining fresh litter is transferred to the old litter pool. The mineralisation flux of NH4, K and BC2 from this litter pool (Xmi lt) is described by first order kinetics (Van Veen, 1977):
lt lt milt lt mi
k
Am
ct
X
X
=
⋅
⋅
(1)where Xmi lt is mineralisation flux of element X from old litter (molc kg-1 yr-1), k
milt is the mineralisation rate constant
from old litter (yr-1), Am
lt is amount of old litter (kg ha
-1)
and ctXlt is content of element X in old litter (molc kg-1).
The nutrient cycling factor (ncf) is defined as the total root turnover of N divided by the aboveground litter production of N. Nitrification and denitrification for the complete soil layer are described as a fraction of the net N input (deposition and mineralisation minus root uptake and immobilisation). In the model, factors such as pH in the organic layer and moisture content influences nitrification and denitrification, but not weathering and exchange reactions, nor in this application mineralisation.
MODEL ADAPTATION
The effect of temperature was considered for: (i) the mineralisation of old litter, nitrification and denitrification; (ii) Al hydroxide dissolution; and (iii) weathering of primary minerals. A direct temperature effect on growth was not included because observations did not clearly indicate a change in growth (Van Breemen et al., 1998) and the effects of temperature rise and increase of CO2 on growth are still ambiguous (Mohren, pers. comm.). There might be, however, an indirect effect of temperature on growth due to a larger N availability as a result of increased mineralisation. In SMART2, this would increase N uptake but not biomass, so the N-content in biomass would increase to a maximum level.
The same dependency was chosen for mineralisation, nitrification and denitrification, as the temperature dependencies of these processes are similar. The temperature effect on N mineralisation is often described by a Q10 function. Kätterer et al. (1998) and Stanford et al. (1973) found Q10 values between 2.0 and 2.5. Kirschbaum (1995) found a temperature dependent Q10 for mineralisation with higher values at lower temperatures, which is in agreement with Ross and Bridger (1978).
The temperature dependency of nitrification (cf. Grundmann et al., 1995; Stark, 1996) and denitrification (Grant, 1991; Nômmik and Larson, 1989) are mostly described by an Arrhenius equation. A Q10 function is, however, also used (e.g. Knowles, 1982, who gives in a review Q10 values of 1.5 to 3.0 for denitrification). To have a comparable description, a Q10 function was selected for all three micro biological processes as:
10 ) ( 10 * ) ( ) ( Tref T ref Q T X T X − = (2)
where X represents either the mineralisation rate constant of old litter (yr-1), or the nitrification factor or the
denitrification factor (–), T is temperature (K) and Tref is the reference temperature (K). For all these N transformation processes, an optimum Q10 value of 1.6 was obtained. The temperature effect on mineralisation refers to the mineralisation of old litter, because the decomposition rate of fresh litter was not different under the different treatments (Verburg, 1998).
For the Al oxide dissolution the temperature dependency was described by Van’t Hoff’s equation (e.g. Stumm and Morgan, 1981): ) 1 1 ( 303 . 2 ) ( ) ( T T R H T K T K ref ref Alox ox Al − ∆ + = o (3)
where KAl ox is log10 of Al oxide dissolution constant (-),
∆H° is reaction enthalpy (= –95.5 kJ mol-1) and R is the gas
constant (8.3·10-3 kJ mol-1 K-1). Temperature rise will lead
to a decrease of KAl ox.
The temperature effect on weathering rates was described as (Sverdrup, pers. comm.):
) 1 1 ( * 3600
*
)
(
)
(
we ref Tref T weT
X
T
e
X
−=
(4)where Xwe is weathering rate (eq m-3 yr-1). A temperature
increase from 5°C to 8.7°C implies an increase of weathering of 20%. The effect of increased CO2 pressure was not included for the biochemical processes, but for the geochemical equilibria pCO2 is included. The pCO2 in soil air was calculated as a factor of the pCO2 in the atmosphere. Consequently, increase in CO2 pressure in the atmosphere directly implies an increase in pCO2 in soil air.
MODEL PARAMETERISATION
To test the model and the included temperature dependencies, SMART2 was applied to two catchment experiments at Risdalsheia. For simulation of the concentrations of different elements in run-off, the model was calibrated at the ROLF catchment. The Al oxide
dissolution constant, the mineralisation constant and the nitrification factor were calibrated manually using the concentrations of NO3, NH4, BC2 and Al and pH in the run-off. The inclusion of temperature-dependencies of N-processes and of the Al oxide dissolution constant was tested from 1995, the year the temperature rise started at the EGIL catchment. SMART2 was validated for both temperature and deposition changes by applying it at the KIM catchment. The soil parameters were either derived from measurements (Wright et al., 1993) or from the MAGIC7 calibration at Risdalsheia (Wright et al., 1998a) (Table 2). The selectivity constant for Al-BC exchange (KAlex) was calculated by using Gaines-Thomas equations:
3 2 2 3 2 3 ] BC [ ] Al [ Al BC2 Al + + ⋅ = ac ac ex fr fr K (5)
and for H-BC exchange (KHex) by:
] BC [ ] H [ H BC2 H 2 2 2 + + ⋅ = ac ac ex fr fr K (6)
where frXac is the fraction of the adsorbed element X, [X] is concentration of element X. The adsorbed fractions and run-off concentrations were derived from Wright et al. (1993). Averages of measured absorbed fractions and concentrations at the three catchments were used.
The vegetation parameters (Table 2) were taken either from measurements or from estimates. For shrubs, data were derived from Arp and Berendse (1997) and Arp (pers. comm.), while for trees the data were based on Beier and Rasmussen (1997) and Beier (pers. comm.). Parameters that were not measured or estimated at Risdalsheia were taken from Kros et al. (1995) using the values for heather. The measured aboveground litterfall of the shrubs (Arp, pers. comm.) and of the trees (Beier, pers. comm.) were summed. The root turnover was calculated using the measured litterfall and assuming a nutrient cycling factor (ncf) of 0.5 for trees and a ncf of 3.0 for shrubs (Kros et al., 1995). These amounts of litterfall in combination with these nutrient cycling factors resulted in a biomass weighted average ncf of 1.8. At the EGIL catchment, N-mineralisation fluxes were 10–15% higher than the measured N mineralisation fluxes. (Table 3). The total litterfall values are much lower (approximately less by half) than the values mentioned in Wright et al. (1998b) who only used estimates since measurements were not available at that time.
The influence of soil solution pH on mineralisation was excluded because it had too strong a positive feedback: increased pH which in turn increased mineralisation, causing an unrealistic overestimation of the N concentration. Furthermore, experimental support for the positive feed-back of pH on mineralisation is rather weak.
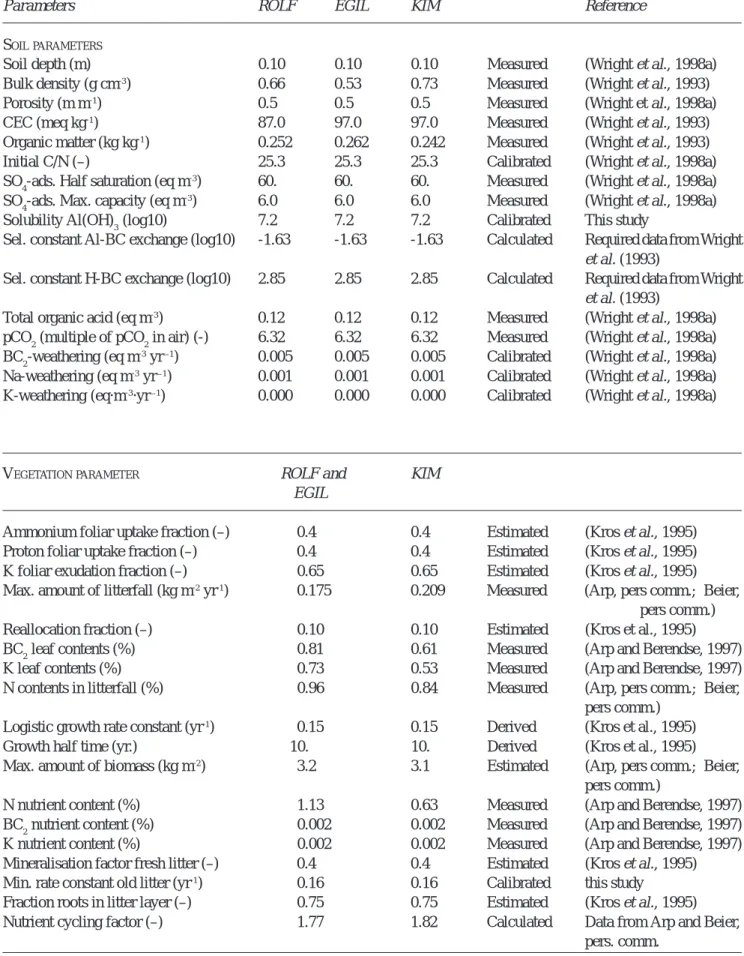
Table 2. Fixed parameters for KIM and EGIL used in calibration of SMART2.
Parameters ROLF EGIL KIM Reference
SOILPARAMETERS
Soil depth (m) 0.10 0.10 0.10 Measured (Wright et al., 1998a)
Bulk density (g cm-3) 0.66 0.53 0.73 Measured (Wright et al., 1993)
Porosity (m m-1) 0.5 0.5 0.5 Measured (Wright et al., 1998a)
CEC (meq kg-1) 87.0 97.0 97.0 Measured (Wright et al., 1993)
Organic matter (kg kg-1) 0.252 0.262 0.242 Measured (Wright et al., 1993)
Initial C/N (–) 25.3 25.3 25.3 Calibrated (Wright et al., 1998a)
SO4-ads. Half saturation (eq m-3) 60. 60. 60. Measured (Wright et al., 1998a)
SO4-ads. Max. capacity (eq m-3) 6.0 6.0 6.0 Measured (Wright et al., 1998a)
Solubility Al(OH)3 (log10) 7.2 7.2 7.2 Calibrated This study
Sel. constant Al-BC exchange (log10) -1.63 -1.63 -1.63 Calculated Required data from Wright
et al. (1993)
Sel. constant H-BC exchange (log10) 2.85 2.85 2.85 Calculated Required data from Wright
et al. (1993)
Total organic acid (eq m-3) 0.12 0.12 0.12 Measured (Wright et al., 1998a)
pCO2 (multiple of pCO2 in air) (-) 6.32 6.32 6.32 Measured (Wright et al., 1998a) BC2-weathering (eq m-3 yr –1) 0.005 0.005 0.005 Calibrated (Wright et al., 1998a)
Na-weathering (eq m-3 yr –1) 0.001 0.001 0.001 Calibrated (Wright et al., 1998a)
K-weathering (eq·m-3·yr –1) 0.000 0.000 0.000 Calibrated (Wright et al., 1998a)
VEGETATIONPARAMETER ROLF and KIM
EGIL
Ammonium foliar uptake fraction (–) 0.4 0.4 Estimated (Kros et al., 1995)
Proton foliar uptake fraction (–) 0.4 0.4 Estimated (Kros et al., 1995)
K foliar exudation fraction (–) 0.65 0.65 Estimated (Kros et al., 1995)
Max. amount of litterfall (kg m-2 yr-1) 0.175 0.209 Measured (Arp, pers comm.; Beier,
pers comm.)
Reallocation fraction (–) 0.10 0.10 Estimated (Kros et al., 1995)
BC2 leaf contents (%) 0.81 0.61 Measured (Arp and Berendse, 1997)
K leaf contents (%) 0.73 0.53 Measured (Arp and Berendse, 1997)
N contents in litterfall (%) 0.96 0.84 Measured (Arp, pers comm.; Beier,
pers comm.)
Logistic growth rate constant (yr-1) 0.15 0.15 Derived (Kros et al., 1995)
Growth half time (yr.) 10. 10. Derived (Kros et al., 1995)
Max. amount of biomass (kg m-2) 3.2 3.1 Estimated (Arp, pers comm.; Beier,
pers comm.)
N nutrient content (%) 1.13 0.63 Measured (Arp and Berendse, 1997)
BC2 nutrient content (%) 0.002 0.002 Measured (Arp and Berendse, 1997)
K nutrient content (%) 0.002 0.002 Measured (Arp and Berendse, 1997)
Mineralisation factor fresh litter (–) 0.4 0.4 Estimated (Kros et al., 1995)
Min. rate constant old litter (yr-1) 0.16 0.16 Calibrated this study
Fraction roots in litter layer (–) 0.75 0.75 Estimated (Kros et al., 1995)
Nutrient cycling factor (–) 1.77 1.82 Calculated Data from Arp and Beier,
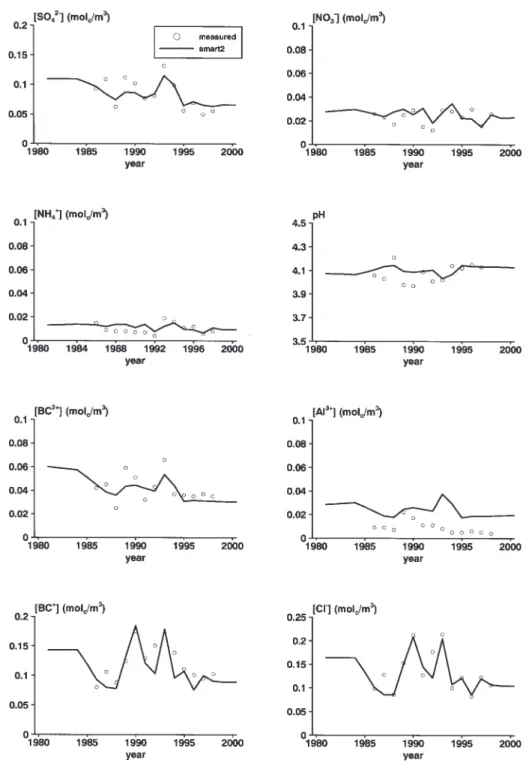
The calibration of the simulated run-off chemistry without temperature effect was performed by comparing simulated concentrations with observed concentrations from the ROLF catchment (Fig. 1). The temperature effect was evaluated at the EGIL catchment from 1995 (Fig. 2).
Results
MODEL CALIBRATION
Calibration at the ROLF control catchment
Chloride concentrations were reproduced very well, indicating a well-simulated hydrology (Fig. 1). The NO3 and the NH4 concentrations were also well reproduced. The dynamics in SO4 and BC2 concentrations were not fully reproduced by SMART2. The fluctuations of SO4 concentrations were underestimated, as was also found by Van der Salm et al. (1995), who attributed this effect to the lack of vertical heterogeneity of the model. SMART2 considers the mineral soil as one-layer, neglecting vertical heterogeneity and consequently it underestimates the retardation of absorbing compounds. The pH was overestimated for the years before 1990, whereas the Al concentrations were overestimated during the entire simulation period. Changing the Al oxide dissolution constant leads either to an increase or decrease in both pH and Al concentrations, so calibration of the Al oxide dissolution constant cannot improve predictions of pH and Al concentrations at the same time. Wesselink and Mulder (1995) likewise could not reproduce both pH and Al concentrations by Al oxide solubility; this was attributed to
Al complexation with dissolved organic matter. An optimum value of the Al oxide dissolution constant was selected resulting in satisfactory pH values and BC2 concentrations. Taking into account Al complexation with organic compounds might lead to better results.
Calibration of the temperature effect at the EGIL catchment
The temperature effect was calibrated at the EGIL catchment using measured mineralisation and nitrification rates. The observed and simulated relative increase in N-mineralisation were comparable, about 10% (Table 3). Nitrification at EGIL was underestimated but the relative temperature effect was overestimated, which indicates that the Q10 for nitrification might be too high. An increase in simulated NO3 and NH4 concentrations started from 1995 (Fig. 2). This is also found for the observed concentrations, though to a lesser extent. The concentrations before 1995 were clearly underestimated, resulting in an underestimation of the three years pre-treatment N-leaching fluxes. This was probably caused by an overestimation of uptake, since N-mineralisation was slightly overestimated (Table 3). The relative increase in N leaching due to temperature rise was overestimated by SMART2. The observed increase was 68% whereas the simulated increase was 200 % (Table 3).
The higher measured N-contents in needles (Beier and Rasmussen, 1997) indicate a higher N-uptake after temperature rise, which was not predicted by SMART2. Even though SMART2 calculates a higher mineralisation and, therefore, a higher N availability, the N-uptake did not increase because the N-content in the biomass had already
Table 3. Three years average pre and post treatment N-fluxes as calculated by SMART2, MERLIN and observed
(mmol m-2 yr). The standard deviations are given in brackets.
EGIL KIM
SMART2 MERLIN Observed SMART2 MERLIN Observed
pre post pre post pre post pre post pre post pre post
Deposition 77 (22) 83 (21) 76 59 77 (22) 83 (21) 21 (8) 0 (-) 14 0 21 (8) 0 (-) Litterfall 262 (6) 257 (1) 485 487 - - 195 (4) 197 (3) 469 477 - -Mineralisation 269 (1) 312 (3) 418 456 245 (-)1271 (57)2 225 (2) 256 (2) 437 472 147 (-)1201 (7)2 Uptake 307 (6) 301 (3) 486 485 - - 238 (2) 247 (3) 470 482 - -Nitrification 10 (7) 30 (7) - - 45 (-)1 67 (11)2 4 (3) 8 (2) - - 2 (-)1 3 (0)2 Denitrification 0 (0) 2 (0) - - - - 0 (0) 0 (0) - - - -Leaching 18 (13) 54 (12) 28 48 28 (6) 47 (10) 5 (5) 8 (3) 4 9 3 (1) 9 (4) 1 n = 1 2 n = 2
Fig. 1. Measured and simulated concentrations of SO4, NO3, NH4, pH, BC2, Al, BC and Cl for the ROLF control catchment.
reached the maximum value before the temperature rise. In SMART2, N uptake can only increase if the N content in biomass is not maximal.
The lower actual Al hydroxide dissolution constant due to temperature rise (Eqn. 3) caused a decrease in calculated Al concentrations and pH with temperature rise. Furthermore, BC2 and BC concentrations increased due to higher weathering rates. This effect, however, was not sufficient to compensate the pH decrease due to a shift in
the Al hydroxide equilibrium and the increase in NO3 concentration due to enhanced mineralisation.
EVALUATION AT THE KIM CATCHMENT
Deposition reduction (1984–1994)
After calibration the model was evaluated at the KIM catchment using the same parameter set for the soil, except
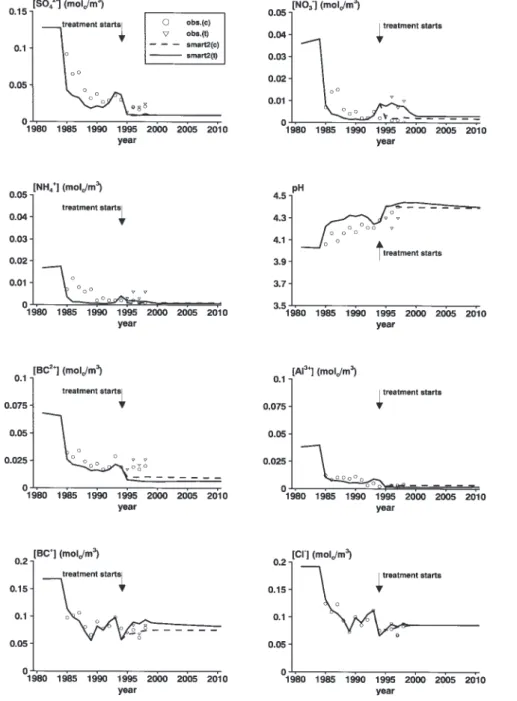
Fig. 2. Measured and simulated concentrations of SO4, NO3, NH4, pH, BC2, Al, BC and Cl for the EGIL catchment with a soil temperature
increase starting in 1994.
for bulk density, CEC and organic matter (Table 2). The vegetation-related parameters differed at the two catchments: at the KIM catchment the ground vegetation was mainly
Calluna Vulgaris L. whereas at the EGIL catchment it was
Vaccinium myrtillus L. The predicted trends in SO4, NO3
and NH4 concentrations in run-off corresponded well with the observed trends but SMART2 underestimated the SO4, NO3, NH4 and BC2 concentrations and overestimated pH (Fig. 3). Aluminium, BC and Cl concentrations were well
predicted. The underestimation of the concentration of SO4, NO3, NH4 and BC2 might be caused by too strong a response to the reduction in deposition, which may be caused by an underestimation of SO4 desorption and too fast a release of N. BC2 concentrations are strongly correlated to SO4 input and higher acid input, due to higher SO4 input, induces an exchange of base cations by H and Al resulting in higher BC2 concentrations.
Temperature rise
The response of N concentrations to temperature rise after 1994 was simulated fairly well (Fig. 3), especially the increase in NO3 concentrations. In contrast to the EGIL catchment, SMART2 simulated an increase of N uptake due to temperature rise (Table 3). At the KIM catchment, the N content in the leaves increased because the maximum N content was not yet reached, which resulted in a higher N uptake.
The field experiments show little response to treatment in BC2 concentrations and no response in SO4 concentrations, whereas the model gave a decrease in BC2 concentrations and no response to SO4 concentrations (Fig. 3). SMART2 predicted a pH increase in response to temperature rise, whereas the observed pH actually fell. The Al concentrations were simulated adequately both before and after the temperature rise, although the effect was small. Both simulated and measured Al concentrations decreased due to temperature rise. The response of BC concentrations Fig. 3. Measured and simulated concentrations of SO4, NO3, NH4, pH, BC2, Al, BC and Cl for KIM catchment with deposition reduction as from
Al oxide dissolution constant at 8.7°C than at 5°C, the Al concentrations after temperature rise were lower than before resulting in lower pH.
Discussion and conclusions
In general, the observed time-series in run-off chemistry in response to deposition reduction and temperature rise were well reproduced by the SMART2 model. At the roofed sites, however, SMART2 tended to underestimate the concentrations of SO4, NO3, NH4 and BC2, though the simulated trends were well reproduced. Mol-Dijkstra et al. (1998) tested the performance of SMART2 in response to deposition reduction at a spruce forest (Speuld) in the Netherlands, where two-weekly soil solution samples were taken with four replicates. The SMART2 results were compared with flux-weighted averaged concentrations obtained from observed soil solution chemistry and modelled hydrology. This uncertainty in fluxes due to high soil variability at Speuld frustrated the model validation. In
Fig. 4. Simulated concentrations of NO3, NH4, total N and nitrification for the EGIL catchment in the long term to increase temperature was simulated well. Both the
simulated and observed BC concentrations increased in response to increased temperature.
Since the short-term effect of soil heating was rather small, the possible long-term effect of temperature rise was evaluated by simulating the soil heating treatment at EGIL for a period of 200 years. The deposition during this 200-year period was taken as the average of 1995–1998. SMART2 predicts the climate change effect on N-leaching to be temporary (Fig. 4). After 100 years, the N leaching in the treatment run is equal to that of the control run. At the actual temperature, it took more than 100 years to reach a steady state (N saturation), whereas at the elevated temperature it took less than 50 years. At higher temperature, less N was accumulated in the soil because of a higher mineralisation rate. The NO3/NH4 ratio changed due to increased nitrification. In the long term, NO3 concentrations increased whereas NH4 concentrations decreased. At the KIM catchment (low deposition) a new steady state was already reached within five years (Fig. 3). Due to the lower
contrast to the observations at Speuld, the observations at the Risdalsheia catchments are observed annual average concentrations in run-off from the whole catchment, which means that the time and space resolution of measurements and modelling are similar. This application, with quite a long observation period, contributes to an increase in confidence in using SMART2 at the regional scale, especially to evaluate deposition scenarios.
The inclusion of the climate change effect in SMART2 was restricted to the temperature effect on mineralisation of old litter, nitrification, denitrification, weathering and Al oxide dissolution constant. For the N related processes, a Q10 value of 1.6 was obtained. Kätterer et al. (1998), however, found Q10 values for mineralisation of about 2.5 for comparable soil and vegetation types. Kirschbaum (1995) even found a Q10 value of 5.0 at a temperature of 5ºC. Although there was an indication that N-uptake increased, the temperature effect on growth was not included because the effect on growth is not clear and the temperature dependency as well as the CO2 dependency of growth is not well-known. An increase in N availability, however, induced an increase in N-uptake at the KIM catchment, which was caused by an increase in N content in the biomass. This increase was possible since at that low N input, the N content in the biomass was below its maximum. At the EGIL catchment, the maximum N content was already reached due to higher N input, so there was no response in N uptake. The inclusion of the temperature dependencies gave satisfactory results. The observed increase in N-run-off was well reproduced by the model, just like the observed increase in mineralisation and nitrification. Still, there is need to pay attention to the N-cycling in SMART2, considering the adaptation of the pH influence on mineralisation in this application.
Wright et al. (1998b) applied MERLIN at Risdalsheia. This model is of comparable complexity to SMART2 and gave comparable results. MERLIN is a simple process-orientated model focused on simulation of concentrations of inorganic N in soil leachate and run-off in terrestrial ecosystems (Cosby et al., 1997). The model links the C and N cycles. The ecosystem is simplified to one plant compartment and two soil organic matter compartments (labile and refractory organic matter). The effect of temperature was included by changing the decomposition rate in 1995, the year the temperature treatment started. MERLIN calculated a higher N turnover than SMART2, due to a higher N input via litterfall (Table 3). Wright et al. (1998b) used estimated litterfall fluxes for shrub vegetation, whereas in SMART2 recently measured litterfall fluxes were used (Arp, pers. com.). Both models, however, calculated comparable N leaching fluxes. Considering the three years
pre- and the three years post-treatment, MERLIN calculated the increase of N leaching very well, but the year-to-year variations were not well reproduced. As with SMART2, MERLIN predicted increased N run-off in response to temperature rise. In the long term, however, MERLIN predicted an enduring higher N run-off in response to temperature rise (Wright et al., 1998b), while SMART2 predicted only a transient increase.
The length of the period with increased N run-off in response to elevated temperature depends on deposition level. The SMART2 simulations indicate that with high deposition levels, the temporal effect of increased N leaching is longer than with lower deposition levels. Due to increased nitrification, the ratio between NO3 and NH4 concentrations changes. NO3 concentrations increase and NH4 concentrations decrease.
It seems that the biochemical processes give a transient response to temperature rise, whereas the geochemical processes change is permanent. To test the model more rigorously in its suitability to predict responses to climate change, additional years of treatment would be needed. For instance, the strong temporal variability in the mineralisation and nitrification measurements makes it difficult to test the model behaviour in response to temperature rise over such a short period. Application to other soil warming experiments (Rustad et al., 2001) would be additional to test the prediction climate change response of the model. The long term runs showed a transient effect of temperature rise dependent on deposition level and it would be essential to test this effect in the field.
Acknowledgements
This work was supported by the Commission of European Communities (DYNAMO ENV4-CT95-0030). Data from Risdalsheia came from the CLIMEX project. CLIMEX was supported by the Commission of European Communities (EV5V-CT91-0047 and EV5V-CT95-0185), the Dutch Global Change Program, the Research Council of Norway, the Norwegian Ministry of Environment, the National Environment Research Council (UK), Hydrogas Norge A/ S, and the Norwegian Institute for Water Research. We thank Wim Arp, Claus Beier and Richard F. Wright for providing unpublished data. CLIMEX was a contribution to core research category 1 of the Global Change and Terrestrial Ecosystems (GCTE) core project under the International Geosphere-Biosphere Programme (IGBP). We thank Richard F. Wright and Wim de Vries for their comments on the manuscript. Bert Jan Groenenberg is thanked for the derivation of some temperature dependencies.
References
Arp, W. and Berendse, F., 1997. Effects on the dwarf shrub vegetation. In: CLIMEX project: Results from the third year of treatment, A. Jenkins (Ed.), 28–35. Climate Change Research Report 9/1997, Norwegian Institute for Water Research, Oslo. Beier, C. and Rasmussen, L., 1997. Tree responses. In: CLIMEX project: Results from the third year of treatment, A. Jenkins (Ed.), 36–44. Climate Change Research Report 9/1997, Norwegian Institute for Water Research, Oslo.
Cosby, B.J., Ferrier, R.C., Jenkins, A., Emmett, B.A., Wright, R.F. and Tietema, A., 1997. Modelling the ecosystem effects of nitrogen deposition at the catchment scale: model of ecosystem retention and loss of inorganic nitrogen (MERLIN). Hydrol. Earth Syst. Sci., 1, 137–158.
Dise, N.B. and Jenkins, A. (Eds.), 1995. The CLIMEX project: whole catchment manipulation of CO2 and temperature. Climate Change Research Report 3/95. Norwegian Institute for Water Research, Oslo, 130 pp.
Edwards, N.T., 1975. Effects of temperature and moisture on carbon dioxide evolution in a mixed deciduous forest floor. Soil Sci. Soc. Amer. J., 39, 361–365.
Ferrier, R.C. and Helliwell, R.C., 2000. DYNAMO: Dynamic models to predict and scale up the impact of environmental change on biogeochemical cycling. In: Terrestrial Ecosystem Research in Europe: successes, challenges and policy, M.A. Sutton, J.M. Moreno, W.H. Van der Putten and S. Struwe (Eds.). European Commission.
Grant, R.F., 1991. A technique for estimating denitrification rates at different soil temperatures, water contents and nitrate concentrations. Soil Sci., 152, 41–52.
Grundmann, G.L., Renault, P., Rosso, L. and Bardin, R., 1995. Differential effects of soil water content and temperature on nitrification and aeration. Soil Sci. Soc. Amer. J., 59, 1342– 1349.
Houghton, J.T., Jenkins, G.T. and Ephraums, J.J. (Eds.), 1990. Climate Change: the IPPC Scientific Assessment. Cambridge University Press, UK.
Kätterer, T., Reichstein, M., Andrén, O. and Lomander, A., 1998. Temperature dependence of organic matter decomposition: a critical review using literature data analysed with different models. Biol. Fert. Soils, 27, 258–262.
Kauppi, P.E., Mielikäinen, K. and Kuusela, K., 1992. Biomass and carbon budget of European forests, 1700 to 1900. Science, 256, 70–72.
Kirschbaum, M.U.F., 1995. The temperature dependence of soil organic matter decomposition, and the effect of global warming on soil organic C storage. Soil Biol. Biochem., 27, 753–760. Knowles, R., 1982. Denitrification. Microbiological reviews, 46,
43–70.
Kros, J., Reinds G.J., De Vries, W., Latour, J.B. and Bollen, M.J.S., 1995. Modelling soil acidity and nitrogen availability in natural ecosystems in response to changes in acid deposition and hydrology. Wageningen, Winand Staring Centre. Report 95. Lükewille, A. and Wright, R.F., 1997. Experimentally increased
soil temperature causes release of nitrogen at a boreal forest catchment in southern Norway. Glob. Change Biol., 3, 13–21. Mol-Dijkstra, J.P., Kros, J. and van der Salm, C., 1998. Comparison of simulated forest soil response to acid deposition reduction with two models of differing complexity. Hydrol. Earth Syst. Sci., 2, 373–483.
Nômmik, H. and Larsson, K., 1989. Measurement of denitrification rate in undisturbed soil cores under different temperature and moisture conditions using 15N tracer technique. Swed. J. Agr.
Res., 19, 35–44.
Ross, D.J. and Bridger, B.A., 1978. Influence of temperature on biochemical processes in some soils from tussock grassland. 2. Nitrogen mineralisation. N. Z. J. Sci., 21, 591–597.
Rustad, L.E., Campbell, J.L., Marion, G.M., Norby, R.J., Mitchell, M.J., Hartley, A.E., Cornelissen, J.H.C. and Gurevitch, J., 2001. A meta-analysis of the response of soil respiration, net nitrogen mineralisation, and aboveground plant growth to experimental ecosystem warming. Oecologia, 126, 543–562.
Stanford, G., Frere, M. and Schwaninger, D.E., 1973. Temperature coefficient of soil nitrogen mineralisation. Soil Sci., 115, 321– 323.
Stark, J.M., 1996. Modelling the temperature response of nitrification. Biochemistry, 35, 433–445.
Stumm, W. and Morgan J.J., 1981. Aquatic Chemistry. 2nd Edition.
Wiley, New York.
Van Breemen, N., Jenkins, A., Wright, R.F., Arp, W.J., Beerling, D.J., Berendse, F., Beier, C., Collins, R., van Dam, D., Rasmussen, L., Verburg, P.S.J. and Wills, M.A., 1998. Impacts of elevated carbon dioxide and temperature on a boreal forest ecosystem (CLIMEX project). Ecosystems, 1, 345–351. Van der Salm, C., Kros, J., Groenenberg, J.E., De Vries, W. and
Reinds, G.J., 1995. Application of soil acidification models with different degrees of process description (SMART, RESAM and NUCSAM) on an intensively monitored spruce site. In: Solute Modelling in Catchment Systems, S.T. Trudgill (Ed.). Wiley, Chichester, UK.
Van Veen, J.A., 1977. The behaviour of nitrogen in soil: a computer simulation model. Thesis, Free University, Amsterdam. Verburg, P.S.J., 1998. Organic matter dynamics in a forest soil as
affected by climate change. Ph.D. thesis, Agricultural Univ., Wageningen, The Netherlands.
Verburg, P.S.J., Van Loon, W.K.P. and Lükewille, A., 1999. The CLIMEX soil-heating experiment: soil response after 2 years of treatment. Biol. Fert. Soils, 28, 271–276.
Wesselink, L.G. and Mulder, J., 1995. Aluminium solubility controls in acid forest soil (I): testing hypothesis on data from Solling, Germany. Ecol. Model., 83, 109–117.
Wright, R.F., 1998. Effect of increased CO2 and temperature on run-off chemistry at a forested catchment in southern Norway (CLIMEX project). Ecosystems, 1, 216–225.
Wright, R.F. and Jenkins, A., 2001. Climate change as a confounding factor in reversibility of acidification: RAIN and CLIMEX projects. Hydrol. Earth Syst. Sci., 5, 477–486. Wright, R.F., Lotse, E. and Semb, A., 1993. RAIN Project: Results
after 8 years of experimentally reduced acid deposition to a whole catchment. Can. J. Fisheries Aquat. Sci., 50, 258–268. Wright, R.F., Emmet, B.A. and Jenkins, A., 1998a. Acid
deposition, land-use change and global change: MAGIC model applied to Aber, UK (NITREX project) and Risdalsheia, Norway (RAIN and CLIMEX projects). Hydrol. Earth Syst. Sci., 2, 385– 397.
Wright, R.F., Beier, C. and Cosby, B.J., 1998b. Effects of nitrogen deposition and climate change on nitrogen run-off at Norwegian boreal forest catchments: the MERLIN model applied to Risdalsheia (RAIN and CLIMEX projects). Hydrol. Earth Syst. Sci., 2, 399–414.