Figure S1. Seedling establishment in osmotic media supplemented with mannitol or NaCl.
Values are the mean ± standard error of three replicates in each panel. Between 60 and 80
seeds per genotype were counted in every experiment. * and ** Mean significantly different
in iPCC1 seeds when compared to a similar condition for wild type seeds with p-value <
0.05 and < 0.01, respectively, in Student´s t-test.
iPCC1
0
5
10
15
20
25
0
10
20
30
40
50
60
wt
19.9
25.4
33.9
Seedling
establishment
(%
) ±
S
E
Mannitol 250 mM
NaCl 125 mM
*
*
**
*
iPCC1
85
90
95
100
0
20
40
60
80
wt
19.9
25.4
33.9
Water
c
ontent
(%
) ±
S
E
Time (min)
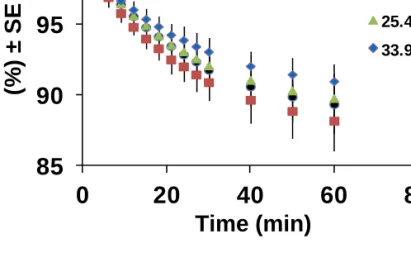
Fig. S2 Transpiration-mediated water loss. Curves show the water content of seedlings of the
indicated genotypes left at room temperature for the times indicated after being removed from
Petri dishes and softly blotted onto absorbent paper. Sets of five seedlings per genotype were
weighed with an analytical balance, and values are the mean ± standard error of three
15
20
25
ATH1
qRT-PCR
0
1
2
3
4
5
6
7
8
9
10
M
Y
B
2
8
H
R
S
1
G
S
T
U
2
4
P
IF
1
R
G
L
2
IR
T
3
A
D
H
1
R
A
P
2
.1
A
O
P
1
A
t1
g
4
4
7
4
0
E
D
S
1
N
P
R
1
R
P
P
4
~~
~~
Relative
transcrip
t
levels
(iPCC1/Col
‐0)
(fol
d)
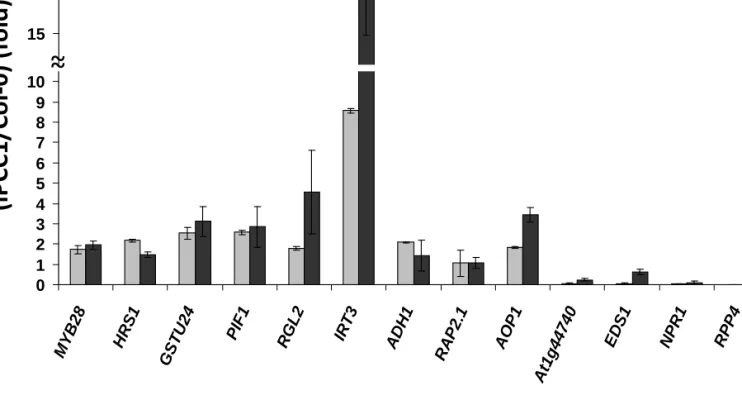
Figure S3. Comparison of transcript levels detected by microarray and qRT-PCR analyses. The ratio of
the indicated transcripts in iPCC1/Col-0 obtained from the ATH1 microarray experiment and from
independent biological replicates by qRT-PCR with the specific oligonucleotides as shown in Materials
and Methods. Values are the mean of three replicates for both techniques ± standard error. Ratio values
above 1 corresponded to up-regulated genes and below 1 to down-regulated genes in iPCC1 seedlings.
0
20
40
60
80
100
120
140
0
50
150
Relative
PCC1
transcript
levels
[ SA ] (
M)
A
B
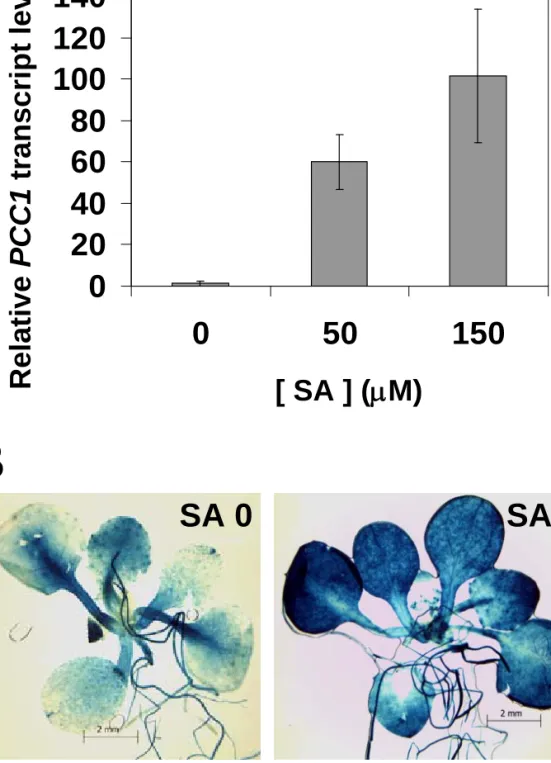
Figure S4. PCC1 expression is induced by SA. (A) Levels of PCC1 transcripts were quatified
by RT-qPCR from total RNA extracted from Col-0 seedlings treated with the indicated SA
concentration. Values are the mean of three biological replicates ± SD and they were
normalized with the endogenous ACTIN2/8 (ACT2/8) transcript levels. (B) -glucuronidase
staining of control untreated (left panel) and 50 M SA treated pPCC1::GUS seedlings.
PYR/PYL/RCAR
receptor
PP2Cs
phosphatase
SnRK2s
kinase
ABA-responsive
TFs
Receptor
Fold
FDR
At4g17870
PYR1
-1.09
0.6170
At5g46790
PYL1
-1.23
0.3262
At2g26040
PYL2
-1.08
0.5633
At1g73000
PYL3
-1.00
0.9813
At2g38310
PYL4
-1.30
0.4487
At5g05440
PYL5
-1.03
0.9551
At2g40330
PYL6
1.22
0.4077
At4g01026
PYL7
1.12
0.4756
At5g53160
PYL8
1.04
0.9059
At1g01360
PYL9
1.16
0.1841
TF
Fold
FDR
At1g49720
ABF1
1.24
0.1040
At3g56850
ABF2
1.15
0.3031
At4g34000
ABF3
1.75
0.0586
At3g19290
ABF4
1.21
0.1505
At2g36270
ABI5
1.39
0.0328
Kinase
Fold
FDR
At5g08590
SnRK2.1
-1.02
0.8884
At3g50500
SnRK2.2
-1.53
0.0089
At5g66880
SnRK2.3
1.20
0.1252
At1g10940
SnRK2.4
-1.07
0.5659
At5g63650
SnRK2.5
1.06
0.8278
At4g33950 SnRK2.6/OST1
1.24
0.0843
At4g40010
SnRK2.7
1.60
0.038
At1g78290
SnRK2.8
1.11
0.6625
At2g23030
SnRK2.9
-1.52
0.1106
At1g60940
SnRK2.10
-1.04
0.7768
Phosphatase
Fold
FDR
At4g26080
ABI1
-1.07
0.7767
At5g57050
ABI2
1.55
0.0431
At1g72770
HAB1
1.94
0.0488
At1g17550
HAB2
1.13
0.4927
At5g59220
HAI1
3.71
0.0174
At1g07430
HAI2
1.65
0.1827
At2g29380
HAI3
1.17
0.2439
At5g51760
AHG1
1.19
0.1796
At3g11410
AHG3
1.46
0.1240
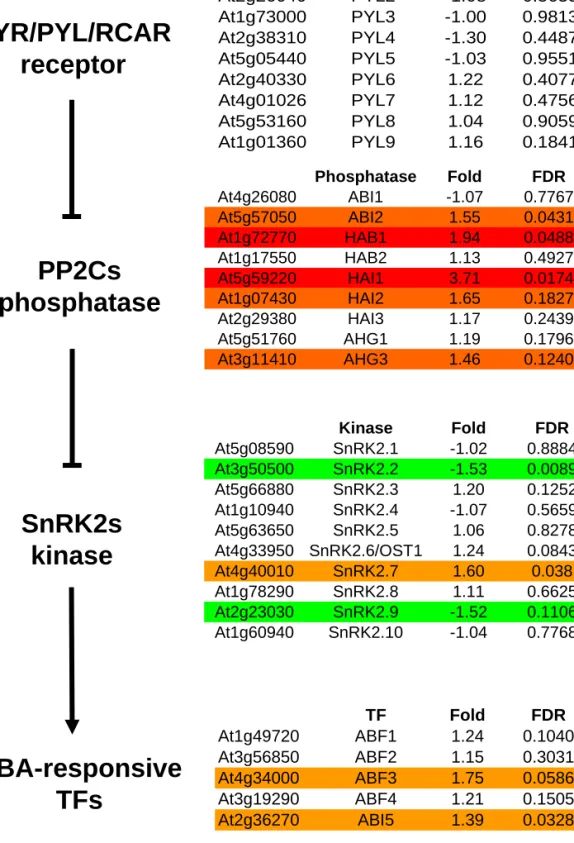
Figure S5. Core ABA signalling module in Arabidopsis. Levels (Fold) and statistical significance
(FDR) of the gene transcripts coding for ABA-related receptors, phosphatases, kinases and
transcription factors in the microarrays analysis of iPCC1 versus wild type plants. Up-regulated genes
were highlighted in orange and red and down-regulated genes in green.
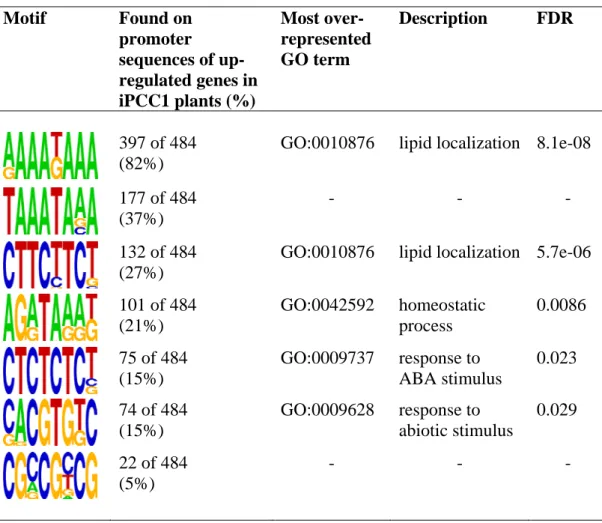
Table S2. In silico analysis of motifs over-represented in the promoter sequences of
genes that were up-regulated in iPCC1 vs Col-0 plants
Motif Found
on
promoter
sequences of
up-regulated genes in
iPCC1 plants (%)
Most
over-represented
GO term
Description FDR
397 of 484
(82%)
GO:0010876 lipid
localization 8.1e-08
177 of 484
(37%)
- -
-
132 of 484
(27%)
GO:0010876
lipid localization 5.7e-06
101 of 484
(21%)
GO:0042592
homeostatic
process
0.0086
75 of 484
(15%)
GO:0009737
response to
ABA stimulus
0.023
74 of 484
(15%)
GO:0009628
response to
abiotic stimulus
0.029
22 of 484
(5%)
- -
-
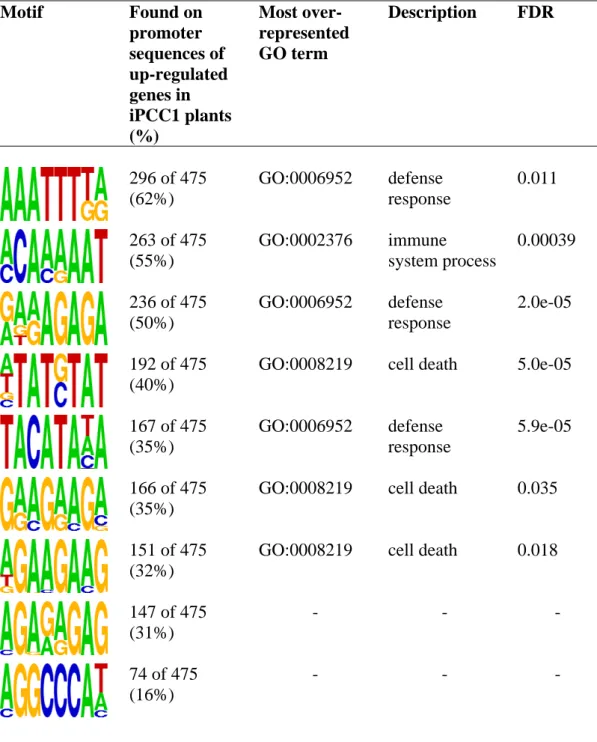
Table S3. In silico analysis of motifs over-represented in the promoter sequences of
genes that were down-regulated in iPCC1 vs Col-0 plants
Motif Found
on
promoter
sequences of
up-regulated
genes in
iPCC1 plants
(%)
Most
over-represented
GO term
Description FDR
296 of 475
(62%)
GO:0006952 defense
response
0.011
263 of 475
(55%)
GO:0002376 immune
system process
0.00039
236 of 475
(50%)
GO:0006952 defense
response
2.0e-05
192 of 475
(40%)
GO:0008219 cell
death
5.0e-05
167 of 475
(35%)
GO:0006952 defense
response
5.9e-05
166 of 475
(35%)
GO:0008219 cell
death
0.035
151 of 475
(32%)
GO:0008219 cell
death
0.018
147 of 475
(31%)
- -
-
74 of 475
(16%)
- -
-
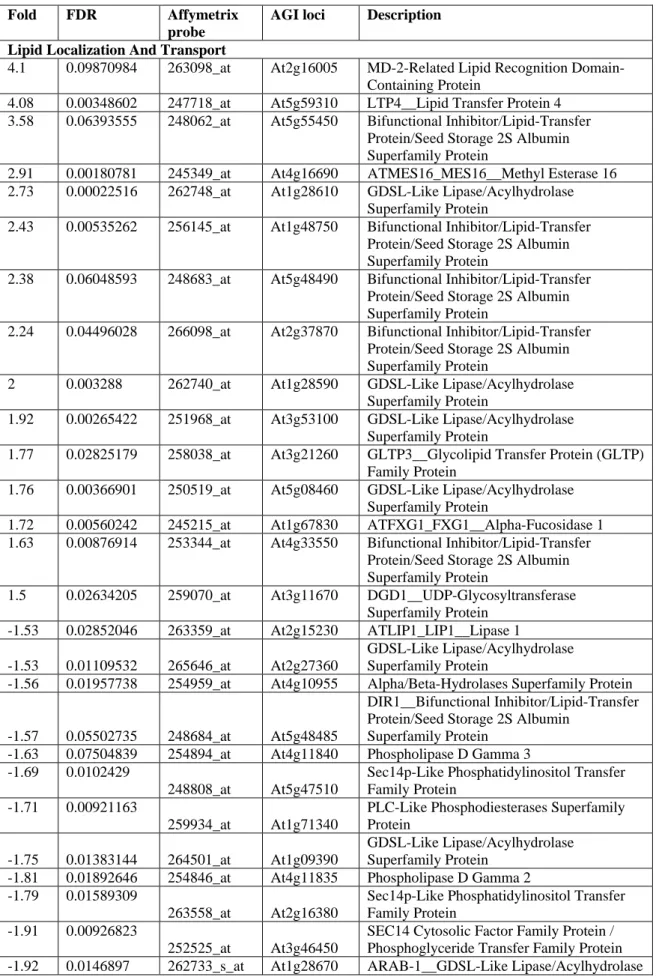
Table S4. Lipid-related genes that were up- and down-regulated in iPCC1 compared to
wild type plants.
Fold FDR
Affymetrix
probe
AGI loci
Description
Lipid Localization And Transport
4.1
0.09870984
263098_at
At2g16005
MD-2-Related Lipid Recognition
Domain-Containing Protein
4.08
0.00348602
247718_at
At5g59310
LTP4__Lipid Transfer Protein 4
3.58
0.06393555
248062_at
At5g55450
Bifunctional Inhibitor/Lipid-Transfer
Protein/Seed Storage 2S Albumin
Superfamily Protein
2.91
0.00180781
245349_at
At4g16690
ATMES16_MES16__Methyl Esterase 16
2.73
0.00022516
262748_at
At1g28610
GDSL-Like Lipase/Acylhydrolase
Superfamily Protein
2.43
0.00535262
256145_at
At1g48750
Bifunctional Inhibitor/Lipid-Transfer
Protein/Seed Storage 2S Albumin
Superfamily Protein
2.38
0.06048593
248683_at
At5g48490
Bifunctional Inhibitor/Lipid-Transfer
Protein/Seed Storage 2S Albumin
Superfamily Protein
2.24
0.04496028
266098_at
At2g37870
Bifunctional Inhibitor/Lipid-Transfer
Protein/Seed Storage 2S Albumin
Superfamily Protein
2
0.003288
262740_at
At1g28590
GDSL-Like Lipase/Acylhydrolase
Superfamily Protein
1.92
0.00265422
251968_at
At3g53100
GDSL-Like Lipase/Acylhydrolase
Superfamily Protein
1.77
0.02825179
258038_at
At3g21260
GLTP3__Glycolipid Transfer Protein (GLTP)
Family Protein
1.76
0.00366901
250519_at
At5g08460
GDSL-Like Lipase/Acylhydrolase
Superfamily Protein
1.72
0.00560242
245215_at
At1g67830
ATFXG1_FXG1__Alpha-Fucosidase 1
1.63
0.00876914
253344_at
At4g33550
Bifunctional Inhibitor/Lipid-Transfer
Protein/Seed Storage 2S Albumin
Superfamily Protein
1.5
0.02634205
259070_at
At3g11670
DGD1__UDP-Glycosyltransferase
Superfamily Protein
-1.53
0.02852046
263359_at
At2g15230
ATLIP1_LIP1__Lipase 1
-1.53
0.01109532
265646_at
At2g27360
GDSL-Like Lipase/Acylhydrolase
Superfamily Protein
-1.56
0.01957738
254959_at
At4g10955
Alpha/Beta-Hydrolases Superfamily Protein
-1.57
0.05502735
248684_at
At5g48485
DIR1__Bifunctional Inhibitor/Lipid-Transfer
Protein/Seed Storage 2S Albumin
Superfamily Protein
-1.63
0.07504839
254894_at
At4g11840
Phospholipase D Gamma 3
-1.69
0.0102429
248808_at
At5g47510
Sec14p-Like Phosphatidylinositol Transfer
Family Protein
-1.71
0.00921163
259934_at
At1g71340
PLC-Like Phosphodiesterases Superfamily
Protein
-1.75
0.01383144
264501_at
At1g09390
GDSL-Like Lipase/Acylhydrolase
Superfamily Protein
-1.81
0.01892646
254846_at
At4g11835
Phospholipase D Gamma 2
-1.79
0.01589309
263558_at
At2g16380
Sec14p-Like Phosphatidylinositol Transfer
Family Protein
-1.91
0.00926823
252525_at
At3g46450
SEC14 Cytosolic Factor Family Protein /
Phosphoglyceride Transfer Family Protein
-1.92
0.0146897
262733_s_at
At1g28670
ARAB-1__GDSL-Like Lipase/Acylhydrolase
Superfamily Protein
-2.12
0.00799464
254313_at
At4g22460
Bifunctional Inhibitor/Lipid-Transfer
Protein/Seed Storage 2S Albumin
Superfamily Protein
-2.23
0.00048024
262561_at
At1g34340
Alpha/Beta-Hydrolases Superfamily Protein
-2.36
0.00338706
267096_at
At2g38180
SGNH Hydrolase-Type Esterase Superfamily
Protein
-2.37
0.01666758
260153_at
At1g52760
Lysopl2__Lysophospholipase 2
-2.75
0.00211792
252937_at
At4g39180
ATSEC14_SEC14__Sec14p-Like
Phosphatidylinositol Transfer Family Protein
-2.85
0.00198931
261201_at
At1g12850
Phosphoglycerate Mutase Family Protein
-3.84
0.00491101
265111_at
At1g62510
Bifunctional Inhibitor/Lipid-Transfer
Protein/Seed Storage 2S Albumin
Superfamily Protein
-5.07
0.00002192
263482_at
At2g03980
GDSL-Like Lipase/Acylhydrolase
Superfamily Protein
-5.71
0.00014492
258071_s_at
At3g26070
Plastid-Lipid Associated Protein PAP /
Fibrillin Family Protein
-14.04
0.00007334
249812_at
At5g23830
MD-2-Related Lipid Recognition
Domain-Containing Protein
Lipid Storage
2.98
0.00926451
249353_at
At5g40420
Ole2__Oleo2 (Oleosin 2)
2.02
0.01882996
258240_at
At3g27660
Ole3__Oleo4 (Oleosin 4)
1.79
0.19292396
248050_at
At5g56100
Glycine-Rich Protein / Oleosin
1.61
0.07375038
254095_at
At4g25140
Ole1__Oleo1 (Oleosin 1)
1.51
0.11350032
266654_at
At2g25890
Glycine-Rich Protein / Oleosin
-2.74
0.00800202
254798_at
At4g13050
Acyl-(Acyl Carrier Protein) Thioesterase
Phosphatidylinositol-Related Lipids
4.22
0.00169001
249780_at
At5g24240
Phosphatidylinositol 3- And 4-Kinase Family
Protein / Ubiquitin Family Protein
3.6
0.00018835
263433_at
At2g22240
Atips2 (Myo-Inositol-1-Phostpate Synthase
2)
1.8
0.00299373
262003_at
At1g64460
Phosphatidylinositol 3- And 4-Kinase Family
Protein
1.6
0.00892487
258613_at
At3g02870
VTC4; 3'(2'),5'-Bisphosphate Nucleotidase/
L-Galactose-1-Phosphate Phosphatase/
Inositol Or Phosphatidylinositol Phosphatase/
Inositol-1(Or 4)-Monophosphatase
1.53 0.04265754 262540_at At1g34260 Phosphatidylinositol-4-Phosphate
5-Kinase
Family Protein
1.44
0.04662868
248155_at
At5g54390
AHL (Arabidopsis HAL2-LIKE);
3'(2'),5'-Bisphosphate Nucleotidase/ Inositol Or
Phosphatidylinositol Phosphatase
-1.39 0.04956149 264927_at At1g60490 PI3K_VPS34
1-Phosphatidylinositol-3-Kinase
-1.42 0.10517469 260466_at At1g10900 Phosphatidylinositol-4-Phosphate
5-Kinase
Family Protein
-1.62
0.10095718
252863_at
At4g39800
Atmips1 Myo-Inositol-1-Phostpate Synthase
1
Description of microarray experiments according to MIAME
Investigation title IBMCP JLeon lab iPCC1 versus wt Col -0
Experimental designs iPCC1 transgenic lines vs wild type Col-0 seedlings
Person Last Name León
Person First Name José
E-mail [email protected]
Telephone (+)3496387782
Affiliation & Address IBMCP (CSIC-UPV), CPI Edificio 8E, Ingeniero Fausto Elio s/n, 46022 Valencia (Spain)
Person role Investigator, submitter
Replicate types 3 independent biological replicates per genotype
1. Type of experiment:
Compared analysis of the transcriptomes of 12-day old seedlings from 3 different transgenic lines expressing an RNA interference construct for PCC1 gene versus wild type background Col-0. 2. Experimental factors:
iPCC1 plants correspond to RNAi lines (iPCC1 19.9, 25.4 and 33.9, as previously reported in Segarra et al 2010 Plant, Cell & Environment 33, 11-22 ). Wild type seedlings were Col-0 (abbreviated as Col). Samples were harvested 12 h after dawn of day 12 after sowing and seedlings were grown under long days (16 h light / 8 h darkness) photoperiodic conditions.
3. Number of hybridizations to Arabidopsis Genechip ATH1 microarrays:
6 distributed as 3 independent biological replicates of wild type Col-0 plus 3 replicates corresponding to the RNAi lines (iPCC1 19.9, 25.4 and 33.9 ) 4. Goals of proposed experiments:
Identification of the differential transcriptome affected by the reduced functionof PCC1 gene in iPCC1 plants
# Label Genotype Growth conditions Tissue
1 Col 1 Col-0 MS media plus 1 % sucrose, 12 days Seedlings
2 Col 2 Col-0 MS media plus 1 % sucrose, 12 days Seedlings
3 Col 3 Col-0 MS media plus 1 % sucrose, 12 days Seedlings
4 19.9 iPCC1 19.9 MS media plus 1 % sucrose, 12 days Seedlings
5 25.4 iPCC1 25.4 MS media plus 1 % sucrose, 12 days Seedlings
6 33.9 iPCC1 33.9 MS media plus 1 % sucrose, 12 days Seedlings
4. Labeling and hybridization protocols: Investigation Design Format (IDF)
Experiment description
Sample and Data Relationship Format (SDRF)
1. Hybridization design:
2. RNA extraction:
Total RNA from wild type and iPCC1 plants was isolated and purified by the Micro-to-Midi Total RNA Purification System from Invitrogen (Carlsbad, 3. Quality controls:
RNAs from every genotype were checked by RT-PCR for mRNA levels of the PCC1 and ACT2 genes. Moreover, total RNAs used for further preparation of hybridization probes were analysed to check integrity and purity by nanocapìlar electrophoresis in Bioanalyzer Agilent 2100.
Linear model methods (LiMMA) were used for determining differentially expressed genes. To control the false-discovery rate, P-values were corrected using the method of Benjamini and Hochberg (1995). Criteria for selection of genes were fold value >1.5 and false-discovery rate ≤ 0.05. Statistical analysis and graphical visualization of data were performed with the interactive tool fiesta (http://bioinfogp.cnb.csic.es/tools/FIESTA/). RNAs were ligated to an RNA oligonucleotide adaptor (Invitrogen) using T4 RNA ligase (Ambion, http://www.ambion.com/). The RNAs were extracted once with phenol-chloroform and non-ligated adapter was removed by chromatography with MicroSpin S-300 HR columns (GE Healthcare, http://www.gehealthcare.com/). Purified ligation products were precipitated in ethanol and used as templates for reverse transcription with Superscript III (Invitrogen) for 3 h at 46°C, using oligonucleotide oligo(dT) as primer. Template RNA was removed by alkaline hydrolysis and first-strand cDNA purified with S.N.A.P. columns (Invitrogen). Second-strand synthesis was performed with Taq DNA polymerase (Roche, http://www.roche.com/) for 5 min at 94°C, 5 min; 58°C, 1 min; 72°C, 10 min. A forward oligonucleotide T7-Adap primer, which was complementary to the RNA adapter and contained the sequence of bacteriophage T7 promoter, was used. Double-stranded cDNA was then purified with MinElute columns (Qiagen) and in vitro transcribed with T7 RNA polymerase, using a MessageAmp aRNA kit (Ambion). Amplified RNA was treated with DNase I (Roche) to remove cDNA templates, purified with an aRNA Purification Module (Ambion) and then used as template for single-stranded cDNA synthesis, according to Affymetrix instructions (http://www.affymetrix.com/) as dolows: aRNA was reverse transcribed with SuperScript II (Invitrogen) for 1 h at 42°C with oligo(dT) as primer. After alkaline hydrolysis of aRNA and purification (MinElute columns, Qiagen), cDNA was fragmented with 1.5 units of DNase I (GE Healthcare) into fragments in the 50–200 bp range. Finally, 3' ends of fragmented cDNA were biotin-ddUTP labeled with terminal deoxynucleotidyl transferase (Promega, http://www.promega.com/) and GeneChip DNA labeling reagent (Affymetrix).
Three biological replicates and their corresponding negative controls were independently hybridized to ATH1 microarrays (Affymetrix), containing 22 500 transcript variants from 24 000 well-characterized Arabidopsis genes. Each sample was added to a hybridization solution containing 100 mm 2-(N-morpholino) ethanesulfonic acid, 1 m Na+, and 20 mm of EDTA in the presence of 0.01% Tween-20. Hybridization was performed for 16 h at 45°C. Each microarray was washed and stained with streptavidin–phycoerythrin in a Fluidics station 450 (Affymetrix) and scanned at 2.5-μm resolution in a GeneChip® Scanner 3000 7G system (Affymetrix). Data analyses were performed using genechip operating software (GCOS), to generate the corresponding CEL files.
Three biological replicates and their corresponding negative controls were independently hybridized to ATH1 microarrays (Affymetrix), containing 22 500 transcript variants from 24 000 well-characterized Arabidopsis genes. Each sample was added to a hybridization solution containing 100 mm 2-(N-morpholino) ethanesulfonic acid, 1 m Na+, and 20 mm of EDTA in the presence of 0.01% Tween-20. Hybridization was performed for 16 h at 45°C. Each microarray was washed and stained with streptavidin–phycoerythrin in a Fluidics station 450 (Affymetrix) and scanned at 2.5-μm resolution in a GeneChip® Scanner 3000 7G system (Affymetrix). Data analyses were performed using genechip operating software (GCOS), to generate the corresponding CEL files.
5. Sample comparisons: iPCC1 vs Col plants 6. Statistical analysis: