Production and cycling of radiocarbon: Thermal neutrons originate from primary cosmic rays and react with (14N) to produce 14C in the upper troposphere and the stratosphere. The 14C atoms are then oxidized to radioactive CO2 , which is mixed uniformly in the atmosphere and enters the global carbon cycle. The 14C content of living organisms remains in equilibrium with the content of the reservoir in which they feed (take up 14C). Death ends the balance between the uptake and decay of 14C. The 14C content diminishes at a steady rate with a half-life of 5730 years. Measuring the 14C content in carbon-bearing material (wood, carbonate, organic matter) thus allows its age to be determined. If preserved and analyzed today, the trees that Albrecht Dürer depicted in 1496/97 in this painting, “Sonnenuntergang - Weiher im Walde”, would contain approx. 95% of modern 14C content.
w w w .pages-igbp .or g
14
C - Chronology
Editors:
Irka Hajdas, Christoph Kull and Thorsten Kiefer
����
Vol. 14 • No 3 • December 2006
������
�����������
��������������
�����
����������
������
���������
������������������
��������
��
�����
��
����
��
��
�
���������
������������
�����������
������������
2
14
C-Chronology
IRKA HAJDAS
PSI/ETH Laboratory for Ion Beam Physics, Zurich, Switzerland; hajdas@phys.ethz.ch
The radiocarbon dating method is commonly used to estimate the age of carbon-bearing material deposited in nature during the last 50 kyr. During nearly six decades of its application, the method has become a research discipline in itself. An ever-growing de-mand for reliable chronologies drives developments in preparative and measurement techniques. The need for calibration of the 14C
timescale, which has been the main challenge posed by the 14C dating method almost from the beginning, has resulted in extended
studies of suitable archives (trees, lake sediments, corals, stalagmites), as well as the development of calibration programs. All these developments were possible because of interdisciplinary collaborations. The exciting questions emerging as the work continues call for closer collaboration to keep the communities informed and interacting. For example, recent discussions on the timing of the Neanderthal extinction, the dispersion of modern Homo sapiens across Europe, and the possible connections to the climate changes that took place around that time of meltwater event Heinrich 4, rely heavily on the radiocarbon timescale and calibration. Our knowledge of paleo-reservoir ages, which is critical for marine records, is still very limited and a combined eff ort of the paleo and 14C communities is needed. Furthermore, new calibration tools are now available and the benefi ts of using them should be
pre-sented to the paleocommunity.
In this issue of PAGES news, nine contributions present overview and progress reports on new developments in 14C dating
meth-od and applications: The complex global cycle of the cosmogenic isotope 14C is addressed by Konrad Hughen. He presents an
over-view of the recent reconstructions of Δ14C (the measure of variability in the atmospheric 14C content), which also contribute to the
eff ort to extend the radiocarbon calibration curve back to the limit of the method (ca. 50-60 kyr BP). The progress and future pros-pects of the extension of the calibration curve is the focus of the IntCal group, presented in this issue by Paula Reimer. Promising new results from dating ancient Kauri wood from New Zealand (OIS3) were obtained by Alan Hogg and co-workers. Work towards more precise chronologies depends on the quality of radiocarbon ages. Results of two recent inter-comparison exercises (FIRI and VIRI) are reported by Marian Scott. In the contribution from Ron and Paula Reimer, spatial variability of marine reservoir ages is addressed; an important correction included in the calibration program and needed for marine records. Reconstruction of paleoreservoir ages is addressed by Pieter Grootes and Michael Sarnthein. Christopher Bronk Ramsey describes the Bayesian approach to calibrating sequences of 14C ages using OxCal. A similar approach using the Bpeat code based on the MexCal program is presented by Maarten
Blaauw. The higher precision of chronologies based on such approaches is illustrated by examples discussed in the contribution by David Lowe, Rewi Newnham and myself.
These are only a few examples of 14C research activities that aim to improve the radiocarbon timescale and our understanding of
complex processes that complicate this otherwise very straightforward method. We are all looking forward to the new, exciting data and even closer collaboration between the paleo and 14C communities.
Edit
orial
April 11 - 14, 2007, Nanjing, China
2nd LIMPACS Salinity, Climate Change and
Salinisation Workshop
Further Information:
www.geog.ucl.ac.uk/ecrc/limpacs/events.htm
May 19 - 24, 2007, Obergurgel, Austria
Ocean Controls in Abrupt Climate Change
ESF-FWF Conference in Partnership with LFUI
Further Information:
www.pages.unibe.ch/calendar/2007/ESF_Conference_
announcement.pdf
July 11 - 14, 2007, Barcelona, Spain
4th International Limnogeology Congress
Further Information:
www.ilic2007.com/
July 28 - August 3, Cairns, Australia
XVII INQUA Congress 2007
Further Information:
www.inqua2007.net.au
August 27 - 31, 2007, Beijing, China
Third Alexander von Humboldt International
Conference: East Asian Summer Monsoon,
past, present and future
Further Information:
www.pages.unibe.ch/calendar/2007/monsoon_simp.pdf
August 27 - 31, 2007, Hamburg, Germany
Second International Conference on Earth
System Modeling
Further Information:
www.mpimet.mpg.de/icesm
PAGES calendar 2007
A
nnounc
emen
ts
Inside Pages
There will be some new faces at the PAGES IPO and on the PAGES SSC at the start of 2007.
Leaving Science Officer
After 6 years at the IPO, Christoph Kull is moving on to work for the Swiss “Advisory Body on Climate Change” (OcCC), whose role is to formulate rec-ommendations on questions regarding climate and global change for politicians and the federal administration. While he will certainly be missed, his presence will still be felt for a long time, given his work on many ongoing activities, as well as 15 co-edited PAGES newsletters, countless PPT teaching slides and photographs, and other products that you will still be able to download from our online Product Da-tabase. We thank him for his services to the paleoscience community, wish him the best of luck and success in his new post, and hope to meet him frequently in the future as an active member of the PAGES community. His successor will be presented in the next PAGES News.
Outgoing PAGES SSC members
At the end of 2006, PAGES Scientific Steering Committee (SSC) says fare-well to Carol Crumley (USA), José
Ignacio Martínez (Colombia), and Ryuji Tada (Japan). We thank them for their contributions to PAGES, and their help and dedication during their time on the Committee. We are sure that they will continue to remain engaged in PAGES activities.
Incoming PAGES SSC members
PAGES welcomes three new members to its SSC in 2007. Takeshi Nakatsuka (Ja-pan) is Assistant Professor in Geochem-istry at Hokkaido University. He has a scientific background in both modern ocean biogeochemistry as well as paleo applications in marine biogeochemis-try, and is now extending towards pa-leoenvironmental studies on land. José D. Carriquiry (Mexico) is a professor at the Oceanographic Research Institute (Marine Geochemistry Group) of the Uni-versidad Autónoma de Baja California at Ensenada. His scientific expertise in coral paleoclimatology led him to active in-volvement in the PAGES/CLIVAR initiative on Annual Records of Tropical Systems (ARTS). This expertise will be an excellent complement to the existing fields on the SSC. Pierre Francus (Canada), originally from Belgium, is a professor at the Uni-versité du Québec. His broad scientific
expertise around quantitative sedimen-tology, paleoenvironmental reconstruc-tion and quaternary paleoclimatology, fits within the PAGES/CLIVAR, IMAGES, and Polar focus groups.
PAGES science plan
Beyond changes in personnel, 2007 will also see the publication of a new Science and Implementation Plan, which will flesh out PAGES revised scientific structure, the general form of which can be found at www.pages-igbp.org/science/research/ newstructure.html. This new plan will provide a framework for activities on and around paleoscience that we hope you will bring to life by getting involved in, as a member or even as a leader.
Next issue of PAGES News
The next deadline for manuscript submis-sions to the PAGES newsletter is 28 Febru-ary 2007. This issue will contain an open section for your contributions as usual as well as a special section on past human - climate - ecosystem interactions guest edited by John Dearing (UK). Guidelines for submitting articles can be found at www.pages-igbp.org/products/newslet-ters/instructions.html.
���������
������������������������������������������������������������� ���������� ���� �������� �������� ���� ������������� �� ������������� ����� ������� �������� ������� ��������� ���� ������������������������������������������������������������ ��������� ���� ���� ������������� �� ������������� ����� ������ ��������� ��������� ���� ������������ ������ ��������� ����������� ������������������������������������������������������������� �������������������������������������������������������������������������������
�����������������������������������
������������������������������������������������
�������������������������������
���������������� �������������������������� ��������������������������������� ����������������������������������������������������������������������������������������������������������������
4
The Millennium project:
European climate of the last millennium
M. GAGEN1, D. MCCARROLL1AND S. HICKS2
1Department of Geography, University of Wales Swansea, UK; d.mcCarroll@swansea.ac.uk 2Institute of Geosciences, University of Oulu, Finland
Millennium is a paleoclimate project funded under the European Union’s 6th framework. It was designed by a multidisciplinary con-sortium of 37 European universities and re-search institutes and is coordinated by Prof. Danny McCarroll at the University of Wales Swansea, UK. The project aims to address a single question:
- Does the magnitude and rate of 20th Cen-tury climate change exceed the natural variability of European climate over the last millennium?
Millennium is developing new proxy-based climate reconstructions from documentary weather records, tree rings, lake sediment cores, peat cores, ice cores, marine sediment cores, and annually banded marine shells. With fi eld sites spread across Europe, recon-structions will be developed at a variety of spatial scales. A modeling component will assess the forcing mechanisms acting upon European climate.
Methodology
There have been many attempts to recon-struct the past climate of the Northern Hemi-sphere (Esper et al., 2002) and of Europe (Luterbacher et al., 2002), but they produce results that vary, particularly with respect to the longer-term changes. No existing proxy records provide a perfect, unbiased view of past climate, and diff erences in the way that existing data records have been processed have a strong eff ect on the reconstructions. Millennium seeks to improve upon this situ-ation with a combinsitu-ation of new proxy re-cords, new analyses of existing records and paleoclimate modeling.
Structure
- Instrumental and documentary archives Data are being compiled from western, eastern and central Europe, and the Medi-terranean. The group is processing derived information into a set of consistent indices expressing variation in temperature and pre-cipitation. Time series are anticipated to be resolved at the monthly level to AD 1500 and at the seasonal level for earlier centuries. Tree rings
- Paleoclimate information is being extract-ed from a network of twelve chronologies distributed across Europe from the Iberian Peninsula to the Atlantic margin and polar Arctic. A multi-proxy approach is being used,
including ring widths, wood density, stable isotopes of oxygen, hydrogen and carbon, annual height increment, and needle dy-namic data.
- Sediment archives
A multi-proxy approach is being applied to extract paleoclimate information from ice cores, peat deposits and lake sediments. Mi-crofossils, isotope ratios and sediment com-position are being analyzed at 11 sites. By carrying out continuous sampling, such that each sample represents as close to annual resolution as it is feasible to obtain, it will be possible to identify short-term abrupt events and pinpoint their date with a high degree of accuracy.
- Marine archives
Sampling has been carried out within Scot-tish sea lochs and on the North Icelandic Shelf, locations where the rate of sedimen-tation is high enough to provide a temporal resolution of just a few years. Locations were selected to resolve natural variability in both the position and temperature of the North Atlantic’s heat pump. We are also applying dendrochronological methods to the annu-ally banded marine mollusk Arctica islandica to provide a novel way to link high-resolu-tion oceanic records with those on land. - Data analysis and modeling
When empirical reconstructions of climate records, based on regression techniques (e.g. Mann et al., 1999), are compared with numerical simulations of the past
millen-nium, agreement is achieved only for GCMs that produce climate sensitivities at the low end of the range reported by the IPCC (von Storch, 2004). This poses a dilemma as to whether empirically reconstructed climate records based on regression underestimate variability, or whether the GCMs overesti-mate sensitivity. Millennium’s reconstruc-tions are being developed specifi cally to reduce the artifi cial loss of variability at multi-decadal to centennial timescales and allow us to address this dilemma.
Revised and new proxy records will be compared to millennial-scale GCM simula-tions to derive realistic estimates of sensi-tivities of diff ering forcing parameters. Ver-sion 3 of the coupled Hadley Centre GCM (HadCM3), and its low resolution equivalent (FAMOUS), will be used for long simulations. We are using distributed volunteer comput-ers over the internet, organized through the ClimatePrediction.net project and welcome international scientifi c collaboration. Further information is available at www.millennium-project.net.
References
Esper, J., Cook, E.R. and Schweingruber, F.H., 2002: Low-frequency signals in long tree-ring chronologies for reconstructing past temperature variability, Science, 295: 2250-2253. Luterbacher, J., Dietrich, D., Xoplaki, E., Grosjean, M. and Wanner, H.,
2004: European seasonal and annual temperature variability, trends and extremes since 1500, Science, 303: 1499-1503. Mann, M.E., Bradley, R.S. and Hughes, M.K., 1999: Northern Hemisphere
temperatures during the past millennium: inferences, uncertain-ties and limitations, Geophys. Res. Lett., 26: 759-762. von Storch, H., Zorita, E., Jones, J., Dimitriev, Y., González-Rouco, F. and Tett,
S., 2004: Reconstructing past climate from noisy data, Science, 306: 679-682, Sciencexpress, doi 10.1126/science.1096109.
Year AD Missing/few proxy data Multi-proxy reconstruction back to 1000 T amplitude not understood T amplitude better quantified Calibration issues: Misfits with instrumental data Improved calibration PRESENT SITUATION Reduced uncertainty Large uncertainty 1000 1100 1200 1300 1400 1500 1600 1700 1800 1900 2000 0.0 0.5 -0.5 -1.0 Temperature anomalies ° C Relative temperature NEXT 10 YEARS...
Figure 1: The current limitations of Northern Hemisphere climatology and the advancements into detection and quantitative understanding of European climate variability that Millennium will aim to provide.
Pr
og
ram New
Pr
og
ram New
s
Paleoenvironments in south India:
Monsoon records from rainfed reservoirs
K. ANUPAMAFrench Institute of Pondicherry, India; anupama.k@ifpindia.org Reconstructions of
paleoclimates/pa-leoenvironments in south India have been largely restricted to montane (Sutra 1997), oceanic and mangrove sites (Prab-hu et al, 2004, Kumaran et al, 2005). There is very little information from modern and fossil terrestrial sites on the peninsu-la except for some studies in central India (Chauhan, 2002). This lack is significant from the viewpoint of a regional scale climate or environmental reconstruction. Hence, the focus of our research on the paleoenvironments of south India at the French Institute of Pondicherry (IFP) is to address these data gaps. The questions underlying our research are:
(i) Is it possible to generate pollen data from a network of modern sites, cover-ing diverse vegetation types, distrib-uted over distinct climatic regimes in south India?
(ii) Is it possible to identify suitable ter-restrial sites for paleoclimatic recon-struction in this region influenced by the monsoon regimes?
We are currently carrying out two proj-ects to address these questions:
The first project, on modern and fossil pollen studies in the Eastern Ghats, is in partnership with the National Re-mote Sensing Agency. ReRe-mote sensing helps by adding a spatial dimension to the temporal one provided by paly-nology and geochropaly-nology (for which we use radiocarbon and luminescence chronology depending on the site, time interval and sediment record). The second project, on reconstruction
of paleomonsoonal changes using sedimentary records from rainfed ir-rigation reservoirs (tanks) in south In-dia, is in partnership with Indian Space Research Organization. It aims to as-certain the magnitude and frequency of the southwest and northeast mon-soons, to compare recent events with long-term rainfall data in order to generate a calibration curve, to com-pare sediment records from 3 different monsoon settings (only southwest, only northeast and both southwest and northeast), and to delineate the in-fluence of human activity on the tank systems using remote sensing.
In the vast geographic area covered in these projects, remote sensing plays a very important role in shortlisting both modern pollen sampling sites and paleo-sites, namely irrigation tanks or water bodies. From the first short list, historical and archeological records (stone inscrip-tions) are used to further narrow down the choice to sites that have a well-de-fined historical date assigned to them, and finally ground truth is essential for selecting a given site for study. With this approach, essentially field-oriented, us-ing a multiproxy research methodology (Anupama et al, 2002) that is inevitably multidisciplinary and incorporating new technologies like remote sensing and the human dimension through history and archaeology, the first phase of our project has succeeded in identifying suit-able sites and generating quantitative data. We are currently analyzing these data for a synthesis aimed at delineating both monsoon behavior and human im-pacts over the last two millennia in south India.
Acknowledgements
This program is supported with external funds through the ISRO-GBP (ISRO-Geosphere Bio-sphere Programme), Government of India. The following institutions and scientists are involved with us in this research program: In-dian Space Research Organization, Bangalore (ISRO)–Dr. J.V. Thomas; National Remote Sens-ing Agency (NRSA), Hyderabad–Drs. S. Sudha-kar, Girish Pujar; Physical Research Laboratory, Ahmedabad (PRL)–Prof. A.K. Singhvi, Dr. Navin Juyal; Tamil Nadu State Archaeology Depart-ment–Dr. V. Vedachalam
References
Anupama, K., Aravajy, S. and Prasad, S., 2002: Pollen and ecological studies in the Southern Eastern Ghats: a new methodological approach, in Proc. National Seminar on Conservation of Eastern Ghats, 88-102.
Chauhan, M.S., 2002: Holocene vegetation and climate changes in southeastern Madhya Pradesh, India, Current Science, 83(12): 1444-1445.
Kumaran, K.P.N., Nair, K.M., Shindikar, M., Limaye, R.B. and Padmalal, D., 2005: Stratigraphical and palynological appraisal of the Late Quaternary mangrove deposits of the west coast of India, Quaternary Research, 64: 418-431.
Prabhu, C.N., Shankar, R., Anupama, K., Taieb, M., Bonnefille, R., Vidal, L. and Prasad, S., 2004: A 200-ka palaeoclimatic record de-duced from pollen and oxygen isotopic analyses of sediment cores from the eastern Arabian Sea. Palaeogeography, Palaeo-climatology, Palaeoecology, 214(4): 309-321.
Sutra, J-P., 1997: Histoire de la végétation et du climat au cours des 30 derniers millénaires dans le massif des Nilgiri, Inde du Sud. Approche palynologique. Ph.D. thesis, Univ. Aix-Marseille III, France.
Figure 1: Left: View of a rainfed irrigation tank, with an ancient stone sluice, historically dated to the 5th century.
Middle: Coring in a tank with a ~ 500 yr history at foothills of Eastern Ghats. Right: Trenching at another historical
6
Cosmogenic isotope
14
C: Production and carbon cycle
K. HUGHEN
Department of Marine Chemistry and Geochemistry, Woods Hole Oceanographic Institution, USA; khughen@whoi.edu
Global Δ
14C cycle
Radiocarbon is produced by galactic cosmic radiation interacting with atmospheric ni-trogen, and enters the global carbon cycle as 14CO
2, which is well mixed within the
at-mosphere. Photosynthesis fixes CO2, and hence 14CO
2, into plant organic matter and
the global food chain. In addition, CO2 dis-solves in water (primarily seawater) to form dissolved inorganic carbon (DIC) that can then be incorporated into marine carbon-ates. Conventional 14C dating assumes that
initial 14C concentration has remained
con-stant. However, atmospheric and surface ocean 14C concentrations have changed
no-tably through time. This is due to changes in either the rate of 14C production in the
at-mosphere (a function of geomagnetic field intensity and solar variability), or the distri-bution of 14C between different reservoirs
in the global carbon cycle (primarily deep ocean ventilation).
The Earth’s geomagnetic field serves to shield the atmosphere from incoming cosmic rays, and when the magnetic field strength increases, 14C production decreases
(and vice versa). Similarly, solar wind distorts the Earth’s geomagnetic field in a way that reduces 14C production, and a rise in solar
activity will cause a decline in 14C
produc-tion. Records of 14C production variability in
the past have been constructed using two primary methods: (1) as a function of past changes in geomagnetic field intensity (Laj et al., 2004) and, (2) by comparison to other cosmogenic nuclides (e.g. 10Be and 36Cl;
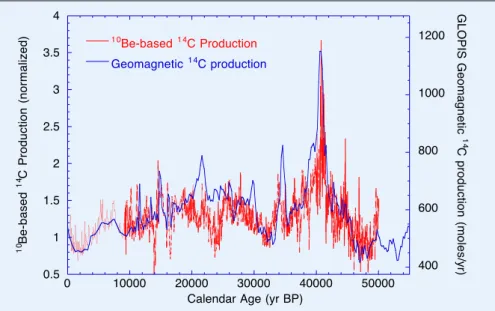
Mus-cheler et al., 2005). Over the past 50 kyr, the pattern of changes in 14C production
recon-structed using the two methods agree very well (Fig. 1), although the absolute magni-tude of 14C production rate is still largely
uncertain. The global carbon cycle contains several reservoirs that exchange carbon on timescales relevant to the lifetime of 14C
(101-104 years). Within the deep ocean in particular, 14C is sequestered from
atmo-spheric exchange long enough for decay to reduce the deep ocean 14C activity
signifi-cantly. Changes in the rate of exchange be-tween the deep ocean and the atmosphere, through fluctuations in the meridional over-turning circulation (i.e. the North Atlantic component of global thermohaline circula-tion), can strongly influence atmospheric
14C activity. However, little is known about
the detailed spatial and temporal history of deep-ocean ventilation changes and the magnitude of resulting changes in surface-ocean and atmospheric 14C.
Observed Δ
14C changes in the past
Recently, marine-based calibration data back to 50 kyr have been provided by 14C-
and 230Th-dated corals with irregular sample
spacing (Fairbanks et al., 2005; Cutler et al., 2004; Bard et al., 2004), and at higher resolu-tion from marine sediments of the Cariaco Basin (Hughen et al., 2006) and Iberian Mar-gin (Bard et al., 2004). The sediment records show distinct millennial-scale climate vari-ability that can be reliably correlated with Dansgaard-Oeschger (D-O) events in Green-land ice cores and, more recently, 230Th-dated
Hulu Cave speleothems. These correlations have been used to transfer the calendar chronologies onto the 14C series in order to
provide calibration data sets. Cariaco Basin and Iberian Margin 14C data linked to the 230Th Hulu Cave chronology show excellent
agreement with data from 230Th-dated fossil
corals back to 33 kyr, and continue to agree despite increased scatter back to 50 kyr (Fig. 2). 14C calibration data independent from a
marine-reservoir age-correction have been obtained from a 230Th-dated speleothem on
Socotra Island in the Arabian Sea. These data show a close match to the marine sediment and coral 14C records between 40-50 kyr (Fig.
2). The observed convergence of data sets from dispersed archives and geographic locales will likely provide, in the near future, the basis for an extended 14C calibration
back to 50 kyr.
Geochemical modeling and global
carbon cycle changes
The Δ14C data reveal highly elevated ∆14C
values during the Glacial period. In order
to investigate the implications of the ob-served Δ14C record, we use a carbon cycle
box model to simulate fluxes between the atmosphere, terrestrial biota plus soil/detri-tus, surface and deep oceans, and shallow and deep marine sediments containing organic and inorganic carbon. Reservoir inventories and rates of exchange are speci-fied from consensus estimates for the mod-ern (pre-industrial) carbon cycle (Hughen et al., 2004). 14C production rates are
calculat-ed as a function of geomagnetic field inten-sity (Laj et al., 2004), with a contemporary
14C production rate of 2.02 atom cm-2 sec-1
(Masarik and Beer; 1999). As noted previ-ously, however, this 14C production rate
exceeds the observed sum of 14C in active
reservoirs. A constant scaling factor is there-fore applied to the production rates in order to tune the model reservoir Δ14C values at
model year 0 to observed modern values (Atmosphere 0‰, Terrestrial Biosphere -5‰, Surface Ocean -53‰, Deep Ocean -159‰). A model simulation with fixed modern exchanges (“full carbon cycle”) but variable 14C production rate produces a
tem-poral pattern of Δ14C change similar to
pa-leo-observations, and matches the magni-tude of Δ14C change particularly during the
Holocene (Fig. 2). However, the simulation produces maximum Δ14C of only ~300‰
for the interval 20-40 kyr, whereas observed Δ14C exceeds the simulated changes by as
much as ~400‰, most prominently around ~30 and ~40 kyr.
In this simple model, reducing the sur-face-to-deep-ocean exchange produces an additional atmospheric and surface ocean
5 . 0 1 5 . 1 2 5 . 2 3 5 . 3 4 0 0 4 0 0 6 0 0 8 0 0 0 1 0 0 2 1 0 0 0 0 5 0 0 0 0 4 0 0 0 0 3 0 0 0 0 2 0 0 0 0 1 0 0 1 Be-based14CProduciton c it e n g a m o e G 14Cproduciton G LO PIS G eo m ag ne tic 14 C p ro du ctio n ( m ole s/y r) 10 Be -b as ed 14 C P ro du ct io n (n or m al iz ed ) ) P B r y ( e g A r a d n e l a C
Figure 1: 14C production rate changes from 50 to 0 kyr reconstructed using 10Be flux measured in Greenland ice cores (Muscheler et al., 2005), and as a function of geomagnetic field intensity (Global Paleointensity Stack, Laj et al., 2004; Masarik and Beer, 1999). The two methods show strong agreement in temporal patterns of production change, including distinct peaks associated with the Laschamp and Mono Lake geomagnetic minima.
Scienc
e H
ighligh
ts:
14C - Chr
onology
S
cienc
e H
ighligh
ts:
14C - Chr
onology
Δ14C response of ~200‰, encompassingmost of the Glacial age data. Reducing flux to shallow sediment reservoirs is required to match the highest observed Δ14C values.
According to the model, however, the pre-scribed change in surface-to-deep-ocean exchange would produce a doubling of the surface-to-deep-ocean Δ14C difference.
Observations do provide some evidence of decreased Glacial Δ14C in the deep western
and eastern North Atlantic, as well as deep eastern equatorial and southwest Pacific (for review see Hughen et al., 2006). How-ever, such a large change in Glacial deep ocean Δ14C has not been observed in the
western equatorial Pacific (e.g. Broecker et al., 2004). It is important to note that most of the paleo-ocean Δ14C reconstructions
correspond to the period around the Last
Glacial Maximum (~21 kyr BP), an interval when the simulated Δ14C response to
pro-duction rate changes alone is close to the observations (especially if reasonable pro-duction rate uncertainties are considered). Another serious issue is that reconstructed rates of Δ14C change at the beginning of
the last deglaciation, ~17 kyr, are too large to be explained by changes in production rate alone and require a substantial dilution of 14C atoms in the atmosphere by a more
depleted reservoir. Reconstructions of tran-sient deglacial Δ14C changes in the
inter-mediate depth western and deep eastern North Atlantic are consistent with a major reorganization of deep ocean circulation at that time, probably involving increased ven-tilation of a previously isolated deep water mass of southern or Pacific origin (e.g. Ad-0 0 2 -0 0 0 2 0 0 4 0 0 6 0 0 8 0 0 0 1 0 0 2 1 0 0 4 1 0 0 0 0 5 0 0 0 0 4 0 0 0 0 3 0 0 0 0 2 0 0 0 0 1 0 ) 4 0 0 2 , .l a t e r e lt u C ( h T / U l a r o C ) 4 0 0 2 , .l a t e d r a B ( h T / U l a r o C ) 5 0 0 2 , .l a t e s k n a b ri a F ( h T / U l a r o C ) 6 0 0 2 , .l a t e n e h g u H ( u l u H -o c a ir a C ) p e r p n i r e y e m n e y h e W ( h T / U m e h t o e l e p Sbeiran-Hulu( Bardi nprep) I 4 0 l a C t n I " e l c y c n o b r a c l l u f" l e d o M 0 0 2 -0 0 0 2 0 0 4 0 0 6 0 0 8 0 0 0 1 0 0 2 1 0 0 4 1 At m os ph er ic � 14C (‰ ) ) P B r y ( e g A r a d n e l a C Atm os ph eric � 14 C (‰ )
Figure 2: 14C activity (Δ14C) data for the past 50,000 years. IntCal04 is shown back to its limit of 26 kyr. Marine coral and sediment 14C data have been corrected with a constant reservoir age, and speleothem data have been corrected with a constant dead carbon fraction. The paleo-Δ14C observations are plotted compared to a carbon cycle box model simulation representing fixed preindustrial boundary conditions and changing 14C production (“full carbon cycle”). Error bars show 1-σ Δ14C uncertainty.
kins et al., 2002). These model simulations can place constraints on the magnitude of deep ocean ∆14C anomalies required to
ex-plain the surface marine record. In addition, the model data make quantitative predic-tions of the increase in surface marine res-ervoir age during the Glacial period. Unfor-tunately, however, observations of Glacial reservoir variability from low-latitude sites are rare. More sophisticated model simu-lations with increased spatial resolution would help identify the patterns of increase in reservoir age according to latitude and ocean basin. Regardless, it is clear that high-quality observations are needed from each of the three principal carbon reservoirs— atmosphere, surface and deep ocean—in order to constrain changes in both deep ocean ∆14C and surface marine reservoir
age, and to understand the history of radio-carbon and global radio-carbon cycle changes.
References
Broecker, W., Barker, S., Clark, E., Hajdas, I., Bonani, G. and Lowell, S., 2004: Ventilation of the glacial deep Pacific Ocean, Science, 306: 1169-1172.
Hughen, K.A., Southon, J.A., Lehman, S.J., Bertrand, C.J.H. and Turnbull, J., 2006: Marine-Derived 14C Calibration and Activity Record for
the past 50,000 Years Updated from the Cariaco Basin, Quater-nary Science Reviews, in press.
Laj, C., Kissel, C. and Beer, J., 2004: High resolution global paleointensity stack since 75 kyr (GLOPIS-75) calibrated to absolute values, in: Timescales of the Paleomagnetic Field, Channell, J., Kent, D., Low-rie, W. and Meert, J. (Eds.), American Geophysical Union, Wash-ington, D.C., 255-265.
Masarik, J. and Beer, J., 1999: Simulation of particle fluxes and cosmo-genic nuclide production in the Earth’s atmosphere, Journal of Geophysical Research, 104: 12,099-12,112.
Muscheler, R., Beer, J., Kubik, P.W. and Synal, H.A., 2005: Geomagnetic field intensity during the last 60,000 years based on 10Be and 36Cl
from the Summit ice cores and 14C, Quaternary Science Reviews, 24, 1849-1860.
For full references please consult:
www.pages-igbp.org/products/newsletters/ref2006_3.html
Assuring measurement quality: The international
14
C
laboratory inter-comparison program
E. M. SCOTTDepartment of Statistics, University of Glasgow, UK; marian@stats.gla.ac.uk
Introduction
In order to achieve reliable, precise and accurate 14C age measurements,
laboratories routinely undertake both formal and informal quality assurance programs. Such programs may involve the repeated and routine measurement of an internal standard (such as a bulk cellulose sample), the results of which enable the laboratory to evaluate their reliability and precision. They may also routinely have access to known-age material against which to assess their accuracy. Beyond this, however, many laboratories regularly participate in
in-ter-laboratory comparisons to provide independent checks on laboratory per-formance.
Reference material for
14C
calibration
High-quality 14C measurements also
re-quire traceability to international stan-dards whose 14C-activities are known
exactly by independent means, and also to reference materials whose activities are estimated and typically accompa-nied by associated uncertainty state-ments. Within the 14C community, there
has been an increasing realization of the need for adequate reference materials and a resultant development of both internal and external quality assurance (QA) procedures. Routinely, 14C
laborato-ries make use of a number of standards and reference materials whose activities are known or are estimated from large numbers of measurements made by many laboratories (e.g. NIST OxI, OxII, IAEA C1-C8). More recent 14C
inter-com-parisons have also created a further se-ries of natural reference materials (Scott, 2003, Scott et al, in prep).
8
History of inter-comparisons
Since the early days of applied 14C
mea-surement, it has been common practice for laboratories to exchange samples in attempts to improve and sustain analyti-cal confi dence. With time, this practice has given way to a succession of more formal inter-comparison exercises. Within the 14C community in the past 20 years,
there have been a number of very exten-sive inter-laboratory trials. These com-parisons have varied widely in terms of sample type and preparation, with their primary goal the investigation of the comparability of results produced under possibly quite diff erent laboratory proto-cols. Regular comparisons have reassured users that the laboratories are striving to ensure highest quality results, while at the same time allowing the laboratories to identify any systematic off sets and ad-ditional sources of variation. Thus, partici-pation in a laboratory inter-comparison has become an important part of a formal QA program.
Here we summarize some of the fi nd-ings from the two most recent 14C
inter-comparison exercises (FIRI (Fourth) and VIRI (Fifth), Scott 2003 and Scott et al, in prep.). VIRI is ongoing at this time but continues the tradition of TIRI (Third) and FIRI, operating as an independent check on laboratory procedures. It is a 4-year project, with the fi rst phase already com-pleted. Phase 2, using bone samples, is due to be reported by the end of 2006. Further stages will include samples of peat, wood and shell with a range of ages. VIRI, like the TIRI and FIRI inter-com-parisons, is a 14C community project, with
samples provided by participants and a substantial laboratory participation rate of over 75%.
What questions have been asked
and answered by these
inter-comparisons?
- Comparability of measurements from diff erent laboratories
One of the main questions that such inter-comparisons are used to answer concerns how comparable the results are among laboratories, especially where some use diff erent procedures and techniques. For the 14C dating community, this historically
concerned the comparability of results from the accelerator mass spectrometric (AMS) and radiometric (liquid scintillation (LSC) or gas proportional counting (GPC)) laboratories.
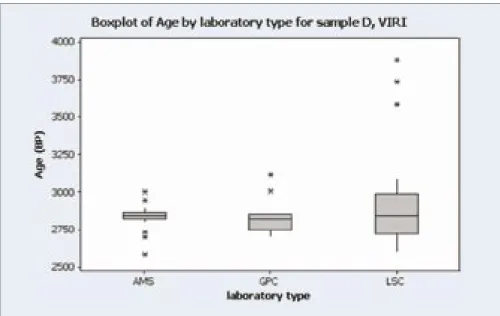
From FIRI, overall and on average, no evidence of signifi cant diff erences in the results between AMS, GPC and LSC labora-tories was found. In the fi rst phase of VIRI, a similar preliminary conclusion was drawn
(Scott et al, in prep.). Figure 1 below shows the distribution of results for sample D (charred grain) in VIRI.
- Variation
Clearly the results among laboratories do vary, but an inter-comparison exercise can assess the degree of variation and also which factors might explain such variation (aside from simply random fl uctuations). One aspect of variation concerns outliers, or extreme observations. In FIRI, roughly 10% of the total results were identifi ed as outliers (which is around twice as frequent as would be expected). An outlier is an ob-servation which is either too young or too old, defi ned statistically as those values that are greater than 3 inter-quartile rang-es from the nearrang-est of either the lower or upper quartiles. The distribution of outliers was not homogeneous across the labora-tories, with the majority of outliers coming from around only 14% of the laboratories.
Can we identify any reasons for the variation in results? Modern standard and background material used were studied but no evidence was found that these fac-tors made a signifi cant contribution to the overall variation. The type of modern stan-dard used, however, did seem associated with the outlier distribution.
- Accuracy
Accuracy is concerned with the ‘correct-ness of the result’ and refers to the de-viation (diff erence) of the measured value from the ‘true’ value. Ideally with known-age samples, this can be independently es-timated and a small number of known-age samples have been included (typically den-drochronologically dated wood). However, more commonly, we must assume that we Figure 1: Boxplot showing the distribution of results for a charred grain sample (sample D, VIRI) for the three
labora-tory types (32 AMS, 31 LSC and 10 GPC). The boxplot represents the median, lower and upper quartile and minimum and maximum. An * identifi es an outlier. The lower quartile is the value below which 25% of the results lie.
Figure 2: Off set (and 95% confi dence interval) for dendrochronologically dated samples (3200-3239 BC, 3299 - 3257 BC and 313-294 BC) showing the upper (green diamonds) and lower (red squares) limits of the 95% confi dence interval, and the point estimates of the laboratory off sets (black circles).
Scienc
e H
ighligh
ts:
14C - Chr
onology
S
cienc
e H
ighligh
ts:
14C - Chr
onology
can define (through calculation) what the ‘true’ 14C age will be (the consensus value)
and then we can estimate for each labora-tory, whether there is a constant offset (or a bias) from this consensus. The current program of inter-laboratory comparisons has afforded an opportunity for laborato-ries to assess their accuracy. In each inter-comparison, the consensus values for the unknown age samples was calculated and reported. Figure 2, , shows the offset (and 95% confidence interval) for individual laboratories based on the dendrochrono-logically dated samples included in FIRI. The sample dendro-ages were 3200-3239 BC, 3299 - 3257 BC and 313-294 BC.
Conclusions
Analyses of results from FIRI and phase 1 of VIRI support the fact that radiocarbon laboratories are generally accurate and precise. The results from FIRI are signifi-cant in that they show broad agreement between measurements made in different laboratories on a wide range of materials, and they also demonstrate no statistically significant difference between measure-ments made by radiometric or AMS tech-niques. As a result of the inter-comparison program, an extensive suite of natural ref-erence materials (such as wood, carbonate, etc) spanning the applied 14C timescale has
been created by the 14C dating community.
These can now be used by 14C labs to
im-prove their dating accuracy and are thus of great benefit to the users of 14C dates.
Acknowledgements
FIRI and VIRI are supported by EC FPIV pro-gramme and English Heritage. The assistance of sample providers is gratefully acknowledged, in addition to the support of all participating labs.
References
Scott, E.M., 2003: The Third International Radiocarbon Intercomparison (TIRI) and The Fourth International Radiocarbon Intercomparison (FIRI), Radiocarbon, 45(2):135-328.
Scott, E.M., Cook, G.T., Naysmith, P., Bryant, C. and O’Donnell, D., A report on phase 1 of the 5th International Radiocarbon inter-compari-son (VIRI), Radiocarbon, in prep.
IntCal and the future of radiocarbon calibration
P. J. REIMER1, E. BARD2, C. BUCK3, T. P. GUILDERSON4,5, A. HOGG6, K. HUGHEN7, B. KROMER8, R. REIMER1, J. SOUTHON9, C. S. M. TURNEY10, J. VANDER
PLICHT11,12, C. E. WEYHENMEYER13 AND C. B. RAMSEY14
1CHRONO Centre for Climate, the Environment, and Chronology, Queen’s University Belfast, UK; p.j.reimer@qub.ac.uk
2CEREGE, UMR-6635, Aix-en-Provence, France; 3Department of Probability and Statistics, University of Sheffield, UK; 4Center for Accelerator Mass Spectrometry
L-397, Lawrence Livermore National Laboratory, USA; 5Ocean Sciences Department, University of California, Santa Cruz, USA; 6Radiocarbon Dating Laboratory,
University of Waikato, Hamilton, New Zealand; 7Department of Marine Chemistry & Geochemistry, Woods Hole Oceanographic Institution, USA; 8Heidelberger
Akademie der Wissenschaften, Heidelberg, Germany; 9Department of Earth System Science, University of California, Irvine, USA; 10GeoQuEST Research Centre,
School of Earth and Environmental Sciences, University of Wollongong, Australia; 11Centrum voor Isotopen Onderzoek, Rijksuniversiteit Groningen, Groningen,
Netherlands; 12Faculty of Archaeology, Leiden University, Netherlands; 13Department of Earth Sciences, Syracuse University, USA; 14Oxford Radiocarbon
Accelera-tor Unit, UK
Background
In addition to being crucial to many archae-ological studies, radiocarbon ages form the chronological basis for many Holocene and late Pleistocene paleoclimatic studies and paleoenvironmental reconstructions. The basic radiocarbon age calculation assump-tion of constant atmospheric 14C content is
not valid, however, due to solar- and geo-magnetic-induced changes in production rate and ocean circulation changes. In order to compare radiocarbon chronologies with those derived from other means, such as ice core or U/Th dated sequences, it is neces-sary to calibrate against measurements of “known” age samples.
Calibration curves were originally based only on 14C measurements of
known-age tree-rings and a calibration curve for Holocene marine samples was constructed using the atmospheric data as input into a simple ocean-atmosphere box diffusion model. More recently, marine records, U-Th dated corals and foraminifera from varve-counted sediments of Cariaco Basin, com-bined with reservoir corrections, provide high-resolution atmospheric calibration be-yond the range of the tree-ring record. The ocean-atmosphere box diffusion box model, however, is used for Holocene marine cali-bration where marine calicali-bration data are generally not available with sufficient reso-lution and precision. After a disastrous start of multiple independent “calibration” data sets that yielded disparate calendar ages
and confusion among users, radiocarbon calibration curves have been constructed by small groups utilizing the best available and reproducible data sets, and ratified by the attendees at the International Radiocar-bon Conferences. As the types of records available for calibration have diversified and the pros and cons of each realized, a larger, more formalized group has become a ne-cessity. In 2002, the IntCal Working Group was created and has since met at a series of
workshops funded by the Leverhulme Trust. The IntCal group has produced estimates of the calibration curves for the main carbon reservoirs: the Northern Hemisphere atmo-sphere (IntCal04), the Southern Hemiatmo-sphere atmosphere (SHCal04), and the marine en-vironment (Marine04). SHCal04 was the first ratified calibration curve for the Southern Hemisphere.
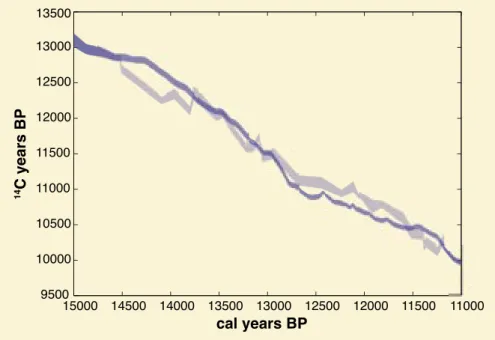
Most of the early calibration curves were constructed from a simple weighted Figure 1: Selected 14C data sets >26 cal kyr BP with calendar timescales based on U/Th dating, varve counts or through correlation to U/Th-dated speleothems. The marine and speleothem records are corrected with a constant reservoir or dead carbon fraction offset as specified in the original publication. Uncertainty is shown in the 14C ages only as one standard deviation. Corals are given as solid circles: red (Bard et al., 2004); pink (Cutler et al., 2004); green (Fairbanks et al., 2005). The Cariaco Basin foraminifera data with the timescale from the correlation to the Hulu Cave is given as open blue circles (Hughen et al., 2006), Lake Suigetsu macrofossils as solid orange triangles (Kitagawa and van der Plicht, 2000), and Arabian Sea speleothem as black crosses (Weyhenmeyer et al., 2003).
10
average of all data within a 10- or 20-year bin. This ignored the uncertainty in the calendar axis, which can be significant for some records (non-tree-ring in particular). For the 2004 curves, Buck and Blackwell (2004) devised a tailor-made curve esti-mation method based on a random walk model (RWM), which takes account of the uncertainty in both the calendar ages and radiocarbon determinations that make up the raw calibration data, and formally acknowledges the covariance of the data points (induced by the fact that they all de-rive from the same underlying radiocarbon production mechanisms).
When the IntCal Working Group com-piled the 2004 calibration data sets, many types of records were considered, including U/Th dated corals, speleothems with U/Th age models, macrofossils from varved lake sediments, and foraminifera from varved and non-varved marine sediments with cal-endar age estimates (based on correlations to ice core records). Despite reasonably good agreement between many of these records beyond the range of the tree-ring data, however, only the corals and the fora-minifera from the varved sediments were considered to meet the IntCal criteria for calibration back to 26 cal kyr BP (0 cal BP = AD 1950). As a result of these uncertainties, the group chose not to produce a calibra-tion curve for this time period; instead a modeled estimate of the curve underlying all the data sets was determined and called NotCal04 to signify that it was NOT of cali-bration quality. Because of the lack of an internationally ratified calibration curve be-yond 26 cal kyr BP, however, there has been a proliferation of “calibrations” based on in-dividual data sets or selected compilations. Although such comparisons are valuable research tools for exploring possible leads and lags in the various carbon reservoirs and for providing tentative calendar age estimates, the mixed approaches make it difficult to compare records with different age estimates and, unfortunately, have the potential for causing significant uncertainty across the scientific and archeological com-munity.
The task ahead
New and/or improved 14C data sets for the
time period beyond 26 cal kyr BP were re-ported at the 19th International Radiocar-bon Conference in Oxford (April 2006) and are generally in good agreement. Attend-ees of the conference business meeting agreed that the IntCal Working Group com-pile a standard “calibration” data set for the entire range of radiocarbon (<55 kyr BP). Due to the rapid progress in the produc-tion of 14C calibration data sets, the
Radio-carbon community expressed the need for annual updates to the curves beyond the end of IntCal04 (currently at 26 cal kyr BP). These curves would provide tentative cal-endar age estimates and would be distinct from the explicitly higher-quality, tree-ring calibration data, and not ratified in a simi-lar fashion to the IntCal curves. Ideally, data sets beyond 26 cal kyr BP should be referred to as ‘comparison curves’ until a ‘calibration curve’ is ratified. The NotCal04 estimate relied on modeling the (sometimes quite large) offsets between data sets using a ran-dom effect component, which we hope not to need for the next (non-ratified) output.
In order to provide more transparency and wider community input, an Oversight Committee including experts in a number of fields will be selected on the basis of online voting to be handled by the Radio-carbon journal. Funding is currently being sought for an IntCal Working Group meet-ing, including the Oversight Committee, to review and recommend the data to be in-cluded in the next IntCal extension, as well as for research assistance.
In addition, the current internation-ally ratified calibration curve, IntCal04, is due for a full update when the floating tree-ring extension from Germany and Switzerland are linked. This work is being undertaken through an ESF-EuroClimate grant to research groups in Heidelberg, Aix-en-Provence, Budapest, Lund, Stockholm, Stuttgart-Hohenheim and Zurich, and is expected to be completed by 2007-8. If the estimated linkage of the floating tree-ring chronology is correct, then the calibration results of terrestrial radiocarbon dates from the end of the last glaciation to the begin-ning of the Younger Dryas chronozone will be significantly different from those derived from calibration using IntCal04.
It is anticipated that terrestrial records, such as the floating kauri tree-rings or ter-restrial macrofossils from the new Lake Sui-getsu cores, will eventually provide a terres-trial radiocarbon calibration to 55 kyr with the detail necessary to resolve leads and lags in the climate system, or distinguish cause and effect of landscape changes related to early human occupation (e.g. of Australia). This cannot be achieved with the naturally smoothed marine and speleothem records (Fig. 1). In the meantime, terrestrial radio-carbon calibration or comparison curves beyond the end of the known-age tree-ring record will need to be constructed primarily from marine-based archives such as corals or foraminifera. The spatial and temporal variability of marine radiocarbon reservoir ages (MRA) is therefore an outstanding problem (c.f. Reimer & Reimer; this issue). A corollary is also present in
speleothem-based records, which have to make assump-tions on the constancy or model-estimate of the dead carbon fraction.
It has been suggested that coupled ocean-atmosphere global circulation mod-els (OGCMs) could provide some insight into past MRA. However, OGCMs have a difficult time accurately recreating the spatial distri-bution and pattern of natural and bomb 14C
in the ocean. Thus, these model simulations should not be thought of as the solution to estimate past reservoir age variations at present but more in terms of sensitivity ex-periments towards potential solutions. An updated and extended event stratigraphy approach such as that used by Bjorck et al. (2003), as well as further paleo-reservoir age measurements, where appropriate se-quences exist, should be undertaken.
And finally: semantics. What should we call the tentative calendar age curves and the resulting estimates? There needs to be some short but easily understood abbre-viation so that one can readily tell true cali-brated radiocarbon ages (derived from the use of internationally agreed radiocarbon calibration curves) from more tentative cal-endar age estimates derived from the use of an interim curve based on a non-ratified compilation of potential calibration data.
Despite these uncertainties, if all goes well, radiocarbon users can expect an up-dated IntCal04 and a new compilation curve for calendar age estimation back to 55 kyr BP in the near future. There are excit-ing times ahead.
References
Bard, E., Menot-Combes, G. and Rostek, F., 2004: Present status of radio-carbon calibration and comparison records based on Polynesian corals and Iberian Margin sediments, Radiocarbon, 46(3): 1189-1202.
Bjorck, S., Koc, N. and Skog, G., 2003: Consistently large marine reservoir ages in the Norwegian Sea during the Last Deglaciation, Quater-nary Science Reviews, 22(5-7): 429-435.
Buck, C.E. and Blackwell, P.G., 2004: Formal statistical models for es-timating radiocarbon calibration curves, Radiocarbon, 46(3): 1093-1102.
Cutler, K.B., Gray, S.C., Burr, G.S., Edwards, R.L., Taylor, F.W., Cabioch, G., Beck, J.W., Cheng, H., Moore, J., 2004: Radiocarbon calibration to 50 kyr BP with paired 14C and 230Th dating of corals from Vanuatu
and Papua New Guinea. Radiocarbon, 46(3): 1127-1160. Fairbanks, R.G., Mortlock, R.A., Chiu, T.-C., Cao, L., Kaplan, A., Guilderson,
T.P., Fairbanks, T.W., Bloom, A.L., Grootes, P.M. and Nadeau, M.-J., 2005: Radiocarbon Calibration Curve Spanning 0 to 50,000 Years B.P. Based on Paired 230Th/234U/238U and 14C Dates on Pristine
Corals, Quaternary Science Reviews, 24(16-17): 1781-1796. Hughen, K., Southon, J., Lehman, S., Bertrand, C. and Turnbull, J., 2006:
Marine-derived 14C calibration and activity record for the past
50,000 years updated from the Cariaco Basin, Quaternary Science Reviews, in press.
Kitagawa, H. and van der Plicht, J., 2000: Atmospheric radiocarbon cali-bration beyond 11,900 cal BP from Lake Suigetsu laminated sedi-ments, Radiocarbon, 42(3): 369-380.
Weyhenmeyer, C.E., Burns, S.J., Fleitmann, D., Kramers, J.D., Matter, A., Waber, H.N. and Reimer, P. J., 2003: Changes in atmospheric 14C
between 55 and 42 ky BP recorded in a stalagmite from Socotra Island, Indian Ocean, EOS Transactions, 84(46): Fall Meet. Suppl. Abstract PP32B-0298.
Scienc
e H
ighligh
ts:
14C - Chr
onology
Scienc
e H
ighligh
ts:
14C - Chr
onology
The potential for extending Intcal04 using OIS-3
New Zealand sub-fossil Kauri
A. G. HOGG1, C. S.M. TURNEY2, J. G. PALMER3, L. L. K. FIFIELD4AND M. G. L. BAILLIE5
1Radiocarbon Dating Laboratory, University of Waikato, Hamilton, New Zealand; alan.hogg@waikato.ac.nz 2GeoQuEST Research Centre, School of Earth and Environmental Sciences, University of Wollongong, Australia 3Gondwana Tree-Ring Laboratory, Canterbury, New Zealand
4Department of Nuclear Physics, Research School of Physical Sciences and Engineering, Australian National University, Canberra, Australia 5Department of Archaeology and Palaeoecology, School of Geography, Archaeology and Palaeoecology, Queen’s University, Belfast, UK
Introduction
Recent articles by Turney et al. (2006) and Balter (2006) publicized the current state of radiocarbon calibration beyond 20 kyr BP. They stress the need for new calibration studies, which are critical for developing late Pleistocene chronologies for paleo-climate and archeological research. Peat bogs in Northland, New Zealand contain large numbers of sub-fossil kauri (Agathis australis) logs in discontinuous sequences ranging in age from a few hundred years to more than 60 kyr BP. The buried trees are well preserved, often with their bark still at-tached and one has been found to contain more than 2000 rings. This article summa-rizes some current research being under-taken on the Northland sub-fossil Oxygen Isotope Stage (OIS)-3 (25 – 60 kyr BP) kauri resource by a team from New Zealand, Aus-tralia and the UK.
Sampling
OIS-3 “ancient kauri” logs are found in bogs scattered over a 300 km stretch of northern New Zealand, from about 34°50’ to 36°20’S (Palmer et al., 2006). Kauri is a highly valued timber species but past over-exploitation of living stands now means supplies are limited. The remarkable preservation state of the buried kauri and its inherent value has meant the wood is being harvested for commercial purposes. Our practice has been to take advantage of this and work alongside milling companies who use large earth moving machinery to mine the buried logs.
As the logs are extracted, we cut cross-sections from the base of the bole but above the root plate to avoid tree-ring distortion because of buttressing and fl ar-ing. Tree-ring samples are prepared and analyzed following well-documented den-drochronological techniques for ring-width measurement and cross-dating.
Dendrochronological analysis
Thus far, we have collected 167 cross-sec-tions from 16 diff erent pre-Holocene bog sites and 145 have been measured (Palmer et al., 2006). Several discontinuous fl oating chronologies have now been developed which in total span more than 10,000 years. The preliminary cross-dating has shown
that it is possible to cross-match between diff erent trees from diff erent locations (i.e. inter-site cross-matching). Furthermore, the spread in the radiocarbon ages obtained from within and between sites indicates that preservation did not take place during only one specifi c period of time. A possibil-ity therefore exists for the development of long continuous sections of chronology within OIS–3.
Radiocarbon dating
As with many paleoecological studies, ra-diocarbon dating has been critical to under-standing the relative time periods covered by the diff erent tree-ring series. Integral to radiocarbon dating OIS-3 wood is the need to achieve reproducible, low-activity radio-carbon blanks and a robust, transparent methodology for assigning standard errors to 14C ages that are close to the limit of the
method. Although fi nite radiocarbon ages on organic carbon samples beyond 50 kyr BP are becoming more common in the lit-erature, few attempts have been made to demonstrate their accuracy or precision. We have established a robust methodol-ogy, permitting accurate and reproducible
14C dates in the 50-60 kyr BP age range,
by both high-sensitivity liquid scintillation counting (LSC) and accelerator mass spec-trometry (AMS) methods (Hogg et al., sub-mitted; Hogg et al., accepted; Turney et al., accepted).
The reproducibility of these methods can be seen in Figure 1. The graph shows
14C activities for 9 consecutive 100-ring
blocks of wood extracted from a sub-fossil kauri log (mean age of ca. 61 kyr BP) close to background age.
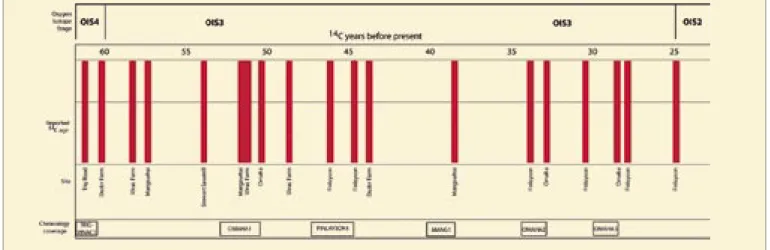
Of the 16 sub-fossil (pre-Holocene) kauri sites, 7 have returned fi nite radiocar-bon ages from the α-cellulose wood frac-tion spanning the full range of OIS-3 (Fig. 2). Ages of 24.9 kyr BP, 27.8 kyr BP (Finlayson Farm) and 28.5 kyr BP (Omaha Flats) indi-cate that stands of kauri are preserved at the end of OIS-3 and the transition into OIS-2. In contrast, material obtained from sites such as Trig Rd (62.2 kyr) demonstrates that trees are available towards the limits of radiocar-bon dating and towards the transition into OIS-4. In between these extreme dates, we have identifi ed trees that fall throughout OIS-3, suggesting that climatic and envi-ronmental conditions were suitable for pre-serving material during this time period.
Conclusions
The determination of a reliable, calibrated timescale encompassing the full range of the radiocarbon dating method is crucial if we are to understand fully the mechanisms of climatic, archeological and environmen-tal change through the last glacial period. Unfortunately, however, there is no inter-nationally accepted radiocarbon calibra-tion curve beyond 26 kyr BP, largely due to inherent problems with the materials used. Ideally, dendrochronologically dated sub-fossil trees can provide annually resolved samples on an absolute timescale, with the Figure 1: 14C activities (F14C%) for nine consecutive 100-ring blocks extracted from Vinac Farm, tree 6, by both LSC and AMS (data from Hogg et al., accepted).
12
additional assurance that their carbon con-tent is truly representative of atmospheric CO2 at the time of growth. The principal sources of uncertainty that have plagued other attempts at calibration in this time range are thereby avoided. We have shown the considerable potential of New Zealand kauri (Agathis australis) for developing long fl oating sections of calibration curve in the time period 26-60 kyr BP and the LSC and AMS techniques that are required to ob-tain precise and reproducible ages at these older time periods. It must be remembered
Figure 2: Chronologies and distribution of fi nite α-cellulose 14C ages obtained on sub-fossil Agathis australis (Northland, New Zealand) – modifi ed from Turney et al., accepted).
that IntCal04 teams took approx. 30 years to build 26,000 years of chronology. Although signifi cant progress has been made with the kauri, a considerable investment in both time and resources will be necessary if this enormous task is to be completed.
References
Balter, M., 2006: Radiocarbon dating’s fi nal frontier, Science, 313: 1560-1563.
Hogg, A.G., Fifi eld, L.K., Palmer, J.G., Turney, C.S.M., Galbraith, R. and Robertson, S.A., Robust radiocarbon dating of wood samples by high sensitivity liquid scintillation spectroscopy in the 50 – 70 ka age range. Radiocarbon, submitted.
Hogg, A.G., Fifi eld, L.K., Palmer, J.G., Turney, C.S.M., Galbraith, R. and Robertson, S.B., Dating ancient wood by high sensitivity liq-uid scintillation counting and accelerator mass spectrometry – pushing the boundaries. Quaternary Geochronology, accepted. Palmer, J., Lorrey, A., Turney, C.S.M., Hogg, A.G., Fifi eld, L.K., Baillie, M.G.L. and Ogden, J., 2006: Extension of New Zealand kauri (Ag-athis australis) tree-ring chronologies into Oxygen Isotope Stage (OIS)-3, Journal of Quaternary Science, 21(7): 779-788. Turney, C.S.M., Fifi eld, L.K., Palmer, J.G., Hogg, A.G., Baillie, M.G.L.,
Gal-braith, R., Ogden, J., Lorrey, A. and Tims, S.G., Towards a radio-carbon calibration for oxygen isotope stage 3 using New Zealand kauri (Agathis australis). Radiocarbon, accepted.
Turney, C.S.M., Roberts, R.G. and Jacobs, Z., 2006: Progress and pitfalls in radiocarbon dating, Nature, 443: doi: 10.1038/nature05214.
Marine reservoir corrections and the calibration curve
R. W. REIMERAND P. J. REIMER
14CHRONO Centre for Climate, the Environment, and Chronology, Queen’s University Belfast, UK; r.reimer@qub.ac.uk
The surface ocean carbon reservoir is variable both spatially and temporally, causing calibration of radiocarbon dates of organisms that have taken up marine carbon to be fraught with uncertainty. The paucity of reservoir age data that existed in 1993 on the publication of the seminal paper on the technique (Stuiver and Bra-ziunas, 1993) has been alleviated to some extent. The largest archive of published ΔR data, which is located at http://calib. org/marine, now contains more than 800 entries (Fig. 1). However, these data are of varying usefulness in determining the ap-parent age of the ocean water where they were collected. The following paragraphs will outline the considerations to make in combining, or averaging, available data to form a ΔR estimate for a particular locality, focusing initially on Holocene samples for which modern day ΔR are likely to be valid. Recommendations for the improvement of data quality will be made, followed by a discussion of how time variability should be incorporated in ΔR values.
ΔR is calculated by obtaining inde-pendent calendar and radiocarbon ages
for an organism that has sampled marine carbon. The most straightforward method to obtain the calendar age is to ascertain the year of death of the organism from his-torical records. It may also be obtained by carbon dating a terrestrial sample that can be unambiguously paired with a marine sample. Modern (post bomb) samples are avoided for this purpose because the dis-tribution and ocean uptake of 14C derived
from atmospheric weapons testing is
highly variable. Once the cal age is known, it is used to look up a 14C age in the ‘global’
marine calibration curve. The diff erence between this 14C age and the measured 14C
age of the marine sample is defi ned as ΔR. A Bayesian technique that relaxes the con-temporaneity requirement between the terrestrial and marine samples has been developed (Jones and Nicholls, 2002) to quantify uncertainty in the match up of the calendar ages of the paired samples. Figure 1: Locations of ΔR values in the Marine Reservoir Correction Database; http://calib.org/marine.