Determining the relative importance of figures in journal
articles to find representative images
Henning M¨
uller
ab, Antonio Foncubierta-Rodr´ıguez
a, Chang Lin
c, Ivan Eggel
a aUniversity of Applied Sciences Western Switzerland (HES–SO), Sierre, Switzerland;
bMedical Informatics, University Hospitals & University of Geneva, Switzerland;
cFujian Medical University, Fuzhou, China.
ABSTRACT
When physicians are searching for articles in the medical literature, images of the articles can help determining relevance of the article content for a specific information need. The visual image representation can be an advantage in effectiveness (quality of found articles) and also in efficiency (speed of determining relevance or irrelevance) as many articles can likely be excluded much quicker by looking at a few representative images. In domains such as medical information retrieval, allowing to determine relevance quickly and accurately is an important criterion. This becomes even more important when small interfaces are used as it is frequently the case on mobile phones and tablets to access scientific data whenever information needs arise. In scientific articles many figures are used and particularly in the biomedical literature only a subset may be relevant for determining the relevance of a specific article to an information need. In many cases clinical images can be seen as more important for visual appearance than graphs or histograms that require looking at the context for interpretation. To get a clearer idea of image relevance in articles, a user test with a physician was performed who classified images of biomedical research articles into categories of importance that can subsequently be used to evaluate algorithms that automatically select images as representative examples. The manual sorting of images of 50 journal articles of BioMedCentral with each containing more than 8 figures by importance also allows to de-rive several rules that determine how to choose images and how to develop algorithms for choosing the most representative images of specific texts.
This article describes the user tests and can be a first important step to evaluate automatic tools to select representative images for representing articles and potentially also images in other contexts, for example when representing patient records or other medical concepts when selecting images to represent RadLex terms in tutorials or interactive interfaces for example. This can help to make the image retrieval process more efficient and effective for physicians.
Keywords: medical image classification, information retrieval, image importance, image clustering
1. INTRODUCTION
Image retrieval and image classification have been an extremely active research domain with hundreds of
pub-lications in the past 20 years.1–3 Many articles have focused on techniques and basic academic ideas with few
real applications. A single early user test is described in4 in detail and afterwards most often prototypes are
described with littel integration into a clinical setting. In recent years there have been several approaches that
gear better towards clinical applications in finding similar cases,5, 6 or classifying tissue types into disease
cate-gories7, 8 for aiding diagnosis directly. There has also been much work in finding out more about specific needs
of radiologists or other physicians regarding image retrieval applications.9–11 One of the main domains of image
retrieval has been the medical literature with millions of images being available,12, 13even an annual evaluation
campaign evaluates the retrieval of images from the literature called ImageCLEF∗.14In this benchmark, 15–20
teams compare their approaches each year on a variety of search tasks using the medical literature. Particularly
the increased use of mobile interfaces for medical information search15 requires a good representation of the
content to be shown to the clinicians. Being able to determine the relative importance of medical images inside
Further author information: (Send correspondence to Henning M¨uller, Email: [email protected])
∗
a scientific article can thus help to present the right images to an information seeker in addition to relevance being determined by associated key words.
A large variety of search systems have also become available on the Internet. Most of these only allow text search but visual search functionalities can equally be expected for the future. One of the most frequently used
systems is Goldminer†16 of the ARRS (American Roentgen Ray Society), Yottalook‡ is another example and
Springer makes all their journal images available at§. The KHRESMOI (Knowledge Helper for Medical and
Ohter Information Users) project also makes a demo available from their web page¶ that allows visual search for
2D images of the literature and search in 3D clinical data.
Only very few systems have looked into relative performance of several images in a single document, but
determining the importance of images to specific search tasks is also described in.17 Other related articles on
finding figures in the literature include.18, 19
Relative figure importance is difficult to measure in any automatic way. To evaluate automatic tools for determining the importance of figures inside a single article, a user test needs to determine ground truth and basic rules for analyzing image importance. Goal of this article is clearly to find such rules for image importance by having medical doctors analyze several scientific medical articles that include diagnostic images. The user test created the desired ground truth and a baseline for selecting important images automatically and use the importance information to rank results in additional to key word importance. The test also gave us several rules that allow choosing representative images automatically. First tests in evaluating a system for choosing representative images show promising results.
The rest of the paper is organized as follows: Section 2 describes the dataset and the user test performed. Section 3 presents the results of the user test in two ways: the rules identified by the user and the correlation of measurable features with the importance of figures. Finally, conclusions and future work are discussed in Section 4.
2. METHODS
This section describes the dataset and the user test for this work.
2.1. Dataset
The ImageCLEF14 benchmarking event yearly releases a dataset of articles from the open access biomedical
literature available at BioMed Central. The ImageCLEF 2012 dataset contains over 75,000 articles and over
300,000 images.20 Among these articles, a selection of those that contain a large number of figures was used.
The threshold for this selection was established at a minimum of eight images per article. This yielded a set of more than 800 articles, out of which a selection of 50 articles containing also diagnostic images was chosen as the dataset for the user test described in Section 2.2. Articles not containing diagnostic images were discarded as the work is mainly on medical image analysis and not so much in domains such as biology and biology without a diagnosis dimension. Tools our projects aim at are mainly for diagnosis support.
The 50 selected articles contained a total of 641 images, distributed as shown in Figure 1. This shows that a few articles contain a very large number of figures whereas most only contain a number slightly above the limit.
2.2. User test
After selecting the articles for the dataset, a user test was designed to obtain annotations on the importance of each of the 641 figures with respect to the articles they belonged to. A set of five categories sorted by importance was defined and given to the physician with the following instructions to classify each figure importance relative to the importance of other figures in the article:
† http://goldminer.arrs.org/ ‡ http://www.yottalook.com/ § http://www.springerimages.com/ ¶ http://www.khresmoi.eu/
10 15 20 25 30 35 40 45 50 55 0 1 2 3 4 5 6 7 8 9 10
Histogram of the number of figures per article in the dataset
Number of figures
Number of articles
Figure 1. Histogram of the number of figures per article in the dataset used for the user tests.
Most important figure. The single image that best describes the content of the paper. Each article must
contain one and only one figure in this category.
Essential figures. Additional figures that are essential for understanding the article. For each article, the user
can assign up to three figures to this category but no minimum number is required.
Important figures. Additional figures that are important but not essential for understanding the content of
the article. For each article, the user can assign up to three figures to this category but no minimum number is required.
Little important figures. Figures that have little importance in the content of the article. There are no
limitations for this category, the user may assign as many figures as required to this category.
Totally unimportant figures. Figures that are completely irrelevant to the content of the article. There are
no limitations for this category, the user may assign as many figures as required to this category.
The user test was performed with a 45–year–old physician who is a surgeon by training and works in a large teaching hospital. The person is working with a varied set of images on a daily basis and has much experience in reading the scientific literature for clinical work. The physician controlled the content of all articles and was able to understand this content to judge subsequently the figures. The dataset of 50 scientific articles of the medical open access literature were presented to him with the goal to classify images into the previously described categories.
The physician was asked to participate in a scenario consisting of searching for relevant articles on the topic of the article for clinical work. Therefore, he had to read the article and understand the main content. Whenever he found something that was a general statement or rule he wrote this down and transmitted it to us in addition to the ratings and also to explain his ratings.
3. RESULTS
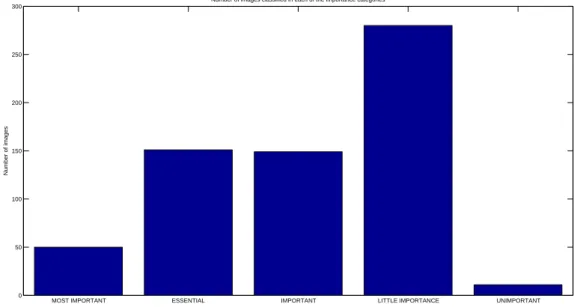
The results of the user tests showed that the importance of figures was distributed as shown in Figure 2. Apart from the expected value for the most important category, several results need to be highlighted. Figures are in general considered important for understanding the articles, since there is an enormous difference between
the least important categories. This means that it is very improbable that one figure in a scientific article is completely irrelevant for the content, even though they might not be the best in representing the content. Another interesting result is that the maximum number of figures has been assigned to the essential and important categories, which clearly underlines the previous idea of the intrinsic importance of a majority of the figures.
MOST IMPORTANT ESSENTIAL IMPORTANT LITTLE IMPORTANCE UNIMPORTANT 0 50 100 150 200 250 300
Number of images classified in each of the importance categories
Number of images
Figure 2.Distribution of the 641 images in the dataset across importance categories.
In the following subsections, the results are presented and described in detail with respect to each of the goals of this work. Section 3.1 describes the rules that were obtained as an outcome of the user test and Section 3.2 proposes measurable visual and multimodal features that can model the importance of the figures in an article according to the analysis of results. Finally, a few examples of figures sorted according to importance are given in Section 3.3
3.1. Rules for determining figure importance
The physician was asked to write down any rule that he seemed to find in how he determined relative figure importance. These rules and a few articles were then reviewed among several people to determine the most important rules that can be generalized. Redundant rules were removed in this process and a good understanding of the process was defined. Over 30 rules were written done and many described similar concepts or situations. The main remaining rules are summarized here:
• in general, diagnostic images are more important than graphs and system overviews;
• when several images represent the same concepts, diversity in the results becomes important, so only one of near duplicates should be shown and diversity should be favored;
• images of small size or poor resolution are not regarded as important;
• the most important images should underline the conclusions of an article (the highest importance is usually appearing in the results and not the methods section);
• classical images or imaging modalities are more important than very specific and rarely used modalities, so results can be reproduced and understood by many persons;
• most often the image with the highest magnification is most important (for example showing details of another image);
• images showing pathologies clearly are more important than other ones that might be used as a comparison, for example of a normal case;
• MRI is often more important for soft tissues diseases, CT for bone related diseases, so the anatomic region can be important for determining the modality that is most important;
• compound images are often more important than single images of the same type as they often contain more and related information to understand an article globally;
• in conventional images statistical graphs are most important, whereas overviews are less so.
This list of rules shows several possibilities to model the figure importance and determine automatically what is important and what is not. Clustering all figures and then removing extremely similar figures can be done automatically to increase diversity in the representation of an article. Also checking whether an image is a sub part of another image is possible visually. For determining what type of modality is importance it would be necessary to analyze the figure captions and check anatomic region and pathology that can then be used in
combination with a terminology such as RadLex21 to determine what might be the most important modalities.
In general it seems possible to model many of the rules in an automatic way to optimize results shown on screen.
3.2. Features that model importance
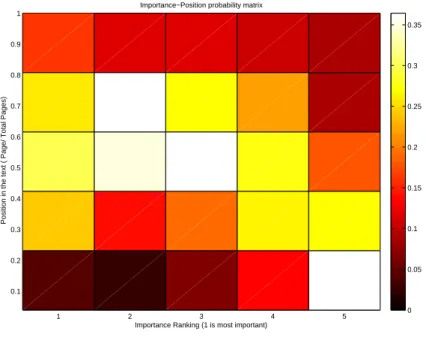
A strong relationship among the position of the figure in the text and the importance assigned to it was found in the results of the user test, as shown in Figure 3, which shows the probability matrix for figure importance according to the position in the text. This is in contradiction to what is most often used at the moment, so using the first N images of an article and it would actually be much better to use the opposite strategy and use the last n images of a text.
1 2 3 4 5 0.1 0.2 0.3 0.4 0.5 0.6 0.7 0.8 0.9 1
Importance−Position probability matrix
Importance Ranking (1 is most important)
Position in the text ( Page/ Total Pages)
0 0.05 0.1 0.15 0.2 0.25 0.3 0.35
Figure 3.Color–coded probability of importance according to position in the text, column–wise normalized.
The main comments make clear that a purely visual selection of the figures is difficult to realize as the place of the figure inside the text plays an important role. The position and also information in the captions on modality and anatomic region need to be combined with visual features to obtain optimal performance. Still, several visual tools can be used to select the figures and modify the ranking for finding the relative importance. First
of all, clinical figures can be separated from the non–clinical figures through visual image classification as the are generally more important. Inside the group of clinical figures a clustering can be performed to have groups of images together and then choose the cluster centers of these groups as representative figures to avoid having several times very similar figures but have a maximum diversity. Among the non–medical figures an analysis of the image types can give an order of importance as well. Then, the context information can be used, meaning the place of the figure in the text. Most important figures are in conclusions and then the next most important part in the results section. This information can then be used to modify the final ranking or decision of which images to use for representing the article.
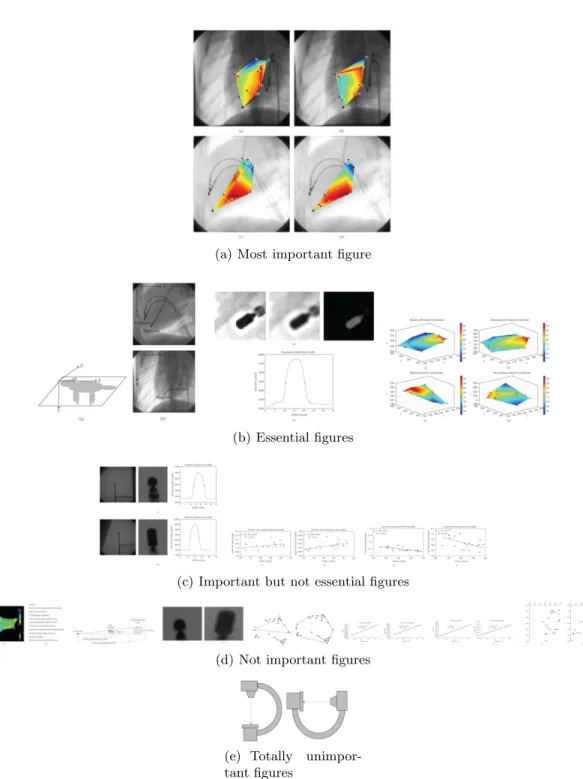
3.3. Examples of the importance of figures in one article
This subsection gives an example of one article and the importance of the figures in the article as judged by a physician. Figure 4 shows the figures of the article ordered by importance. This article was chosen as it highlighted several of the general rules found on determining importance. It can be seen that the most important figure is the one that underlines the results and conclusions of the article (Figure 4(a)). In addition to this, essential figures need to be considered as a group that provides a variety of diagnostic images, results and interpretations (Figure 4(b)). On the other hand, the least important figures are those that provide only numeric data or diagnostic images without annotations or interpretations (See Figures 4(c) and 4(d)) or that contain content already shown in other images. Finally, irrelevant figures are those that contain purely descriptive images of known procedures or techniques (Figure 4(e)).
4. CONCLUSIONS
The user test and computer modelling described in this articles brings important insight into how relative importance of visual content in scientific articles can be determined approximately. This knowledge can then be used to improve existing tools for medical image retrieval by selecting the visual content with the highest information gain to the information seekers. Such a tool can help for many types of information search and avoids that as currently often the case, the first figures or random figures are chosen to represent information. Particularly small interfaces such as mobile phones or tablets often require selecting representative information for showing documents and in this case choosing in an optimal way can massively improve results.
To our knowledge no other user test exists on determining the relative importance of images in journal articles for representing the content of the text. Having a clearer understanding of the rules for determining relevance and also being able to model this automatically can help to build tools that present medical knowledge better to the physicians to improve the effectiveness and efficiency of information search. First ideas for automatically modeling this to rank article figures for importance were implemented and now need to be analyzed quantitatively with the data created by the physician.
Obviously, there is subjectivity in attributing the categories to figures. Inter–rater disagreement can help finding this out and will also be useful for judging the quality of automatic tools to automatically determine the performance of figures. We plan to have a second round of figure importance analysis to analyze such inter–rater disagreement with another physician on the same set of articles. This can also help us to find additional rules but also maybe contradictions in choosing the importance of figures.
In any case, the results of the user test already allow us to chose representative images with some clear visual rules in mind and should help information presentation to users. To navigate in the massive amounts of biomedical scientific articles available it is really essential to find new ways for search content but also for visualizing results and choosing the optimal images for representing in this case scientific articles.
5. ACKNOWLEDGEMENTS
We would like to thank the European Union for their funding in the context of the Khresmoi project (grant number 257528), the WIDTH project and the Swiss National Science foundation (grant number 205321–130046).
(a) Most important figure
(b) Essential figures
(c) Important but not essential figures
(d) Not important figures
(e) Totally unimpor-tant figures
Figure 4. Images of the article “Is single–view fluoroscopy sufficient in guiding cardiac ablation procedures?”22 sorted
REFERENCES
1. H. M¨uller, N. Michoux, D. Bandon, and A. Geissbuhler, “A review of content–based image retrieval systems
in medicine–clinical benefits and future directions,” International Journal of Medical Informatics 73(1), pp. 1–23, 2004.
2. C. Akg¨ul, D. Rubin, S. Napel, C. Beaulieu, H. Greenspan, and B. Acar, “Content–based image retrieval in
radiology: Current status and future directions,” Journal of Digital Imaging 24(2), pp. 208–222, 2011. 3. L. H. Y. Tang, R. Hanka, and H. H. S. Ip, “A review of intelligent content–based indexing and browsing of
medical images,” HIJ 5, pp. 40–49, 1999.
4. A. M. Aisen, L. S. Broderick, H. Winer-Muram, C. E. Brodley, A. C. Kak, C. Pavlopoulou, J. Dy, C.-R. Shyu, and A. Marchiori, “Automated storage and retrieval of thin–section CT images to assist diagnosis: System description and preliminary assessment,” Radiology 228, pp. 265–270, July 2003.
5. G. Quellec, M. Lamard, G. Cazuguel, C. Roux, and B. Cochener, “Case retrieval in medical databases by fusing heterogeneous information,” IEEE Transactions on Medical Imaging 30, pp. 108–118, jan. 2011.
6. A. Depeursinge, A. Vargas, A. Platon, A. Geissbuhler, P.-A. Poletti, and H. M¨uller, “3D case–based retrieval
for interstitial lung diseases,” in MCBR–CDS 2009: Medical Content–based Retrieval for Clinical Decision Support, Lecture Notes in Computer Science (LNCS), pp. 39–48, Springer, February 2010.
7. A. Depeursinge, D. Racoceanu, J. Iavindrasana, G. Cohen, A. Platon, P.-A. Poletti, and H. M¨uller,
“Fus-ing visual and clinical information for lung tissue classification in high–resolution computed tomography,” Artificial Intelligence in Medicine 50, pp. 13–21, September 2010.
8. F. Chabat, G.-Z. Yang, and D. M. Hansell, “Obstructive lung diseases: Texture classification for differenti-ation at CT,” Radiology 228, pp. 871–877, September 2003.
9. H. M¨uller, C. Despont-Gros, W. Hersh, J. Jensen, C. Lovis, and A. Geissbuhler, “Health care
profession-als’ image use and search behaviour,” in Proceedings of the Medical Informatics Europe Conference (MIE 2006), IOS Press, Studies in Health Technology and Informatics, pp. 24–32, (Maastricht, The Netherlands), August 2006.
10. T. Tsikrika, H. M¨uller, and C. E. Kahn Jr., “Log analysis to understand medical professionals’ image
searching behaviour,” in Proceedings of the 24th European Medical Informatics Conference, MIE2012, 2012.
11. D. Markonis, M. Holzer, S. Dung, A. Vargas, G. Langs, S. Kriewel, and H. M¨uller, “A survey on visual
information search behavior and requirements of radiologists,” Methods of Information in Medicine 51(6), pp. 539–548, 2012.
12. H. M¨uller, J. Kalpathy-Cramer, C. E. K. Jr., and W. Hersh, “Comparing the quality of accessing the medical
literature using content–based visual and textual information retrieval,” in SPIE Medical Imaging, 7264, pp. 1–11, (Orlando, Florida, USA), February 2009.
13. T. M. Deserno, S. Antani, and L. R. Long, “Content–based image retrieval for scientific literature access,” Methods of Information In Medicine 48, pp. 371–380, July 2009.
14. J. Kalpathy-Cramer, H. M¨uller, S. Bedrick, I. Eggel, A. Garc´ıa Seco de Herrera, and T. Tsikrika, “The CLEF
2011 medical image retrieval and classification tasks,” in Working Notes of CLEF 2011 (Cross Language Evaluation Forum), September 2011.
15. A. Depeursinge, S. Duc, I. Eggel, and H. M¨uller, “Mobile medical visual information retrieval,” IEEE
Transactions on Information Technology in BioMedicine 16, pp. 53–61, January 2012.
16. C. E. Kahn and C. Thao, “Goldminer: A radiology image search engine,” American Journal of Roentgenol-ogy 188(6), pp. 1475–1478, 2007.
17. H. Yu, F. Liu, and B. P. Ramesh, “Automatic figure ranking and user interfacing for intelligent figure search,” PLoS ONE 5, p. e12983, 10 2010.
18. B. Rafkind, M. Lee, S.-F. Chang, and H. Yu, “Exploring text and image features to classify images in bioscience literature,” in Workshop on Linking Natural Language Processing and Biology: Towards Deeper Biological Literature Analysis, pp. 73–80, (New York, NY, USA), 2006.
19. T. Sidhu, J. Klavans, and J. Lin, “Concept disambiguation for improved subject access using multiple knowledge resources,” in Proceedings of the Workshop on Language Technologyg for Cultural Heritage Data, LaTeCH 2007, pp. 25–32, Association for Computational Linguistics, (Stroudsburg, PA, USA), 2007.
20. H. M¨uller, A. Garc´ıa Seco de Herrera, J. Kalpathy-Cramer, D. Demner Fushman, S. Antani, and I. Eggel, “Overview of the imageclef 2012 medical image retrieval and classication tasks,” in Working Notes of CLEF 2012 (Cross Language Evaluation Forum), September 2012.
21. C. P. Lanlotz, “Radlex: A new method for indexing online educational materials,” Radiographics 26, pp. 1595–1597, 2006.
22. P. Fallavollita, “Is single–view fluoroscopy sufficient in guiding cardiac ablation procedures?,” International Journal of Biomedical Imaging 2010(631264), 2010.