HAL Id: hal-00438681
https://hal.archives-ouvertes.fr/hal-00438681
Submitted on 25 Jan 2021
HAL is a multi-disciplinary open access
archive for the deposit and dissemination of
sci-entific research documents, whether they are
pub-lished or not. The documents may come from
teaching and research institutions in France or
abroad, or from public or private research centers.
L’archive ouverte pluridisciplinaire HAL, est
destinée au dépôt et à la diffusion de documents
scientifiques de niveau recherche, publiés ou non,
émanant des établissements d’enseignement et de
recherche français ou étrangers, des laboratoires
publics ou privés.
Rupture complexity of a moderate intraplate earthquake
in the Alps: the 1996M5 Epagny–Annecy earthquake
F. Courboulex, N. Deichmann, J.-C. Gariel
To cite this version:
F. Courboulex, N. Deichmann, J.-C. Gariel. Rupture complexity of a moderate intraplate earthquake
in the Alps: the 1996M5 Epagny–Annecy earthquake. Geophysical Journal International, Oxford
University Press (OUP), 1999, 139, pp.152-160. �10.1046/j.1365-246X.1999.00931.x�. �hal-00438681�
Rupture complexity of a moderate intraplate earthquake in the Alps:
the 1996 M5 Epagny–Annecy earthquake
Franc¸oise Courboulex,1 Nicholas Deichmann2 and Jean-Christophe Gariel3
1 UMR Ge´osciences Azur, UNSA, CNRS, 06560 Valbonne, France. E-mail: courboul@faille.unice. fr 2 Swiss Seismological Service, ET H-Ho¨nggerberg, 8093 Zu¨rich, Switzerland
3 Institut de Protection et de Surete´ nucle´aire, 92265 Fontenay aux Roses, France
Accepted 1999 May 21. Received 1999 May 17; in original form 1998 November 20
S U M M A R Y
The magnitude 5 Epagny–Annecy earthquake of 1996 July 15 is the largest seismic event to have occurred in the Alps since the introduction of modern digital instrumentation. This strike-slip event was located on the Vuache Fault, near the town of Annecy, in the northern French Alps.
The aim of our work was to retrieve the main parameters of the rupture process of this earthquake from seismograms recorded at local and regional distances (20–300 km). To eliminate path and site effects from the seismograms, we compared the main shock recordings at each station with those of the largest aftershocks nearby. We used a combination of techniques, including pulse-width measurements and cross-correlation of velocity traces, comparison of P-wave displacement pulses, and empirical Green’s function deconvolution, to retrieve the apparent duration of the rupture process as seen at each station. Our results demonstrate that, in the absence of on-scale data, P-wave pulse-width measurements on clipped signals can be misleading if the rupture process is complex. In the case of the Annecy earthquake, comparisons of on-scale P-wave displacement seismograms and the empirical Green’s function deconvolutions show that the rupture process consisted of at least two subevents separated by 0.2–0.3 s, and with a total duration of about 0.5 s. The systematic azimuthal dependence of both the shape and duration of the apparent source-time function is consistent with a nearly unilateral propagation of the main rupture phase in a southeast direction along the fault plane and parallel to the direction of slip. An isochron analysis reveals that the first subevent occurred slightly to the northwest of the nucleation point but that the second subevent was located further to the southeast, thus confirming the overall rupture directivity towards the southeast. An interpretation of our results in light of the previously documented aftershock distribution and of observations of ground cracks in the epicentral area suggests that the main shock occurred on the Vuache Fault, and that rupture in a northwest direction was inhibited by a right-lateral stepover in the fault. Accordingly, the vast majority of the subsequent aftershocks, which include several magnitude 3–4 events, occurred on a fault segment that is slightly offset from the inferred surface trace of the Vuache Fault and that was activated by the main shock.
Key words: Alps, earthquake-source mechanism, Green’s function, intraplate, rupture.
Beroza & Ellsworth 1996; Mori 1996; Courboulex et al. 1996; I N T R O D U C T I O N
Haddon & Adams 1997; Courboulex et al. 1998; Fletcher & Spudich 1998). However, these studies are still rare because of Most seismic source studies have been undertaken for
earth-the lack or earth-the low quality of near-source data and because quakes with magnitudes larger than 6. The reason for this is
of difficulties in the interpretation of the results. In regions not only the social impact of such large events, but also the
such as central Europe, where no large earthquakes have need for there to be enough records of the required quality.
been recorded, it is especially important to study in detail Recently, with the development of dense seismic networks,
the rupture processes of moderate-size events, since they are more and more seismologists have tried to study the rupture
process of moderate and small earthquakes (Hough 1996; the only witness of rapid movement on active faults.
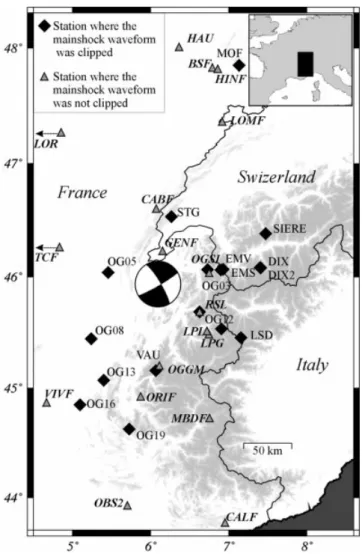
T he 1996 M5 Epagny–Annecy earthquake 153 In this paper we study the source process of the Epagny– check whether these two types of data give the same results. The final set of stations used is shown in Fig. 1, with different Annecy earthquake of 1996. This event, which occurred on
1996 July 15 at 00 : 13 near the city of Annecy, in the northern symbols depending on whether the main shock records were clipped or not.
part of the French Alps, reached an epicentral intensity of VII–VIII (MSK) and caused total damages to buildings esti-mated at 300 million French francs (about 50 million US
D ATA AN A LY S I S dollars). Magnitude estimates range between 4.2 and 5.3 with
a median value of 5.0 (Thouvenot et al. 1998). A comprehensive One difficulty in seismic source studies is the removal of path and site effects from the observed seismograms. In the case of paper by Thouvenot et al. (1998) presents the main-shock and
the aftershock locations and focal solutions, as well as details the Annecy earthquake, this removal is not easy because the crustal structure in the Alps is complex and not well known of the seismotectonic setting, site effects and other coseismic
phenomena. and because the source was shallow (2–3 km), causing the ray paths to be strongly affected by the near-surface layers. At For our purpose, the Epagny–Annecy event is of particular
interest for several reasons: the relatively high frequencies of interest here, it is therefore impossible to compute theoretical Green’s functions with (1) it is the most significant earthquake to have occurred in
sufficient accuracy. A common approach to circumventing this the Alps since the beginning of digital instrumental observations
problem is to use the seismograms of a smaller event as an (Vogt 1979; Nicolas et al. 1990; Lambert & Levret-Albaret
empirical Green’s function (EGF) (Hartzell 1978; Mueller 1996) and has been recorded by many stations at local and
1985). The conditions for this technique to work are that regional distances in France, Italy and Switzerland;
the source of the smaller event is located close enough to the (2) it was followed by several hundreds of aftershocks which
hypocentre of the main shock and that it has a similar focal were also recorded by local and regional seismic networks;
mechanism. Moreover, the small event must be sufficiently (3) it is clearly related to a well-known strike-slip fault that
reaches the surface (the NW–SE-trending Vuache fault), as demonstrated by the focal mechanism (Fig. 1), the aftershock locations (Fig. 9) and the shallow focal depth of 2–3 km (Thouvenot et al. 1998).
The aim of this study is to retrieve the source dimension, the duration of the rupture process, its directivity and its relation to the aftershock distribution. Using all the available recordings of the main shock and the largest aftershocks, we adopted an empirical Green’s function approach to remove the contributions of path and instrument from the seismograms of the main shock.
AVA I L A B L E D ATA
The Epagny–Annecy earthquake was recorded by many seismic networks in France (LDG1, IPSN2, Sismalp3, Renass4, TGRS5, Rosalp6, RAP7), in Italy (Dister8) and in Switzerland (SED9). We made a selection among this large number of records: first, we kept only the stations that recorded both the main shock and at least one of the largest aftershocks that was suitable as an empirical Green’s function; second, we selected the seismograms that were recorded at a sampling frequency higher than 60 Hz, in order to be able to work on small events (magnitude 3–4). This left us with 36 stations that provided either local seismograms with a Pg wave as first arrival or regional seismograms with a Pn wave as first arrival. From these stations, 16 records were clipped because of insufficient dynamic range and 20 were on-scale. We decided to analyse clipped and unclipped seismograms separately in order to
1 Laboratoire de Ge´ophysique du Commisariat a` l’e´nergie atomique. 2 Institut de Protection et de Surete´ Nucle´aire.
3 Dense short-period network operated by the Observatory of Grenoble. 4 Re´seau National de surveillance sismique.
Figure 1. Focal mechanism of the 1996 July 15 Epagny–Annecy event 5 Broad-band network operated by the UMR Ge´osciences Azur.
6 Broad-band network operated by Observatory of Grenoble. from Thouvenot et al. (1998) and stations that were used in this study. Black diamonds represent those stations at which the records of the 7 Re´seau Acce´le´rome´trique permanent Franc¸ais.
8 Dipartimento di Scienze della Terra, Genova. main shock are clipped, whereas grey triangles correspond to those stations from which unclipped records are available.
9 Swiss Seismological Service. © 1999 RAS, GJI 139, 152–160
small that the duration of its source-time function (STF) is short enough to be negligible compared with that of the main shock while still being strong enough to provide records with good signal-to-noise ratios at a large number of stations. In our case, we chose as EGFs two aftershocks with magnitudes M
L(estimated by Renass) equal to 3.7 and 3.4. The first one occurred about 5 hr after the main shock and was located almost at the same point (Thouvenot et al. 1998). The second one, which occurred 5 days later (1996 July 20 22 : 04), was located 1.5 km to the northwest, at a slightly shallower depth than the main shock. Both events have a strike-slip focal mechanism very similar to the one of the main shock (difference in strike<14°, difference in dip <10°; F. Thouvenot, personal communication).
The deconvolution of the main shock by the EGF results in an apparent relative source-time function (ARSTF). This ARSTF represents the temporal history of the moment release at the source as seen from a given station. It is ‘apparent’ because the shape of the source-time function depends on the direction from which the rupture propagation is viewed, and it is ‘relative’ because it is scaled by the moment of the EGF and its duration is reduced by the source duration of the EGF. We performed the deconvolution in the time domain using a non-linear deconvolution method with positivity constraint (Courboulex et al. 1996) on the two EGFs separately. The use of more than a single event as EGF is very important in such an analysis to confirm the reliability of the results.
Waveform comparison and EGF deconvolution
Before performing the EGF deconvolutions, we systematically compared the waveforms of the main shock and the aftershocks
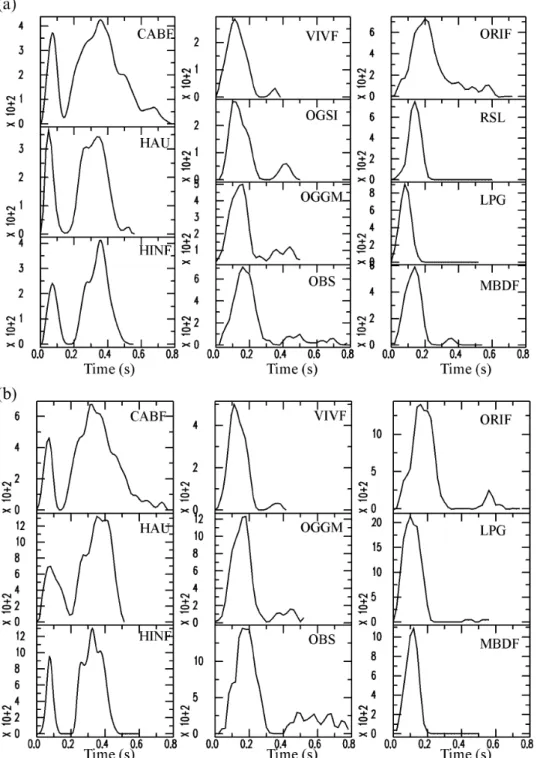
Figure 2. Examples of displacement and velocity waveforms of the
at each station that provided unclipped records. It is important
main shock compared with those of the aftershock of 1996 July 15
to note that we used only P waves, because the S waves were
05 : 46, and results of the EGF deconvolution at stations located north
very complex and could not be identified clearly. This may be
(CABF) and southeast (RSL) of the epicentre. The displacement traces
a result of the shallow depth of the hypocentres, which leads at RSL were corrected for the response of the 1 Hz seismometer before to the generation of strong surface waves that reach the station integration.
at almost the same time as the S waves.
At many stations, the main shock and the aftershock
wave-forms are similar, and the P-wave arrivals have a simple It is clear that such behaviour is not compatible with a symmetric or bilateral rupture expansion. Based on the fact shape (e.g. station RSL in Fig. 2). At other stations, both the
displacement and the velocity traces of the main shock feature that the fault plane strikes in the direction of the Vuache Fault (Thouvenot et al. 1998), and that all the double-pulse long-a double-pulse P-wlong-ave onset, which is not seen in the
seismo-grams of the aftershocks (e.g. station CABF in Fig. 2). duration STFs are observed at stations north of the epicentre, we expect that the rupture consisted of at least two subevents Moreover, in all cases showing signs of a double-pulse P-wave
onset, cross-correlations of the main shock velocity signals and propagated preferentially towards the southeast. with those of the aftershocks result in a maximum of the
correlation coefficient when the aftershock is shifted by almost
Pulse-width measurements 0.3 s relative to the observed first breaks (dt in Fig. 2). Shifted
in this way, the P-wave onset of the aftershock is aligned with As first demonstrated by O’Neill & Healy (1973), an alter-native method of obtaining information about the duration of the second pulse of the main shock. This is because the second
pulse is in general larger and longer than the first one and the STF consists of measuring the width of the first half-cycle of the P-wave onset as recorded by a standard seismometer sensitive thus dominates the later stages of the seismograms.
The results of the EGF deconvolutions confirm that the to ground velocity. This method is simple and has the advantage of being applicable also to severely clipped seismograms. The double pulse is a feature of the STF of the main shock, but
that it is not seen at all azimuths (see Fig. 2). Indeed, the observed pulse width is a function of the rise time of the STF, modified by broadening due to the response of the recording double-pulse ARSTFs with a relatively long overall duration
are observed only at stations situated north of the epicentre, instrument as well as to attenuation and scattering along the path. In a first approximation, the path and instrument contri-while at all other stations the ARSTFs are simpler and shorter
(Fig. 3). The durations of the apparent source-time function butions to the pulse widths at each station can be corrected by subtracting the pulse width of a smaller event (Frankel & measured directly on the displacement pulse, and on the result
of EGF deconvolution are reported in Table 1. Kanamori 1983). Provided that possible directivity effects of the
T he 1996 M5 Epagny–Annecy earthquake 155
Figure 3. Deconvolution results with: (a) the ML=3.7 and (b) the ML=3.4 aftershock as EGF.
smaller event’s rupture process are negligible, this technique will main shock appears as a double pulse and that at the northern stations we have therefore measured only the relative duration in general give a reliable measure of azimuthal variations in the
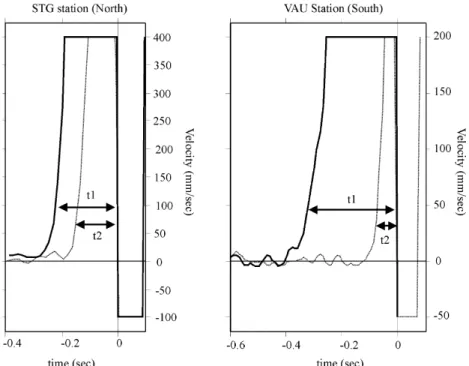
apparent duration of the main shock STF. of the first pulse. This shows that, in the presence of undetected rupture complexities, a naive application of the pulse-width As illustrated by the example shown in Fig. 4, the relative
pulse widths measured from clipped seismograms at all sta- method can produce severely misleading results. tions situated north of the epicentre are consistently smaller than
those observed at stations south of the epicentre. From
pulse-I N T E R P R E TAT pulse-I O N width measurements on clipped records alone we would thus
conclude that, contrary to the results of the EGF deconvolutions,
Unilateral rupture model the rupture propagated towards the northwest. Obviously, the
reason for this discrepancy is that on the clipped records we To visualize the distribution of the double- and single-pulse source-time functions relative to the focal mechanism, we cannot recognize the fact that towards the north the STF of the
© 1999 RAS, GJI 139, 152–160
Figure 4. Examples of two pulse-width measurements on clipped seismograms.
Table 1. P-pulse duration and apparent relative STF duration for each station that recorded the main shock without saturation. ‘u’ indicates that the value was undefined.
station network epicentral azimuth P pulse ARSTF
name distance (°) duration duration
( km) (s) (s) OGSI RAP 48 78 0.3 0.25 OGGM Rosalp 82 174 0.27 0.3 CABF LDG 75 2 0.55 0.6 HINF LDG 219 18 0.5 0.5 BSF LDG 217 15 0.45 u HAU LDG 230 5 0.45 0.5 LOR LDG 226 310 0.6 u VIVF LDG 160 221 u 0.25 TCF LDG 302 276 0.6 u ORIF LDG 114 185 u 0.3 LPL LDG 69 133 0.2 0.2 LPG LDG 71 134 0.2 0.2 MBDF LDG 143 161 u 0.15–0.2
Figure 5. The observed P displacement pulses and apparent
source-CALF TGRS 350 124 0.2 u
time functions in an equal-area stereographic projection onto the focal
OBS IPSN 226 187 0.3 0.3
sphere viewed along the normal to the fault plane. hiis the angle
RSL Sismalp 50 124 0.2 0.2
between the ray and the fault normal.yi, measured in the plane of
LOMF Renass 167 20 0.45 0.45
the fault, is the angle between the ray and the strike of the fault.
an epicentral distance of about 20 km leave the source as down-projected each observation onto the fault plane (Fig. 5). The
azimuth and take-off angles of the rays to each station were going rays. Therefore, all our data points come to lie in the lower half of the fault plane. Fig. 5 shows that the projections converted to the angles between the rays and the normal to
the fault,h
i, at the ith station, and between the rays and the of the double- and single-pulse source-time functions onto the fault plane separate into two distinct groups. For a unilaterally strike of the fault,y
i, for a fault with strike, dip and rake of
316°, 70° and −10° derived by Thouvenot et al. (1998). The propagating rupture on a circular fault, the duration of the apparent moment-rate function at the ith station,t
i, is given by take-off angles were calculated for a focal depth of 2 km based
on the velocity model used by Thouvenot et al. (1998). Since t
i=L [1/Vr−1/c sinhicos(yr−yi)] , (1) the source is located in the sedimentary layers close to the
boundary to the crystalline basement and because of the strong with L the source diameter, V
rthe rupture velocity, c the phase velocity,h
ithe angle between the ray and the normal to the velocity increase across this boundary, all first arrivals beyond
T he 1996 M5 Epagny–Annecy earthquake 157 fault,y
ithe angle between the ray and the strike of the fault, andyr the direction of rupture propagation (Boatwright 1980). Both y
i and yr are measured in the plane of the fault. For given values oft
i,hiandyiand fixed values of c and Vr, we can solve eq. (1) for L as a function of yr. In practice, this gives a different value of L for each observation t
i.
Increasingyiin steps of 5° over the range between 0° and 360°, we calculate an average value of L over all stations for each value ofyr, and search for that yr which minimizes the sum of the squared differences between the observed and calcu-latedti. With reference to Fig. 5 and to the given orientation of the fault plane, yr=0° or 180° corresponds to a purely horizontal rupture propagation towards the NW (0°) or SE (180°), whereas y
r=90° or 270° corresponds to a purely downward (90°) or upward (270°) rupture direction. Assuming a P-wave velocity of 5.35 km s−1 (Thouvenot et al. 1998) and an average rupture velocity of 2.7 km s−1, we obtain y
r=180° and L=915 m. The fit between observed and calculated t
iis better for the single-pulse STFs at the stations withyi>120°, situated in the southeast quadrant relative to the epicentre, than for the double-pulse STFs observed at the stations to the north (Fig. 6). To judge whether the assumption of a unilateral rupture propagation is justified and assess to what extent the rupture direction can be constrained by the available data, we
have calculated the mean of the misfit (the squared differences Figure 7. The rms of the differences between the observed and
between the observed and calculatedt
i) for every 5° increment calculatedtias a function ofyifor various rupture velocities Vrand for tiincreased by 0.1 s (see text for further explanations).
inyr. From the resulting plot in Fig. 7, we see that this misfit function has a broad minimum over the range 130°<y
r<250°. Thus, due to the fact that all our observations correspond
Subevent location to downgoing rays, which span a range of y
i of only 120°, Based on the values of the ARSTF reported in Table 1, it is the vertical component of the rupture direction is poorly
possible to estimate the maximum area that was activated constrained.
during the main shock rupture by constructing the isochrons It can be argued that, because of the contribution of the
over the fault (Bernard & Madariaga 1984; Spudich & Frazer small event’s STF to the EGF, the deconvolution procedure
1984; Zollo & Bernard 1991). Starting from the nucleation underestimates the true duration of the STF of the main shock.
point (S0 in Fig. 8), the rupture propagates circularly with a Considering the magnitude of the EGF events that we used,
constant rupture velocity, and slip is assumed to have a step-this deficit could amount to about 0.1 s. As shown by the
like shape in time. An isochron is defined as the locus of all corresponding misfit function in Fig. 7, adding 0.1 s to all our
points on the fault from which seismic radiation reaches a estimates oftidoes not change the resulting rupture direction
given station at a given time t, significantly. Similarly, using a different average rupture velocity
raises the overall misfit by only a small amount and does not t=T
R(r0, r1)+TC(r0, x) , (2) affect the location and breadth of its minimum in a significant
where r0 and r1 are the nucleation point and the isochron way (Fig. 7).
point, and x denotes the receiver position. T
R represents the rupture time, while T
C is the wave propagation time (the P-wave velocity is set to 5.35 km s−1 in the medium around the source). We drew the isochrons that delimit the final extension of the rupture for each station. The intersection of the areas delimited by isochrons defines the region of the fault plane that must contain the rupture. This area depends on the rupture velocity. In order to estimate the maximum area of the fault we chose a velocity of 3 km s−1, which can be considered as an upper bound in the sedimentary layer that contains the source.
Fig. 8 shows the isochrons that correspond to six stations distributed over a representative set of azimuths. The inter-section of the areas delimited by isochrons gives an estimate of the dimensions of the active fault plane. The grey zone in Fig. 8 represents the rectangular fault that corresponds most closely to the intersection of the areas delimited by the isochrons. Since the rupture velocity that we used is high
Figure 6. Observed (vertical bars equal to uncertainties) and calculated (squares) values oft
ias a function ofyi. (3 km s−1), this area, estimated at 2.5 km2, gives an upper © 1999 RAS, GJI 139, 152–160
Figure 8. (a) Isochrons corresponding to the total duration of the apparent relative source-time functions represented on the fault plane (the origin of the depth scale along the fault corresponds to the surface). ( b) Isochrons corresponding to the peak of the first subevent. (c) Isochrons corresponding to the peak of the second subevent.
bound to the rupture dimension. With the seismic moment model, but could also vary over the duration of faulting (e.g. Deichmann 1997). However, the general picture would remain equal to 1.9×10¹⁶ N m (computed from records of a Swiss
accelerometer, located 30 km from the epicentre), we obtained the same, with a first subevent close to the hypocentre towards the northwest and a second subevent further away towards the an average displacement of 30 cm and a stress drop of 5.5 MPa.
Having obtained an estimate of the total rupture area, we southeast. The fact that the first subevent is located towards the northwest agrees with the interpretation of pulse-width can now locate the two subevents on the fault plane. For this
purpose, on the ARSTFs of Fig. 3 we measure the time between measurements performed on the clipped data, which are based on the first pulse alone.
the beginning of the rupture and the peak of each subevent. The first subevent, S1, can be seen at every station, whereas S2 is separated clearly from S1 only at the three stations
R E L AT I O N T O T H E A F T E R S H O C K S CABF, HAU and HINF to the north and less clearly at station
OGSI to the east. At the stations south and southeast of The aftershock locations determined by Thouvenot et al. (1998), based on data from a temporary seismic network the epicentre, such as MBDF and RSL, the overall rupture
directivity has caused the signals of the two subevents to merge installed in the epicentral area two days after the main shock, delineate two fault segments separated by a right-lateral step-into a single pulse. For these two stations we have taken the
time from onset to the peak of the ARSTF (the rise time) as over of about 500 m. The larger segment, with the higher seismic activity in terms of both the number and the size of representative of both subevents. The isochrons corresponding
to the delays of S1 and S2 determined in this manner are the events, is to the north and somewhat displaced from the surface trace of the Vuache Fault, while the other is more to shown in the lower part of Fig. 8. The only region where the
isochrons of S1 intersect is located about 250 m northwest of the south and closer to the fault trace. Although Thouvenot et al. (1998) made an effort to constrain the main shock the nucleation point, whereas the second subevent, S2, is
located about 900 m to the southeast. location with the results of the aftershock measurements and place its epicentre at the southeastern end of the northern fault It is important to remember that the absolute locations of
the subevents depend strongly on the rupture velocity, which segment, the remaining location uncertainty can not exclude it from having occurred on the southern segment instead. could not only be different from the one chosen for our
T he 1996 M5 Epagny–Annecy earthquake 159 Given this uncertainty, Fig. 9 illustrates two end-member distribution documented by Thouvenot et al. (1998), we con-sider three scenarios: (1) the rupture area of the main shock is scenarios of possible locations of the main shock rupture area
relative to the aftershocks: in the first case, the rupture of the entirely part of the northern fault segment; (2) it is entirely part of the southern segment; or (3) the rupture nucleated on the main shock nucleated close to the southeastern end of the
northern segment and propagated mainly away from the more northern segment, producing the first subevent, and then jumped to the southern segment, where it continued to propagate active part of the aftershock zone, while in the second case it
nucleated and propagated along the southern segment. As towards the southeast. Because of our lack of unclipped near-source seismograms for the main shock and the limited noted above, the size of the main shock rupture area in Fig. 9
must be regarded as an upper bound. coverage of the focal sphere of the available data, our results on their own do not allow us to distinguish between these three possibilities. Nevertheless, we can examine the implications D I S C U S S I O N A N D C O N C L U S I O N S
of these different scenarios in the light of other observations and arguments.
The aim of this study was to retrieve the main characteristics
of the rupture process of the Epagny–Annecy earthquake using In the first case, the main shock did not occur on the Vuache Fault but on a fault segment parallel to it. For some not all the available data.
The analysis of the raw P-wave displacement seismograms immediately apparent reason, the rupture stopped propagating towards the northwest, and then the main rupture phase and the EGF deconvolutions show that the rupture process
consisted of at least two subevents. Moreover, the azimuthal propagated away from the area featuring the highest aftershock activity into a region with very few aftershocks. Fletcher & dependence of the durations of the apparent source-time
functions obtained from the EGF deconvolution as well as Spudich (1998) observed an apparent lack of correlation between rupture directivity and concentration of aftershock the fact that the double pulse is visible only on stations north
of the epicentre provide evidence for a strong unilateral com- activity in their analysis of three moderate earthquakes on the San Andreas Fault. Therefore, this somewhat counterintuitive ponent of the rupture propagation towards the southeast
along the strike of the fault and roughly parallel to the direction behaviour is not a sufficient reason to exclude this scenario. In the second case, the main shock actually nucleated on the of slip. The isochron analysis indicates that a small amount of
rupture propagation towards the northwest occurred during Vuache Fault but was prevented from propagating further to the northwest by the apparent stepover in the fault and was the early stages of the rupture process, corresponding to the
first subevent, and that the second subevent corresponds to thus forced to propagate mainly towards the southeast, as documented by the second subevent. In this scenario, the first the main part of the rupture, which propagated towards the
southeast. subevent would correspond to a stopping phase originating from the northwestern edge of the rupture area, in agreement In an attempt to interpret these results in terms of the fault
geometry derived from the trend of the Vuache Fault, from with the fact that it is observed as a separate phase only in a sector north of the epicentre. The third scenario, which invokes the focal mechanism of the main shock and from the aftershock
Figure 9. Aftershock locations and focal mechanism from Thouvenot et al. (1998). The largest aftershocks are labelled and the circle shows the estimated uncertainty of the main shock’s epicentral location. A projection of the fault plane obtained from the isochron analysis is represented by a grey rectangle on which are shown the estimated locations of the first and second subevents as well as the rupture directivity. The two diagrams show the location of the main shock rupture assuming it is part of either the northern (left) or southern fault segment (right).
© 1999 RAS, GJI 139, 152–160
Beroza, G.C. & Ellsworth, W.L., 1996. Properties of the seismic
a rupture process occurring on two separate fault segments, is
nucleation phase, T ectonophysics, 261, 209–227.
appealing, because it gives an intuitively plausible explanation
Boatwright, J., 1980. Spectral theory for circular seismic sources: simple
for the observation of two subevents. A similar behaviour,
estimates of source dimension, dynamic stress drop and radiated
with a rupture front that jumps across a stepover from one
energy, Bull. seism. Soc. Am., 70, 1–28.
fault segment to the next, was observed in the 1992 Landers
Courboulex, F., Virieux, J., Deschamps, A., Gibert, D. & Zollo, A.,
earthquake (Wald & Heaton 1994). However, as in the first 1996. Source investigation of a small event using empirical Green’s scenario, we have to ask why the rupture did not continue functions and simulated annealing, Geophys. J. Int., 125, 768–780. further to the northwest, along a segment which, judging from Courboulex, F., Deschamps, A., Cattaneo, M., Costi, F., Deverche`re, J., the enhanced aftershock activity, was obviously ready to slip. Virieux, J., Augliera, P., Lanza, V. & Spallarossa, D., 1998. Source study and tectonic implications of the April 21, 1995 Ventimiglia
In addition to the arguments mentioned above, we favour
( border of Italy and France) earthquake (M
L=4.7), T ectonophysics,
the second scenario, in which the entire main shock rupture
290, 245–257.
occurred on the southern fault segment and thus on the Vuache
Deichmann, N., 1997. Far field pulse shapes from circular sources with
Fault, for the following reasons. The estimated total rupture
variable rupture velocities, Bull. seism. Soc. Am., 87, 1288–1296.
area is compatible with the aftershock distribution on the
Fletcher, J. & Spudich, P., 1998. Rupture characteristics of the three
southern segment. The fact that the number and magnitudes
M 4.7 (1992–94) Parkfield earthquakes, J. geophys. Res., 103,
of the southern aftershocks are considerably smaller than 835–854.
those of the northern ones is evidence that most of the stress Frankel, A. & Kanamori, H., 1983. Determination of rupture duration had already been released by the main shock. Conversely, and stress drop for earthquakes in southern California, Bull. seism. the stepover in the fault, which prevented the rupture from Soc. Am., 73, 1527–1551.
Haddon, R. & Adams, J., 1997. Anatomy of a small intraplate
propagating further to the northwest, then led to a stress
earthquake: a dissection of its rupture characteristics using regional
increase on the northern segment. This stress increase was
data, Geophys. J. Int., 129, 235–251.
then released over the subsequent days and weeks with a large
Hartzell, S., 1978. Earthquakes aftershocks as Green’s functions,
number of aftershocks, including several events of magnitude
Geophys. Res. L ett., 5, 1–4.
3 and 4. Moreover, important evidence in favour of the
Hough, S.E., 1996. Observational constraints on earthquake source
main shock having occurred on the southern segment is the
scaling: Understanding the limits in resolution, T ectonophysics,
observation of cracks in the ground and in the runway of the
261, 83–95.
Meythet–Annecy airport exactly where the extrapolated fault Lambert, J. & Levret-Albaret, A., 1996. Mille Ans de Se´ismes en plane of the southern fault segment intersects the ground France, Catalogue d’e´picentres, Parame`tres et Re´fe´rences, Ouest surface (Thouvenot et al. 1998). These cracks certainly did not Editions, Nantes.
Mori, J., 1996. Rupture directivity and slip distribution of the M 4.3
occur as a consequence of the aftershocks alone.
foreshock to the 1992 Joshua Tree earthquake, Southern California,
Whatever interpretation one favours, our analysis of the
Bull. seism. Soc. Am., 86, 805–810.
rupture process of the Epagny–Annecy earthquake clearly
Mueller, C., 1985. Source pulse enhancement by deconvolution of an
shows that even moderate events of magnitude 5 can have
empirical Green’s function, Geophys. Res. L ett., 12, 33–36.
complex rupture histories. It is also clear that, in addition to
Nicolas, M., Santoire, J.P. & Delpech, P.Y., 1990. Intraplate seismicity
the known local site effects, the strong directivity effects due
new seismotectonic data in western Europe, T ectonophysics, 179,
to an asymmetric rupture propagation can have significant 27–53.
consequences for the damage potential of such earthquakes. O’Neill, M.E. & Healy, J.H., 1973. Determination of source parameters
from P-wave rise time, Bull. seism. Soc. Am., 63, 599–614. Spudich, P. & Frazer, L.N., 1984. Use of ray theory to calculate
A C K N O WL E D G M E N T S high frequency radiation from earthquake sources having spatially variable rupture velocity and stress drop, Bull. seism. Soc. Am., 74,
We thank the various groups that helped us retrieve the data
2061–2082.
necessary for this work and especially Marc Nicolas from Thouvenot, F., Fre´chet, J., Tapponnier, P., Thomas, J.C., Le Brun, B., LDG. We are grateful to Franc¸ois Thouvenot for providing Me´nard, G., Lacassin, R., Jenatton, L., Grasso, J.R., Coutant, O., us with the aftershock locations and focal mechanisms as well Paul, A. & Hatzfeld, D., 1998. The M
L5.3 Epagny (French Alps)
as for several helpful discussions. This work has been funded earthquake of 15 July 1996: a long-awaited event on the Vuache fault, Geophys. J. Int, 135, 876–892.
by the European project ENV4-CT96–0296 and the IPSN.
Vogt, J., ed., 1979. Les tremblements de Terre en France, Me´m. Bur.
(Publication no. 237 of UMR Ge´osciences AZUR and no. 1073
Rech. ge´ol. min., no. 96.
of the Institute of Geophysics, ETH-Zu¨rich.)
Wald, D.J. & Heaton, T.H., 1994. Spatial and temporal distribution of slip for the 1992 Landers, California, earthquake, Bull. seism. Soc. Am., 84, 668–691.
RE F E R E N C E S
Zollo, A. & Bernard, P., 1991. How does an asperity break? New elements from the waveform inversion of accelerograms for the Bernard, P. & Madariaga, R., 1984. A new asymptotic method for
the modelling of near-field accelerograms, Bull. seism. Soc. Am., 2319 UT, October 15, 1979, Imperial Valley aftershock, J. geophys. Res., 96, 549–573.
74, 539–557.