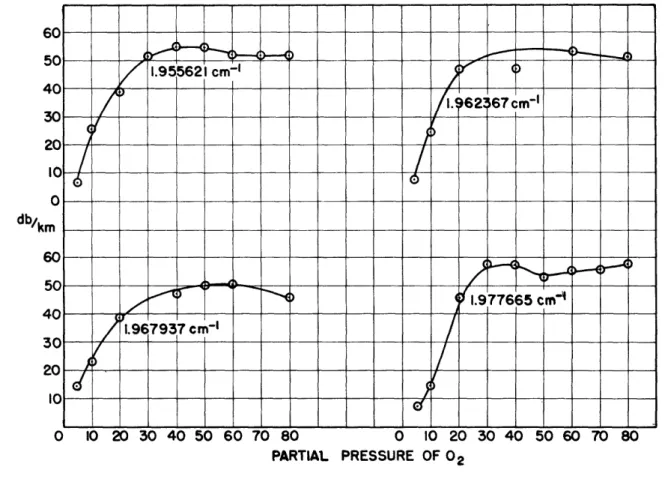
The absorption spectrum of oxygen
Texte intégral
Figure

Documents relatifs
Using additional data and an improved data analysis procedure, we have confirmed our recent observation of EXAFS in these molecules.. Results
32.. The behavior of large, flexible orbital structures under the influence of gravity gradient forces has been treated in Ref. For a nonspinning flat membrane at
Hermine Huot, Marie Buyse, Laurine Campanella, Ying-Yan Chen, Mei-Na Guo, Ya-Ying Li, Chang Liu, Wen-Shen Liu, Ye Liu, Claire Mariatte, et al. To cite
At 900°C, the protective behaviour of HR-120 alloy in presence of sodium chloride under syngas atmosphere can then be attributed to the association of two factors: fast evaporation
The disappearance of anomalous Δ 33 S signals from the sedi- mentary record is a crucial constraint on the rise of oxygen around the Archaean-Proterozoic boundary, but despite
Figure 2 compares the calculated electron densities with experimental values determined from toroidal cavity resonance and values calculated from current continuity equations..
The subdivision of the Schumann-Runge spectral range adopted in the preceding sections is based on the physical structure (individual bands) of the ab- sorption
In fact the values of the band integrated absorption cross sections and of the rotational line widths which have been adopted determine the cross section values
![[PDF] Cours informatique Initiation Android | Formation informatique](data:image/gif;base64,R0lGODlhAQABAIAAAP///wAAACH5BAEAAAAALAAAAAABAAEAAAICRAEAOw==)