HAL Id: ird-01529807
https://hal.ird.fr/ird-01529807
Submitted on 31 May 2017
HAL is a multi-disciplinary open access archive for the deposit and dissemination of sci-entific research documents, whether they are pub-lished or not. The documents may come from teaching and research institutions in France or abroad, or from public or private research centers.
L’archive ouverte pluridisciplinaire HAL, est destinée au dépôt et à la diffusion de documents scientifiques de niveau recherche, publiés ou non, émanant des établissements d’enseignement et de recherche français ou étrangers, des laboratoires publics ou privés.
An overview of detailed CPUES and of fisheries
indicators of the EU purse seiners in the Atlantic
Alain Fonteneau, Daniel Gaertner, Pedro Pascual Alayon
To cite this version:
Alain Fonteneau, Daniel Gaertner, Pedro Pascual Alayon. An overview of detailed CPUES and of fisheries indicators of the EU purse seiners in the Atlantic . Collective Volume of Scientific Papers, ICCAT, 2017, 73 (2), pp.850 - 867. �ird-01529807�
SCRS/2016/183 Collect. Vol. Sci. Pap. ICCAT, 73(2): 850-867 (2017)
AN OVERVIEW OF DETAILED CPUES AND OF FISHERY INDICATORS
OF THE EU PURSE SEINERS IN THE ATLANTIC
Alain Fonteneau1, Daniel Gaertner2 and Pedro José Pascual Alayón3
SUMMARY
This paper has calculated several fishery indicators related to the fishing effort and various CPUEs of EU purse seiners in the Atlantic Ocean during the 1991-2015 period. This work has been done because these basic fishery indicators remain very useful to better understand many past and present changes in fisheries and tuna stocks. GLM CPUEs are very complex to calculate for PS and they have thus been seldom calculated for PS, and their results often remain widely questionable. Our paper presents series of normalized CPUEs calculated averaging, monthly CPUEs in 7 selected core areas, by flag and by size categories of PS catches. They are targeting juvenile and adult YFT, for SKJ and for juvenile BET. This work also analyzes why the EEZ areas and the existence or lack of fishing agreement should preferably be incorporated in CPUE calculations.
RÉSUMÉ
Le présent document a calculé plusieurs indicateurs des pêcheries en rapport avec l'effort de pêche et diverses CPUE des senneurs communautaires opérant dans l'océan Atlantique pendant la période 1991-2015. Ce travail a été réalisé parce que ces indicateurs fondamentaux des pêcheries demeurent très utiles pour mieux comprendre de nombreux changements passés et présents dans les pêcheries et les stocks de thonidés. Il est très complexe de calculer les CPUE des GLM pour les senneurs et c'est pourquoi elles ont été très rarement calculées et leurs résultats restent souvent sujets à caution. Notre document présente des séries de CPUE normalisées calculées en faisant la moyenne des CPUE mensuelles dans sept zones centrales, par pavillon et catégories de taille des prises à la senne. Ils ciblent les juvéniles et les adultes d'albacore et les juvéniles de listao et de thon obèse. Ce travail analyse également les raisons pour lesquelles les zones ZEE et l'existence ou l'absence d'accord de pêche devrait être de préférence incorporée dans les calculs de la CPUE.
RESUMEN
Este documento ha calculado diversos indicadores pesqueros relacionados con el esfuerzo pesquero y varias CPUE de los cerqueros de la UE en el océano Atlántico durante el periodo de 1991-2015. Este trabajo se ha realizado porque estos indicadores pesqueros básicos siguen siendo muy útiles para entender mejor muchos cambios pasados y presentes en las pesquerías y en los stocks de túnidos. Las CPUE de los GLM son muy complejas de calcular para el cerco y por ello rara vez se han calculado para el cerco y sus resultados a menudo son bastante cuestionables. Nuestro documento presenta series de CPUE normalizadas calculadas promediando las CPUE mensuales en siete zonas principales seleccionadas, por pabellón y por categorías de tallas de las capturas de cerco. Se dirigen al rabil juvenil y adulto, al listado y al patudo juvenil. Este trabajo analiza también por qué las zonas ZEE y la existencia o falta de acuerdos de pesca deberían ser preferiblemente incorporadas en los cálculos de la CPUE.
KEYWORDS
Purse seining, fisheries, fishing effort, catchability, abundance
1 Alain Fonteneau, retired IRD scientist, 9 Bd Porée 35400 Saint Malo, France. Email alain.fonteneau@ird.fr 2 Daniel Gaertner, IRD scientist, UMR MARBEC, CRH, CS30171, 34203 Sète, France. Email daniel.gaertner@ird.fr
3 Pedro José Pascual Alayón: IEO Scientist, C.O. de Canarias, Apartado 1373, 38080 Santa Cruz de Tenerife, Spain. Email: pedro.pascual@ca.ieo.es
Introduction: fishery indicators, nominal and GLM CPUEs?
There is today a universal tendency to estimate tuna stocks biomass based on standardized CPUEs obtained by statistical models (GLM CPUEs). These GLM CPUEs are the backbone of most stock assessment models and there is no alternative but to calculate these GLM CPUEs. However these models have seldom been used to estimate stock biomass based on PS C/E data. Most of these PS GLM CPUEs were often mispecified, based on insufficient data (for instance lacking data on the changes in fishing power or on the changes in their use of FADs) and consequently their results have most often been unrealistic to show trends in biomass of any tropical tuna stock (YFT, SKJ or BET). The complexity and variability in the split between the fishing efforts that have been targeting free school and/or FADs (and the multiple unknown parameters in most FAD fisheries) are also a major source of difficulties when trying to calculate GLM CPUEs for tropical tuna PS fisheries. In such a context of major uncertainties and difficulties in the standardization of PS GLM CPUEs, there is still today a major interest to calculate and to examine detailed fishery indicators concerning the various PS fisheries (that are either missing or not easily followed in the yearly SCRS statistical document by the EU scientists describing all the EU&al statistics), and also to calculate “well built nominal CPUEs” based on detailed log book data, these CPUEs being called “normalized CPUEs”. This paper will target these 2 goals based on the log books and catch at size data from the EU purse seine fishery and also from PS associated to EU PS but fishing under various other flags (this fishery being called later the “EU&al PS fishery”) in the Atlantic during the period 1991-2015. These results should at least be useful to provide a better follow up and a better understanding of the multiple changes developed by each of the category of this EU&al PS fishery and also to facilitate the calculation of future realistic GLM CPUEs that are still deeply needed today in many stock assessments of YFT, SKJ and BET stocks.
2. Data and method
2.1. Basic data used
Basic data used were the log book data of the EU and associated flags purse seiners (PS), corrected for species composition (the EU so called “ECD” file) by the Traitements des Thonidés Tropicaux (TTT) method described by Pianet et al 2000, this file being available for all the purse seiners during the period 1991-2015 and covering nearly 100% of the daily and set by set catches. The TASK2 file containing the catch at size by 5°month (so called “TM5” file) was also used in some analysis in order to estimate CPUEs by age of juvenile YFT.
2.2. Method
The first purpose of this work will be to examine the main changes in the characteristics of the EU&al PS fleet as well as various fishery indicators of the various fleets. This study will calculate yearly CPUEs of 3 categories of fleets (France, Spain and PS fishing under a mixture of associated flags), based on an average of the monthly CPUEs calculated in selected fishing zones shown by Figure 1 (in 12 or in 7 fishing zones). These selected areas were chosen as sub areas of the areas used in the EU data processing of free schools. All standardized CPUEs will be calculated by selected size categories of PS that have been showing some constancy of significant activities during the studied period. The size categories of PS used were the size categories used in the EU statistical system, the PS fleet being stratified in 4 categories of carrying capacity: cat. 5 <600 t., cat. 6: 600-800t, cat. 7: 800-1200t, and cat. 8: over 1200t. Such simple basic method of averaging multiple monthly normalized CPUEs by area, for homogeneous sizes of PS and in homogeneous areas, was often examined in historical times by SCRS. Five series of these average nominal CPUEs have been calculated:
(1) CPUE of adult YFT (+10kg), (2) CPUEs of SKJ,
(3) CPUEs of small YFT (categ. >10Kg),
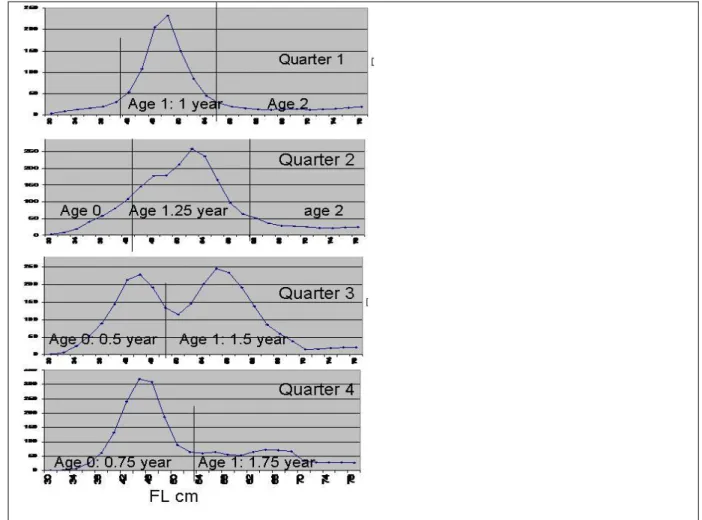
(4) CPUEs of YFT at age 0 and 1 based on the Gascuel and al growth curve (fig. 3); this CPUE by age was based on a slicing of the monthly CAS of the EU&al PS YFT catches based on the apparent progression of average recruited seizes shown by fig. 2. This figure shows a quite stable seasonal recruitment pattern of the YFT small sizes caught by the PS fishery that can be summarized as follows:
Recruitment of age 0 YFT occurs during quarter 3 and 4
Most of the catches in weight from the -10kg category of YFT belonging to age 1 YFT Age 2 YFT are seldom caught: very low catchability of this intermediate age
(5) CPUEs of small BET (categ. >10Kg, + or – class 1 BET). ), but without any attempt to follow CPUE by age All tuna catches by species have been corrected for species composition by the traditional method used in the EU statistics. The 5 areas at the periphery of the core equatorial zone (fig. 1) have been eliminated in most of our normalized CPUEs, because their exploitation tends to be highly seasonal and highly variable between years. On the opposite, the 7 areas used in most of our CPUEs, in the so called “core area”, have been more or less permanently fished by the each of the 3 categories of PS during the 1991-2015 period. It can also be noted that this core area is the area where both the free school and FAD catches have been important during the studied period (Figures 4 and 5), while the 5 areas at the periphery are most often dominated by more recent FAD fishing. It should be noted that while tuna catches have been permanently high in the Senegal and Mauritania area, this Northern major area has been eliminated from our CPUE calculations because of its unexplained heterogeneity during the period and of its major balance between pure fishing on free school until 2010, followed since 2011 by dominant FAD fishing. The unit of effort used in our CPUEs has been the “searching time” in hours/days (i.e. fishing time minus setting time), and also the numbers of successive FAD and of free schools sets. All monthly CPUE have been calculated only when a minimal level of 5 fishing days have been observed (by month, fleet, PS category and area). All the fishing efforts have been used in the normalized CPUE calculations, independently of their potential targeting of FAD and free schools: this choice was made because any large free school or FAD school identified by skippers will always be tentatively fished. In the same way, the fishing mode of catches (FAD or FS) has not been taken into account in these catches and CPUEs: all catches on FADs and in free schools being kept in the calculation of our normalized CPUEs.
This study also examines and discusses the potential effects of EEZ, closed or open to fishing, on the CPUEs. Catches by EEZ have been fully identified for each set, but they were not taken into account in the calculation of our standardized CPUEs by area. All the catch and effort data from the associated fleet of PS are most often of good quality (thanks to the constant efforts by IEO scientists), but most CPUEs have been calculated solely for French and Spanish PS, and rarely for this associated fleet. These CPUEs have not been kept because this fleet appears to be too variable in terms of most of its characteristics, fishing areas and fishing behaviour (for instance their frequent changes of flags, their variable unknown legal status in most EEZ, their frequent changes of fishing zones oscillating between offshore and coastal areas, depending of fishing agreements, but without consistent pattern and the peculiar large sizes of most vessels from this associated fleet.
3. Results
3.1 Indicators of the EU&al PS fishery
3.1.1 Yearly numbers of French, Spanish and associated flags PS by size categories
This parameter, shown by Figures 5, 6 and 7, is quite important, as the size of the vessels widely condition their fishing efficiency and their potential to fish in remote locations with high CPUEs. Each fleet has been showing during the last 25 years wide fluctuations in the number of PS by size category, while category 6 (800-1200 tons) appears to be of special interest because these large PS have been permanently active in both French and Spanish fleets. It can be noticed that the Spanish fleet has been showing an increasing number and percentage of large PS category 7, i.e. vessels showing 800 to 1200 tons of carrying capacity (now dominating this fleet). It can also be noticed that most PS from the associated fleet are also belonging to this category 7. Figure 8 is showing the average carrying capacity of each of the 3 fleets and of the entire fleet: Spain, France and associated PS. It could be noticed that the capacity of French and Spanish PS tend to be quite similar, while the PS from associated flags are showing a larger capacity. As a consequence, the average carrying capacity of the fleet has been showing since 2000 a steadily increasing trend.
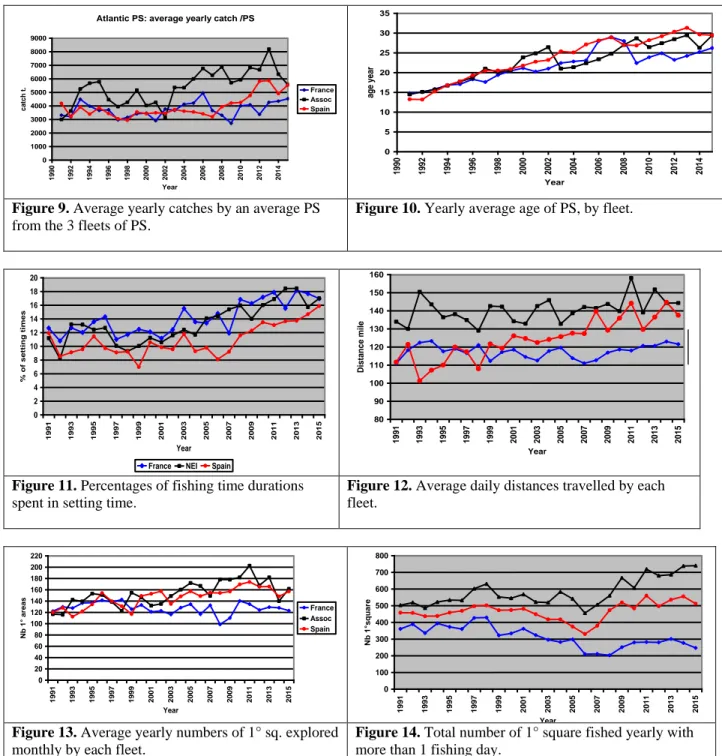
3.1.2 Average yearly catches by an average vessel from the 3 fleets of PS
This indicator shown by Figure 9 is not used in stock assessment analysis, but it is an important one, being for instance the main criterion used by fishermen to compare the efficiency of each PS: the best PS being the vessel showing the maximum yearly catches. This basic indicator tends to be quite consistent over many years and quite interesting to show differences of the relative tuna abundances between years and the changes in fishing efficiency.
3.1.3 Yearly average age of PS, by fleet
Figure 10 shows the average yearly ages of PS belonging to each of our 3 fleets. This figure shows that the 3 fleets have been showing during the period 1991-2015 increasing average ages: an average age close to 15 years in 1991 for each fleet, and today an average age of 30 years for the Spanish and 26 years for the average French vessels (8 vessels from the EU fleet reaching an age over 40 years). The potential effect of this increasing age on the fishing efficiency remains questionable and difficult to evaluate in statistical models: on one side an old but well maintained vessel may well keep or increase its full fishing efficiency, even at old ages (simply permanently improving its equipment), but on the other side, this is not always the case. Furthermore, there is also a general tendency that the best skippers tend to move to modern new vessels, then potentially reducing the fishing efficiency of the older vessels.
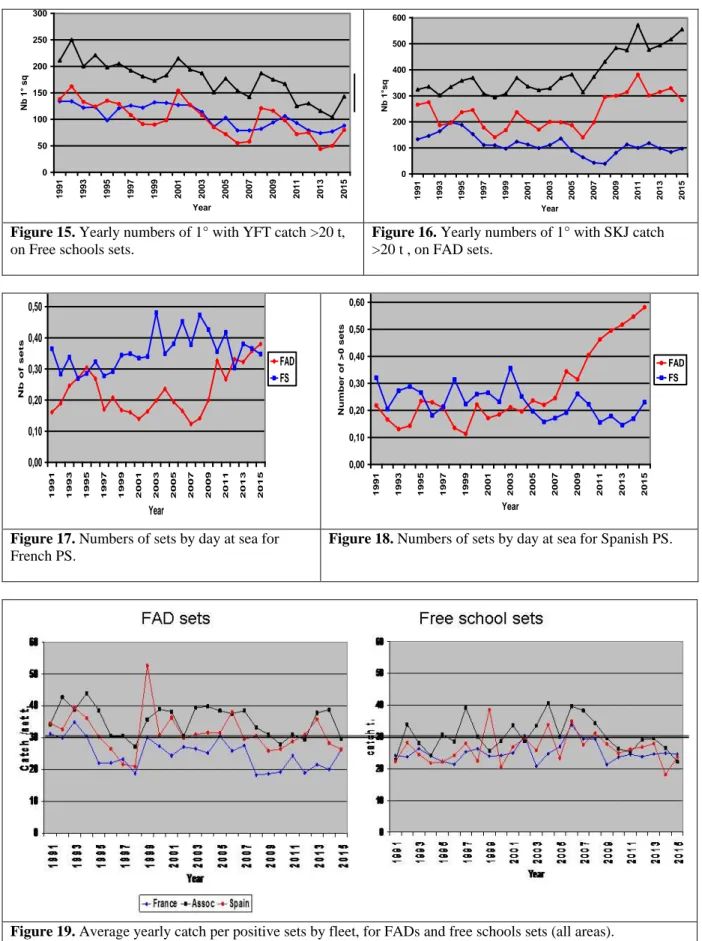
3.1.4 Percentages of fishing time durations spent in setting time
Figure 11 shows that increasing percentages of fishing times have been lost during setting times (purse seine at sea, without any searching activity, or of potential catch of a neighbouring school) have been observed for each of the 3 fleets. It can also be noted, that quite surprisingly a lower percentage of setting times is lost by Spanish PS.
3.1.5 Average daily distances travelled by each fleet
These distance are relative ones, as they are not based on VMS data but on apparent distances estimated from successive positions from log books. These log book distances are always underestimating the real distances travelled by PS, but they are interesting in order to show differences of distances travelled between years and fleets. Figure 12 shows that stable but lower daily distances have been travelled by French PS, while larger distances were travelled by the associated fleet. It also shows that steadily Increasing average daily distances have been travelled by Spanish PS, this change corresponding to a visible change and increase of the Spanish fishing effort and of the fished zones, and probably also to increased movements targeting FADs in association to their more active fishing on FADs and a increasing number of FADs.
3.1.6 Average and total numbers of 1° squares explored monthly and yearly by each fleet
Figure 13 shows that the surface explored monthly by each fleet was nearly identical in the early nineties, but that the average surfaces fished by Spanish and by associated PS have been steadily increasing since 2000 and especially for associated PS. This heterogeneity between the 3 fleets is probably related to their distinct changes in their targeting of FADs (in wider areas) or of free schools (in smaller and more stable areas). Figure 14 shows the changes of the surfaces fished yearly by each fleet: at a yearly scale, the yearly surfaces fished by Spanish PS have always been much larger than for French PS, while the associated flags PS have been showing the larger areas fished yearly. It also shows that the yearly surfaces fished by French PS has shown a marked decline during the last 10 years, while the Spanish and associated fleets were showing a marked increase in their areas fished: yearly surfaces fished by these fleets being 3 times larger than the area fished by the French PS.
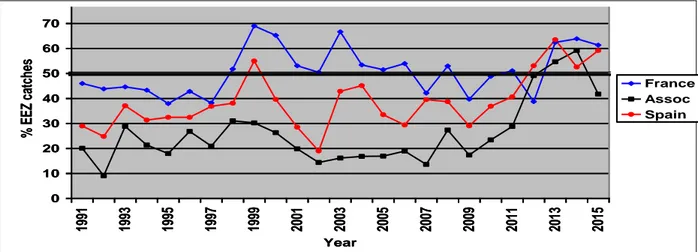
3.1.7 Yearly numbers of 1° squares with YFT catch >20 t on free schools sets
Figure 15 shows a similar trend and level in these numbers of YFT squares: showing both a steady decline in a ratio of 2 between the early and the late years of the studied period. The associated flag PS shows the same trend, but at a higher average level. This steady decline remains rather strange and is a source of potential worry as it may be due to the decline of the adult stock sizes and of its real geographical expansion. This question should be carefully studied and understood.
3.1.8: Yearly numbers of 1° squares with SKJ catch >20 t on FAD sets
Figure 16 shows distinct trends between French PS that have been permanently declining during the period, and Spanish and associated PS that have been steadily showing marked increases in the surface fished with FAD SKJ catches (especially the associated fleet always fishing in much larger areas).
3.1.9 Average numbers of sets by day at sea for French and Spanish PS
Figure 17 and 18 show that both fleets have steadily been showing since the early 2000 increasing numbers of their daily FAD sets. French PS have been showing more free schools sets per day in historical times, but since 2009 similar numbers of FAD and free schools sets per fishing day. They are also showing that in historical times Spanish PS were showing similar numbers of Free schools and FAD sets per day, but showing since 2005 steadily declining numbers of free schools sets per day and also widely increasing numbers of FAD sets per day. It can be hypothesized that this trend is in relation with the marked increase in the number of FADs seeded by this fleet and its supply vessels.
3.1.10 Average yearly catch per positive sets: on FADs and free schools (all areas)
Figure 19a shows that there were no major changes observed in the yearly average catches per FAD set observed for any of the 3 fleets during the 1991-2015 period: a lower average FAD/set catch was observed for French PS during the entire period. There were no major changes in the average catch of the free school sets (Figure 19b), but quite low levels have been lower since 2007 for each of the 3 fleets, average catch per free school sets being lower than for FADs.
3.1.11: Indicator of the yearly fishing effort targeting FADs, by fleet: yearly ratios of number of FAD sets and of number of Free school sets
Figure 20 shows that low ratios of number FADs on the number of free school sets for both French and Spanish PS were observed during the early period 1991-2004 and much higher levels for the associated fleet of PS (reaching an average ratio of 2.8 FAD sets vs 1.0 free school set). It also shows that since 2005 there was a major increase of this ratio observed for Spanish and associated PS, but only a moderate increase for French PS: showing for French PS since 2010 a 50/50 ratio of FAD/free schools sets, while Spanish and associated PS are showing a ratio of about 3 sets on FADs vs only 1 free school set.
3.1.12 EEZ and PS fisheries
Tropical tuna PS fisheries active in the Eastern Atlantic have always been fishing in a mixture of EEZ and in offshore waters. The access to each EEZ is conditioned by fishing agreements or by private fishing licencing. These fishing agreements are playing a major role to increase the total catches and CPUEs of each PS fleet: the cost of these agreements being always significant, there should be no doubt that they are conditioning the PS catches and CPUEs at regional levels. Closure of major EEZ were for instance noticed during recent years (Senegal 2006-2014, Mauritania 2015, Equatorial Guinea since 2010, Gabon 2012, etc.) and these closures have been potentially reducing the tuna catches in these areas. Distinct percentages of catches have been taken by the 3 fleets in EEZ (Figure 21): much higher for France, most often (but not always) low for the associated PS and intermediate for Spanish PS. These percentages have been converging to high percentages of EEZ catches during recent years (since 2011). In such context, there should be no doubt that the detailed agenda of the monthly closure or opening of all the major EEZ to each component of the EU PS fleet should be fully identified and well incorporated in future GLM CPUEs.
3.1.13 Indicator of the Yearly FAD targeting of French and Spanish of individual vessels
This result is shown by Figures 22 and 23: yearly ratios of FAD vs total catches of several Spanish and French vessels. All the individual French and Spanish vessels of the 2 fleets show during recent years quite homogeneous targeting patterns:
- Always targeting FADs for all Spanish PS: nearly every PS are showing today dominant FAD catches - Always showing a mixed targeting of FAD and free schools for French PS: some PS showing dominant
FAD catches while the other are showing dominant free schools catches - But also showing complex and variable historical changes in this ratio
3.1.14 Yearly catches in the 7 core central areas and in the 5 external areas
Figure 24a shows the yearly total catches in the 7 core areas where our standardized CPUEs have been calculated while Figure 24b shows the yearly catches in the 5 areas positioned at the periphery of our core area (that have not been really used in the today calculation of average CPUEs). Figure 22a shows that significant yearly catches have been permanently observed in each of the 7 core areas, but showing an heterogeneous level depending on the area and year: some areas permanently showing high catches, for instance Cape Lopez, while some areas have been showing quite low but consistent catches, for example the South western equatorial area.
3.2 PS normalized CPUEs
3.2.1 Normalized average yearly CPUE (t/day) of large YFT
Large YFT is the typical target of the free school fishery. These CPUEs are shown by Figures 25, 26 and 27 for French, Spanish and associated flags PS by size categories of these PS. French PS most often show (Figure 25) lower CPUEs for category 5 PS, while cat 6 and cat 7 PS show very similar levels: cat7 PS being 15% more efficient during their common years of activity (and since 2011 an even lower CPUEs of cat.6 PS). French PS show a marked peak of CPUEs during the 2006-2009 period. Spanish PS of the 3 categories also show (Figure 26) a marked increase of CPUEs but depending of the PS sizes: Cat 7 PS most often show much higher CPUEs than Cat 6 PS (72 % higher), these cat. 6 PS show higher CPUEs than small PS from cat. 5. All Spanish CPUEs have been declining in recent years since 2011. Spanish and associated flag PS belonging to cat 7 are showing similar levels and trends (Figure 27).
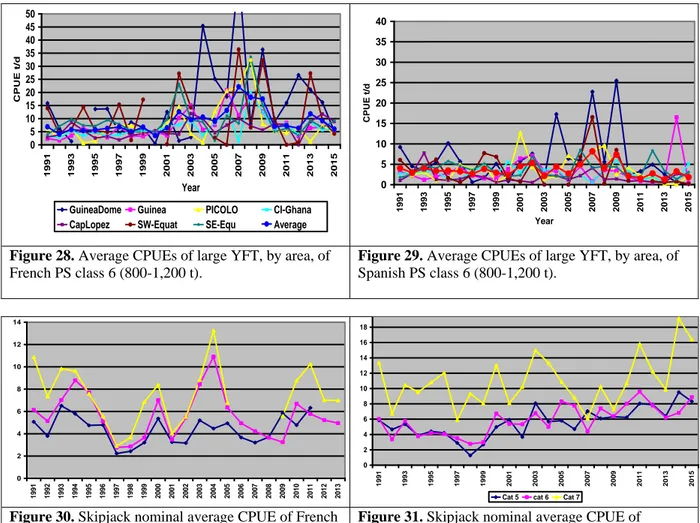
3.2.2 Normalized Average CPUEs of large YFT, by area, of French and Spanish PS class 6 (800-1,200 t)
Figures 28 and 29 also show standardized CPUEs of large YFT for the French and Spanish fleets, but only for the common component of the 2 fleets belonging to class 6 PS (800-1200 t. of carrying capacity). French PS CPUEs are clearly showing very high CPUE levels in 2006-2008, intermediate and quite stable levels since 2009. These French normalized CPUEs of large YFT are always much higher than Spanish CPUEs, probably because of their more active targeting of free schools even in the same core area that is typical of free schools fishing. Furthermore it should be noted (figure 29) that Spanish CPUE are showing a flat trend until 2009, and very low CPUEs since 2010 (probably due to increased FAD fishing?)
3.2.3 Normalized Skipjack average CPUE
Figure 30, 31 and 32 show the same CPUEs but by size categories of purse seiners, for the French, Spanish and associated flags vessels. These CPUEs are calculated as average CPUEs by category in the 7 core areas. These SKJ CPUEs mainly correspond to the FAD fishery, as SKJ are rarely caught in free schools sets in this core area. French PS often show, but not always, lower CPUEs for cat 5 PS, while cat 6 and cat 7 PS show similar levels, but higher CPUEs that cat 5 PS during most years of their common period of activity. Spanish PS of Cat 7 PS are most often showing much higher CPUEs than smaller Spanish PS (94% higher CPUEs), while Cat 5 and cat6 CPUE are very similar in terms of their levels and trend. Spanish and associated flag cat.7 PS show similar high levels and similar trends.
3.2.4 Average CPUEs of SKJ by class 6 French and Spanish PS
Similar SKJ CPUEs were observed for the 2 fleets during the early period 1991-2004 (Figures 33 and 34), but higher Spanish CPUEs have been observed since 2005 (7.3 vs 5.3 t/d for French PS). This increase of Spanish CPUEs was probably the consequence of their more active targeting of FADs: more FADs seeded, more efficient FADs and more supply vessels. It should of course be kept in mind that the Spanish PS SKJ CPUEs would be much higher if the 12 areas were considered (for instance because of the very high SKJ CPUE in the fishing areas off Mauritania and Angola), but the goal of our study was to compare 2 sets of normalized CPUEs calculated for the same category of PS and in the same area.
3.2.5 Average CPUEs of small YFT (<10kg) by French PS of class 6 (800-1,200 t) in the 7 core areas)
These CPUEs of the class 6 PS (800-1200 t) that are commonly active in the French and in the Spanish fleet have been calculated in each of the 7 core areas. These CPUE shown by Figures 35 and 36 mainly correspond to the FAD fishery, as small YFT seldom are caught in free schools. French CPUEs of small YFT show a quite flat trend and a high variance of CPUEs between areas: very high CPUEs have been more or less permanently
observed in the Cape Lopez area for French PS, most French CPUEs showing a quite stable trend and little variability. Average CPUE was observed in 2015 for French PS. A quite stable trend and little variability can be observed for Spanish PS CPUEs, the Cape Lopez area showing moderate CPUEs (compared to French PS). A very high average CPUE was observed in 2015 for Spanish PS.
3.2.6 Age 0 and age 1 YFT CPUEs of French and Spanish category 6 PS, average in the 7 core areas
These CPUEs are shown for age 0 by Figure 37a and for age 1 by Figure 37b. These CPUEs by age have been estimated based on a slicing of the quarterly CAS following the method described by Figure 4a and 4b. These age 0 and age 1 CPUEs are constantly showing large yearly fluctuations, but without marked anomaly (no visible recruitment failure and no major year class are visible in these figures). There is some apparent correlation between Spanish and French PS yearly CPUEs, these CPUE being estimated at high or a low level during the same years for the 2 fleets. However there is very little relationship between CPUEs at age 0 and 1: high CPUEs at age 0 CPUEs do not correspond to high CPUEs at age 1.
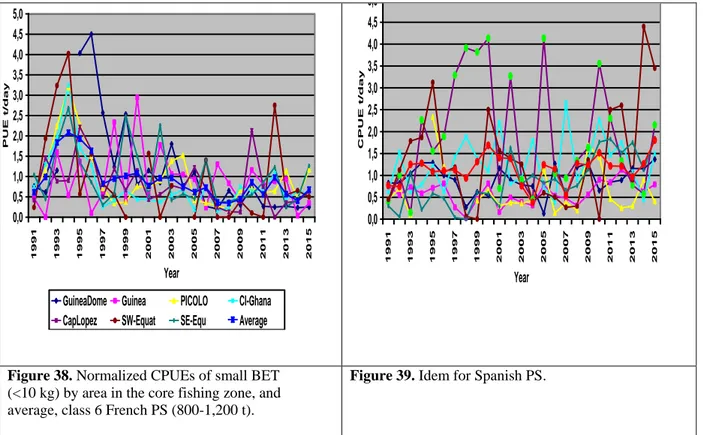
3.2.7 Normalized CPUEs of small BET (<10 kg) by area in the core fishing zone, of the class 6 (800-1200 t) PS
These CPUEs are showing for French PS (Figure 38) a steady decline and its lowest level in recent years. On the opposite, the nominal Spanish CPUEs in the 7 core areas (Figure 39) are showing a stable trend and little variability during the 1991-2015 period and also very high CPUEs during many years in the Guinea dome area. These large differences in the BET CPUEs may be due to various factors, for instance the differential FAD targeting of the 2 fleets, the heterogeneity in their fishing zones and to statistical errors in the catches of small BET (Fonteneau and al 2016).
4. Discussion
These fishery indicators and these normalized CPUEs are clearly interesting ones, as they are simply showing some basic facts and clear changes in the fisheries that are seldom visible to ICCAT scientists, these results being lost in large and complex data bases. However they cannot be representative of changes in stock biomass as multiple serious questions related to the relationship between CPUEs (nominal and GLM) and stock biomass are still pending at the end of this work, for instance:
Technological changes/increases in the PS fishing power are totally neglected: they should have produced some increases in CPUEs of large YFT but also of most other CPUEs. Realistic GLM CPUE should necessarily incorporate the types and dates of these major technological changes (for instance, changes in nets, in bird radars, in sonars, radars, computers, GPS, bird’s nest, etc.).
All our fishing efforts have been used independently of their potential target, FAD or free schools effort, but this question remains open to investigation.
Areas: our 12 areas are probably quite realistic for the calculation of CPUEs, but alternate and smaller areas should also be envisaged and studied by scientists…. For instance keeping in mind that CPUEs of the offshore areas are somehow conditioned by the frequent bias observed in the excessively large CPUEs at the periphery of the offshore fishing zones.
Time strata: what is the better time strata: 15 days periods, month, quarter, other?
Minimal effort in the calculation of CPUEs: 5 days in this study (in each area and by month), but this minimal level is artificial.
EEZ closure and their potential YOYO effect of the CPUEs in coastal areas (for instance in Mauritania-Senegal and Cape Lopez areas): this problem is difficult to handle, even in GLM. At least, there is now (at least for the EU scientists, not necessarily for ICCAT) a quite good knowledge of EEZ closed to PS fishing (at a monthly scale and by flag) that should be incorporated in future GLM CPUEs.
Environmental variability: not handled, difficult to incorporate in statistical analysis, but potentially important (for instance the low CPUEs of large YFT in the 1st quarter of 1984 that was due to an El Niño
effect in the Guinea Gulf, not to a collapse of the adult stock).
Changes in FAD numbers, FAD technology and number of supply vessels are totally neglected while they should produce significant changes/increases in the FAD catches and CPUEs for SKJ and small YFT/BET, and also indirectly producing a decline of the fishing effort targeting free schools.
Species composition of EU FAD catches: there are clear errors and geographical bias in the present BET catches estimated for the EU&al PS, thus probably conditioning all CPUE of small BET (as shown by Fonteneau and al 2016)
CPUEs by age 0 and 1 of YFT and BET: they should be incorporated in future GLM CPUEs, but keeping in mind of the faux poisson bias: PS CAS by time and area are somehow biased by the increasing amount of small YFT and small BET sold in the Abidjan faux poisson market, but these data are not incorporated in the today CAS files by time and areas.
PS Size categories used in this analysis: the 4 categories used by EU scientists have been used, but these categories that have been arbitrarily established 40 years ago should preferably be modified in order to be more representative of the today size structure of the PS fleet and of the observed fishing power of the various sizes of PS.
5. Conclusion
These indicators and normalized CPUEs are mainly an interesting way to better explore the catch and effort relationship by time and area strata, by flag and by size categories of PS. They should for instance help to identify very low/high year classes entering the fishery or major decline or increase in the adult stocks fished. There is no doubt that YFT and BET CPUEs should be calculated by size categories, since small and large fishes are linked with the FAD and free schools fisheries and then show distinct trends. CPUEs of the associated flags PS and CPUEs at the periphery of the core fishing zones should preferably be eliminated from all future CPUE GLM analysis because of the multiples source of heterogeneities. Trends of French PS CPUEs appear to be possibly more representative of the tuna biomass changes than Spanish PS CPUEs: for both recruits (associated to FADs) and adult YFT (in free schools). GLM CPUEs remain the only way to obtain abundance indices integrating all the components that are conditioning the multiple time and space changes and heterogeneity in fishing effort and in CPUEs that have been observed in the EU PS fishery but this task may be an impossible target today, because of the lack of detailed data concerning technological changes and concerning the multiple changes in the FAD fisheries. Short term and well selected CPUEs (for instance solely based on French PS that are less biased by FAD fishing) for instance solely during the last 10 years may be extremely valuable in stock assessment: measuring recent recruitment and adult biomass. However, most CPUEs are driven by 2 factors that are difficult to separate in the fishery data: (1) changes in the local tuna biomass/density or (2) changes in the fishing selectivity and efficiency of the fleets, in general but not always, increasing the fishing efficiency and catchability of PS (for instance due to technological improvements of purse seiners and to the increasing numbers and increasing efficiency of their FADs and to their supply vessels). The effects of EEZ on GLM CPUEs are difficult but important to take into account, and this analysis should be based on a detailed knowledge of closed EEZ at a monthly scale. The interaction between flags and size categories of PS and their apparent changes over time, for both FAD and free schools fishing, and in relation with changes in fished zones, should also be carefully handled in future GLM.
Bibliography
Delgado de Molina A., L. Floch, V. Rojo, A. Damiano, J. Ariz, E. Chassot, F.N’Gom, P. Chavance, A. Tamegnon. Withdrawn. SCRS/2014/080. 2014 Statistics of the European and associated purse seine and baitboats fleets in the Atlantic Ocean. Doc.
Pianet R., P. Pallares and C. Petit. 2000. New sampling and data processing strategy for estimating the composition of catches by species and sizes in the European purse seine tropical tuna fisheries. IOTC Proceedings no. 3 (2000), pp 104-139.
Fonteneau A., P. J. P. Alayón and E. Chassot. In press. SCRS/2016/182. Potential errors in the species composition introduced by the present data processing of EU&al PS catches: towards an improved new data processing based on Small Mobile Strata? 25p.
Figure 1. 12 areas selected for this CPUE analysis and 7 sub areas kept in the calculation of final consistent nominal CPUEs.
Figure 2. Growth curve assumed to age the YFT CAS (Gascuel et al 1992).
YFT growth Gsscuel 1992 Vs Shuford 2007
0 20 40 60 80 100 120 140 160 180 200 220 240 260 0 1 2 3 4 5 6 7 8 9 10 Age (years) FL cm Gascuel
Figure 3. Slicing quarterly limits used to estimate quarterly catch at age based on the quarterly CAS of YFT by PS in the -10kg category of YFT catches (average CAS period 1991-2015), based on Gascuel et al growth curve figure 4a, assuming a quarter 1 dominant spawning.
Figure 3. PS FAD catches 2000-2015 and core FAD areas.
Figure 4. PS free schools catches 2000-2015 and core free schools YFT areas.
Figure 5. Yearly number of French flag PS by size categories.
Figure 6. Yearly number of Spanish flag PS by size categories.
Average capacity PS Atl / fleet
0 200 400 600 800 1000 1200 1400 1600 1800 2000 1991 1993 1995 1997 1999 2001 2003 2005 2007 2009 2011 2013 2015 Year capacity m 3 France Assoc Spain All PS
Figure 7. Yearly number of associated flags PS by size categories.
Figure 8. Average carrying capacity of PS from the 3 fleets: Spain (red), France (blue) and associated (black) and of the whole PS fleet (bold green). Nb PS associated fleet 0 2 4 6 8 10 12 14 1991 1993 1995 1997 1999 2001 2003 2005 2007 2009 2011 2013 2015 Year Nb PS Cat 5 Cat 6 Cat 7 Cat 8
Nb of Spanish PS / categories, Atlantic
0 2 4 6 8 10 12 14 1991 1993 1995 1997 1999 2001 2003 2005 2007 2009 2011 2013 2015 Year Nb PS Cat 5 Cat 6 Cat 7 Cat 8 Nb PS France Atl /categ
0 2 4 6 8 10 12 1991 1993 1995 1997 1999 2001 2003 2005 2007 2009 2011 2013 2015 Year Numb er P S Cat 5 Cat 6 Cat 7 Cat 8 - 25 - 20 - 15 - 10 - 5 0 5 10 15 20 - 15 - 10 - 5 0 5 10 15 20 25 30 35 - 15 - 10 - 5 0 5 10 15 20 25 30 35 - 25 - 20 - 15 - 10 - 5 0 5 10 15 20
average FAD catches 2000-2015 YFT BET 1000
SKJ - 25 - 20 - 15 - 10 - 5 0 5 10 15 20 - 15 - 10 - 5 0 5 10 15 20 25 30 35 - 15 - 10 - 5 0 5 10 15 20 25 30 35 - 25 - 20 - 15 - 10 - 5 0 5 10 15 20
average Free Schools catches 2000-2015 YFT BET 1000
Figure 9. Average yearly catches by an average PS from the 3 fleets of PS.
Figure 10. Yearly average age of PS, by fleet.
Figure 11. Percentages of fishing time durations spent in setting time.
Figure 12. Average daily distances travelled by each fleet.
Figure 13. Average yearly numbers of 1° sq. explored monthly by each fleet.
Figure 14. Total number of 1° square fished yearly with more than 1 fishing day.
Nb of 1° square fished with + 1 fishing day yearly
0 100 200 300 400 500 600 700 800 1991 1993 1995 1997 1999 2001 2003 2005 2007 2009 2011 2013 2015 Year Nb 1° squ are
France Spain All PS
Number of 1° square fished yearly by an average PS of each fleet 0 20 40 60 80 100 120 140 160 180 200 220 1991 1993 1995 1997 1999 2001 2003 2005 2007 2009 2011 2013 2015 Year Nb 1° area s France Assoc Spain
Average daily distance travelled by fleet Atl PS
80 90 100 110 120 130 140 150 160 1991 1993 1995 1997 1999 2001 2003 2005 2007 2009 2011 2013 2015 Year Distan ce mile France Assoc Spain % of fishing time durations spent in setting times
0 2 4 6 8 10 12 14 16 18 20 1991 1993 1995 1997 1999 2001 2003 2005 2007 2009 2011 2013 2015 Year % o f set tin g t imes
France NEI Spain
Average age of EU&al PS Atlantic
0 5 10 15 20 25 30 35 1990 1992 1994 1996 1998 2000 2002 2004 2006 2008 2010 2012 2014 Year age year France Assoc Spain
Atlantic PS: average yearly catch /PS
0 1000 2000 3000 4000 5000 6000 7000 8000 9000 1990 1992 1994 1996 1998 2000 2002 2004 2006 2008 2010 2012 2014 Year catch t . France Assoc Spain
Figure 15. Yearly numbers of 1° with YFT catch >20 t, on Free schools sets.
Figure 16. Yearly numbers of 1° with SKJ catch >20 t , on FAD sets.
Figure 17. Numbers of sets by day at sea for French PS.
Figure 18. Numbers of sets by day at sea for Spanish PS.
Figure 19. Average yearly catch per positive sets by fleet, for FADs and free schools sets (all areas).
Spain PS: number of >O set per fishing day
0,00 0,10 0,20 0,30 0,40 0,50 0,60 0,70 1991 1993 1995 1997 1999 2001 2003 2005 2007 2009 2011 2013 2015 Year Num ber of >0 sets FAD FS
Nb of positive sets/FD, France
0,00 0,10 0,20 0,30 0,40 0,50 0,60 1991 1993 1995 1997 1999 2001 2003 2005 2007 2009 2011 2013 2015 Year Nb o f se ts FAD FS
Nb of 1° with SKJ catch >20 t on FAD sets, by fleet
0 100 200 300 400 500 600 1991 1993 1995 1997 1999 2001 2003 2005 2007 2009 2011 2013 2015 Year Nb 1° sq France Spain All PS Nb of YFT fished with +20t of YFT on free schools
0 50 100 150 200 250 300 1991 1993 1995 1997 1999 2001 2003 2005 2007 2009 2011 2013 2015 Year Nb 1° sq France Spain All PS
Figure 20. Indicator of the yearly fishing effort targeting FADs, by fleet: yearly ratios of number of FADs sets and of number of Free school sets.
Figure 21. Yearly percentage of total yearly catches in EEZ by the EU&al PS for each of the 3 fleets.
Figure 22. Yearly FAD targeting of French individual PS shown by the yearly ratio of FAD vs total catches by each PS.
Figure 23. Yearly FAD targeting of Spanish individual PS shown by the yearly ratio of FAD vs total catches by each PS.
Yearly % of total catches in EEZ by fleet
0 10 20 30 40 50 60 70 80 1991 1993 1995 1997 1999 2001 2003 2005 2007 2009 2011 2013 2015 Year % EEZ catches France Assoc Spain
Yearly % of total catches in EEZ by fleet
0 10 20 30 40 50 60 70 80 1991 1993 1995 1997 1999 2001 2003 2005 2007 2009 2011 2013 2015 Year % EEZ catches France Assoc Spain
Atlantic French individual PS: ratio of FAD /total catches
0,00 0,10 0,20 0,30 0,40 0,50 0,60 0,70 0,80 0,90 1,00 1991 1993 1995 1997 1999 2001 2003 2005 2007 2009 2011 2013 2015 Year FAD cat ches/to tal
Atlantic Spanish individual PS: ratio of FAD /total catches
0,0 0,1 0,2 0,3 0,4 0,5 0,6 0,7 0,8 0,9 1,0 1991 1993 1995 1997 1999 2001 2003 2005 2007 2009 2011 2013 2015 year Ratio FAD/t ot catches
Yearly catches in the 7 core areas 0 10 000 20 000 30 000 40 000 50 000 60 000 70 000 1991 1993 1995 1997 1999 2001 2003 2005 2007 2009 2011 2013 2015 Year Catch t.
Guinea Dome Guinea PICOLO CI-Ghana Cap Lopez SW Equat SE Equat
Yearly catches in the 5 areas at the periphery
0 10 000 20 000 30 000 40 000 50 000 60 000 70 000 1991 1993 1995 1997 1999 2001 2003 2005 2007 2009 2011 2013 2015 Year Catch t.
Senegal-Maurit CaboVerde Angola Gyre West Atl
Figure 24a. Yearly catches in the 7 core central areas that are used in the today calculation of average CPUEs.
Figure 24b. Yearly catches in the 5 areas positioned at the periphery of the core area.
*
Figure 25. Nominal average yearly CPUE (t/day) of large YFT of French PS, by size categories of PS (average of the 7 core YFT areas).
Figure 26. Nominal average yearly CPUE (t/day) of large YFT of Spanish PS, by size categories of PS (average of the 7 core YFT areas).
Nominal CPUE NEI large YFT / PS size Cat
0 1 2 3 4 5 6 7 8 9 1991 1992 1993 1994 1995 1996 1997 1998 1999 2000 2001 2002 2003 2004 2005 2006 2007 2008 2009 2010 2011 2012 2013 2014 2015 Cat 5 Cat 6 Cat 7
Nominal CPUE Spain large YFT / PS size Categ
0 2 4 6 8 10 12 14 1991 1993 1995 1997 1999 2001 2003 2005 2007 2009 2011 2013 2015 Cat 5 Cat 6 Cat 7 Nominal CPUE France large YFT / PS size Cat
0 5 10 15 20 25 1991 1993 1995 1997 1999 2001 2003 2005 2007 2009 2011 2013 2015 Cat 5 Cat 6 Cat 7
Figure 27. Nominal average yearly CPUE (t./day) of large YFT of associated flags PS, by size categories of PS (average of the 7 core central areas).
Figure 28. Average CPUEs of large YFT, by area, of French PS class 6 (800-1,200 t).
Figure 29. Average CPUEs of large YFT, by area, of Spanish PS class 6 (800-1,200 t).
Figure 30. Skipjack nominal average CPUE of French PS by size categories of PS (average of the 7 core areas) (mainly on FADs).
Figure 31. Skipjack nominal average CPUE of Spanish PS by size categories of PS (average of the 7 core areas) (mainly on FADs).
Nominal CPUE NEI large YFT / PS size Cat
0 1 2 3 4 5 6 7 8 9 1991 1992 1993 1994 1995 1996 1997 1998 1999 2000 2001 2002 2003 2004 2005 2006 2007 2008 2009 2010 2011 2012 2013 2014 2015 Cat 5 Cat 6 Cat 7
Big YFT PUE PS France Cat6/area
0 5 10 15 20 25 30 35 40 45 50 1991 1993 1995 1997 1999 2001 2003 2005 2007 2009 2011 2013 2015 Year CPU E t/ d
GuineaDome Guinea PICOLO CI-Ghana
CapLopez SW-Equat SE-Equ Average
Big YFT PUE PS Spain Cat6/area
0 5 10 15 20 25 30 35 40 1991 1993 1995 1997 1999 2001 2003 2005 2007 2009 2011 2013 2015 Year CPUE t/d Série1 Série2 Série3 Série4 Série5 Série6 Série7 Série8
SKJ nominal CPUE France PS /cat size
0 2 4 6 8 10 12 14 1991 1992 1993 1994 1995 1996 1997 1998 1999 2000 2001 2002 2003 2004 2005 2006 2007 2008 2009 2010 2011 2012 2013 Cat 5 Cat 6 Cat 7
SKJ nominal CPUE Spain PS /cat size
0 2 4 6 8 10 12 14 16 18 20 1991 1993 1995 1997 1999 2001 2003 2005 2007 2009 2011 2013 2015
Figure 32. Skipjack nominal average CPUE of associated flags PS, by size categories of PS (average of the 7 core areas) (mainly on FADs).
Figure 33. Average CPUEs of SKJ by French PS of class 6 (800-1,200 t) in the 7 core areas) (mainly on FADs).
Figure 34. Average CPUEs of SKJ by Spanish PS of class 6 (800-1,200 t) in the 7 core areas) (mainly on FADs).
PUE small YFT France Cat6 /area
0 1 2 3 4 5 6 1991 1992 1993 1994 1995 1996 1997 1998 1999 2000 2001 2002 2003 2004 2005 2006 2007 2008 2009 2010 2011 2012 2013 2014 2015
GuineaDome Guinea PICOLO CI-Ghana
CapeLopez SW-Equat SE-Equ Average
SKJ PUE PS Spain Cat 6
0 5 10 15 20 25 1991 1993 1995 1997 1999 2001 2003 2005 2007 2009 2011 2013 2015 Year PUE t/d ay
GuineaDome Guinea PICOLO Ghana-CI
CapLopez EquatSW EquatSE Average
0 5 10 15 20 25 1991 1993 1995 1997 1999 2001 2003 2005 2007 2009 2011 2013 2015
GuineaDome Guinea PICOLO Ghana-CI
CapLopez EquatSW EquatSE Average
SKJ nominal CPUE NEI PS /cat
0 2 4 6 8 10 12 14 16 18 20 22 1991 1992 1993 1994 1995 1996 1997 1998 1999 2000 2001 2002 2003 2004 2005 2006 2007 2008 2009 2010 2011 2012 2013 2014 2015 Cat 5 Cat 6 Cat 7
PUE small YFT Spain Cat6 /area
0 1 2 3 4 5 6 1991 1993 1995 1997 1999 2001 2003 2005 2007 2009 2011 2013 2015 Year CPUE t/d GuineaDome Guinea PICOLO CI-Ghana CapLopez SW-Equat SE-Equ Average
Figure 37a. Age 0 YFT CPUEs of French and Spanish category 6 PS, average in the 7 core areas.
Figure 37b. Age 1 YFT CPUEs of French and Spanish category 6 PS, average in the 7 core areas.
Figure 38. Normalized CPUEs of small BET (<10 kg) by area in the core fishing zone, and average, class 6 French PS (800-1,200 t).
Figure 39. Idem for Spanish PS.
BET Small CPUE /area Class 6 Spanish PS
0,0 0,5 1,0 1,5 2,0 2,5 3,0 3,5 4,0 4,5 5,0 1991 1993 1995 1997 1999 2001 2003 2005 2007 2009 2011 2013 2015 Year CPUE t/d ay
PICOLO CI-Ghana CapLopez Guinea
GuineaDome SW-Equat SE-Equ Average
Age 0 YFT CPUEs of Cat 6 PS average 7 areas
0,0 0,2 0,4 0,6 0,8 1,0 1,2 1,4 1991 1993 1995 1997 1999 2001 2003 2005 2007 2009 2011 2013 2015 Year CPUE t/d ay
France Spain Average
Age 0 YFT CPUEs of Cat 6 PS average 7 areas
0,0 0,2 0,4 0,6 0,8 1,0 1,2 1,4 1991 1993 1995 1997 1999 2001 2003 2005 2007 2009 2011 2013 2015 Year CPUE t/d ay
France Spain Average
BET Small CPUE /area Class 6 French PS
0,0 0,5 1,0 1,5 2,0 2,5 3,0 3,5 4,0 4,5 5,0 1991 1993 1995 1997 1999 2001 2003 2005 2007 2009 2011 2013 2015 Year PUE t/d ay
GuineaDome Guinea PICOLO CI-Ghana