Contributions to Risk-Informed Decision Making
byMichael A. Elliott
S.B. & S.M., Nuclear Science and Engineering (2006)
Massachusetts Institute of Technology
Submitted to the Department of Nuclear Science and Engineering in Partial Fu the Requirements for the Degree of
Doctor of Philosophy in Nuclear Science and Engineering at the
Massachusetts Institute of Technology
June 2010
0 2010 Massachusetts Institute of Technology. All rights reserved.
lfillment of MASSACHUSETTS INSTI1TTE OF TECHNOLOGY
DEC 0
9
2010
LIBRARIES
ARCHIVES
'A I -Signature of Author...Department of Nuclear Science and Engineering Submitted May 7, 2010
-
I
Certified by ...
George E. Apostolakis KEPCO Professor of Nuclear Science and Engineering Thesis Supervisor
Certified by ...
Norman K. Rasmussen
...
Benoit Forget Assistant Professor of Nuclear Science and Engineering Thesis Reader
C'
/7
A ccepted by ... /...
Jacquelyn C. Yanch Professor of Nuclear Science and Engineering Chair, Department Committee on Graduate Students
Contributions to Risk-Informed Decision Making
byMichael A. Elliott
Submitted to the Department of Nuclear Science and Engineering on May 7, 2010 in Partial Fulfillment of the Requirements for the Degree of Doctor of Philosophy in
Nuclear Science and Engineering
ABSTRACT
Risk-informed decision-making (RIDM) is a formal process that assists stakeholders make decisions in the face of uncertainty. At MIT, a tool known as the Analytic
Deliberative Decision Making Process (ADP) has been under development for a number of years to provide an efficient framework for implementing RIDM. ADP was initially developed as a tool to be used by a small group of stakeholders but now it has become desirable to extend ADP to an engineering scale that can be used by many individual across large organizations. This dissertation identifies and addresses four challenges in extended the ADP to an engineering scale.
Rigorous preference elicitation using pairwise comparisons is addressed. A new method for judging numerical scales used in these comparisons is presented along with a new type of scale. This theory is tested by an experiment involving 64 individuals and it is found that the optimal scale is a matter of individual choice.
The elicitation of expert opinion is studied and a process that adapts to the complexity of the decision at hand is proposed. This method is tested with a case study involving the choice of a heat removal technology for a new type of fission reactor.
Issues related to the unique informational needs of large organizations are investigated and new tools to handle these needs are developed.
Finally, difficulties with computationally intensive modeling and simulation are
identified and a new method of uncertainty propagation using orthogonal polynomials is explored. Using a code designed to investigate the LOCA behavior of a fission reactor, it is demonstrated that this new propagation methods offers superior convergence over existing techniques.
Thesis Supervisor: George E. Apostolakis
Acknowledgements
I would like to thank Professor George Apostolakis for his support and encouragement
throughout my graduate studies at MIT. The guidance he has provided has made my time at MIT both memorable and rewarding.
Dr. Homayoon Dezfui's support and guidance were invaluable in focusing this research. The issues he raised formed the basis for this work.
I would like to thank the MIT FCRR design team who participated in this project and
provided valuable and timely feedback. Team members included: N.E. Todreas, P. Hejzlar, R. Petroski, A. Nikiforova, J. Whitman, and C.J. Fong. Further thanks are extended to C.J. Fong for advocating on my behalf to the design team.
I would like to acknowledge the department of Nuclear Science and Engineering at MIT
for providing me with the intellectual tools to ask the important questions that are the hallmark of academic exploration. The past eight years studying with my colleagues in the department has been a transformative experience.
My readers and members of my thesis committee, Professors Ben Forget, Michael Golay
and Jeffery Hoffman, have provided advice and objective review that has greatly improved this research.
This work was supported by the National Aeronautics and Space Administration's Office of Safety and Mission Assurance in Washington, DC.
1 Dissertation Summary
The design and development of engineered systems involves many decisions that require balancing various competing programmatic and technical considerations in a manner consistent with stakeholder expectations. To assist in making these decisions, a logically
consistent, formal decision-making process is required that can by deployed on an engineering scale. Decision making under these conditions has become known as risk-informed decision-making (RIDM) and this dissertation was commissioned by NASA to develop supporting methods.
RIDM is intended to assist a group of multiple stakeholders, each of whom may have different priorities, approach a decision problem in which there are a number of important objectives to achieve and numerous, significant uncertainties surrounding the decision options. It is designed to produce replicable, defensible decisions by adhering to the principles of formal decision theory. It recognizes the importance of subjective and difficult-to-quantify aspects of decision-making and so it pairs a deliberative framework with analysis in all points of the process. RIDM is scalable in that the rigor and
complexity of the analysis is commensurate with the significance of the decision that is to be made. RIDM techniques may be applied to a broad range of decision problems, but the focus here is on problems that arise in the development of engineered systems early in their design phase.
One particular subset of RIDM techniques that can be applied to these design phase decision problems is known at the Analytic-Deliberative Decision-Making Process
(ADP). ADP is a tool used for making decisions when there is adequate time for analysis
and collective discussion. It is not appropriate for real time decision-making, which requires other RIDM techniques. ADP is a methodology that has been under
development at MIT for a number of years and has been used to study a number of decision problems including problems in environmental cleanup [38] and water distribution reliability [39]. Here we focus on RIDM techniques as they apply to the
ADP.
It will be helpful to present the contributions of this dissertation to the development of
ADP based RIDM in terms of a concrete decision problem. Recognizing that ADP may
be applied to decision-making in may types of engineered systems; we will proceed with a case study from nuclear reactor design.
As part of the Department of Energy's Nuclear Energy Research Initiative (NERI), the Department of Nuclear Science and Engineering at MIT studied 2400 MWth lead-cooled and liquid-salt cooled fast reactors known as the Flexible Conversion Ratio (FCR) reactors [1]. The FCR reactors are so named as it is intended that, with minimal
modifications, they will be able to operate at both a conversion ratio near zero, to dispose of legacy waste, and near unity to support a closed fuel cycle. Study of these reactors indicates that the most severe transient they are likely to encounter is a station blackout,
i.e., loss of offsite power and emergency onsite ac power. To prevent core damage during such a transient, a passive decay heat removal system is desired.
To remove decay heat, FCR designers developed two options. Both were referred to as Passive Secondary Auxiliary Cooling Systems (PSACS) and they differed primarily in the choice of ultimate heat sink. One system used air and the other water. Details are available in [2]. The choice between these two PSACS systems was made using RIDM techniques and so throughout this summary we will parallel the contributions of this dissertation with addressing the PSACS decision problem.
RIDM with the Analytic Deliberative Process
In the previous section, the goals of RIDM and the use of ADP were outlined in general terms. Before continuing, it is necessary to understand the ADP [4] in detail. As shown in Figure 1, the ADP has five steps. It begins with an analyst identifying the
stakeholders (SHs) and leading this group in framing a specific decision problem and defining the context in which the decision is to be made. For our purposes, selecting a
PSACS system is the problem.
Develop Identify Assess Rank Options
Formulate Problem Objectives Options Performance and Decide
Hierarchy Measures >
Figure 1: Steps in the Analytic-Deliberative Process
Once the SHs specify the decision problem, they must identify all of the elements that each individual believes is important to consider in evaluating decision options. Forming an Objectives Hierarchy captures this information and the hierarchy for the PSACS problem is shown in Figure 2 and Table 1. Proceeding from the goal, to the objectives, to attributes, the problem is broken down into a set of elemental issues that express what the decision options must accomplish.
GOAL PSACS maintains safety during SBO and does not
I ~ compromise normual operations
OBJECTIVESsaeyipoiiePAS-rfarblc
ATTRIBUTES
wjw
j
w w
w wr,
Ly
QPMs v1 V v3 v v
L
v v vvJ vFigure 2: Objectives Hierarchy and Performance Measures
The final tier in the objectives hierarchy is made up by the quantifiable performance measures (QPMs). QPMs are developed by first examining the attributes and determining a set of appropriate metrics to measure each.
Table 1: Definitions for PSACS Objectives Hierarchy
ATTRIBUTES QPMs
w1 Safe and reliable for normal operations
w2 Safe and reliable during SBO w3 Accessible
w4 Simple
w5 Robust
w6 Designable
w7 Economical
SSCs: Structures, Systems and Components
vi Results of spurious actuation v2 Confidence in PCT
v3 S-CO2 circulation performance v4 Ability to inspect
v5 Ability to maintain
v6 Number of active SSCs
v7 Margin to required energy removal rate
v8 Resilience against CCFs
v9 Model confidence
vio Degree of effort required
CCFs: Common Cause Failures vnI Component costs
SBO: Station Blackout
I
1___
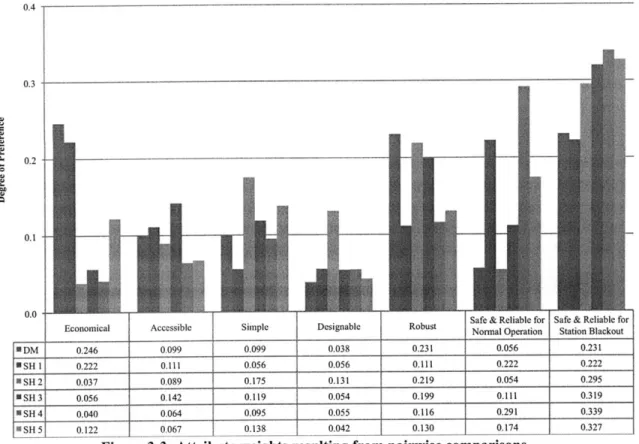
In the context of the QPMs, the SHs must now determine how relatively important each attribute is to achieving the overall goal. To capture these preferences, the analyst conducts an elicitation exercise. Pairwise comparisons between attributes are made that
determine which of the pair is more important to achieving the goal and then how much more important. Pairwise comparisons result in a set of person-specific weights, wi, for the attributes that indicate the relative importance of attribute i in the overall context of the decision problem.
With all of this information collected, the objectives hierarchy is fully specified and the
ADP process proceeds to its third step in which decision options are identified. In the
fourth ADP step, each of the decision options is scored according to the set of QPMs. Appropriate modeling and analysis is conducted and combined with the expert opinion of the participants so that the level of performance of each decision option is understood as well as possible. In general, this step of ADP is the most time consuming and resource intensive as it is the point where external tools are used to study the decision options (see, for example [7]). These may include computer modeling and simulation, physical
experiments or extensive literature review.
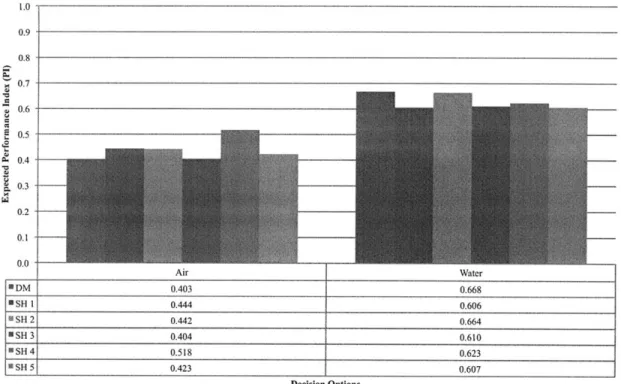
In the final step of ADP, the DM and the SHs select a decision option using a deliberative process that is led by the analyst. To facilitate deliberation, the analyst presents a
preliminary ranking of the decision options. Options are ranked according to a Performance Index (PI). The PI for optionj is defined as the sum of the values, vy, associated with the QPMs for attribute i weighted by the attribute weight, wi.
NQpM
PI = wi(1)
The PSACS selection problem is the first application of ADP to problems in nuclear reactor design. With this problem and others presented by NASA, four areas are
identified in which the current ADP tools and techniques are inadequate for decision making on an engineering scale. These areas are:
1. The pairwise comparison process needed to develop the weights, wi, requires a
numerical scale to convert subjective expressions of preference into numbers that may be analyzed. The existing scale is arbitrary and its implications not well understood.
2. The existing process of developing the QPMs requires substantial effort both in modeling and simulation and in training experts in decision theory. This effort makes the ADP too complicated to apply except for the most consequential decisions.
3. The information necessary to make decisions is stored across many individuals.
No one person may adequately specify both the performance of a decision option and have knowledge of all the impacts that option will have on the overall system. Yet, the ADP envisions decisions being discussed only across a small group of stakeholders.
4. In cases where extensive modeling and simulation of the QPMs cannot be
avoided, long running computer models are often required. These long run times may be prohibitive.
This dissertation addresses each of these four areas and develops the theory, methods and tools necessary to extend ADP to engineering scale decision-making. The contributions made in each area are now presented in turn.
Selecting numerical scales for pairwise comparisons
The pairwise comparison process used in the ADP allows an analyst to construct a set of weights, wi, that will indicate how relatively important each of the attributes in a decision problem is to a SH. For example, if a PSACS SH is considering the attributes simple, robust and economical, then it is possible for that SH to respond to questions that will
allow us to develop the numerical weights wsimple, Wrobust and Weconomical such that the ratio Wsimple/Weconomical represents how much more important the simplicity of a PSACS system
is to its cost.
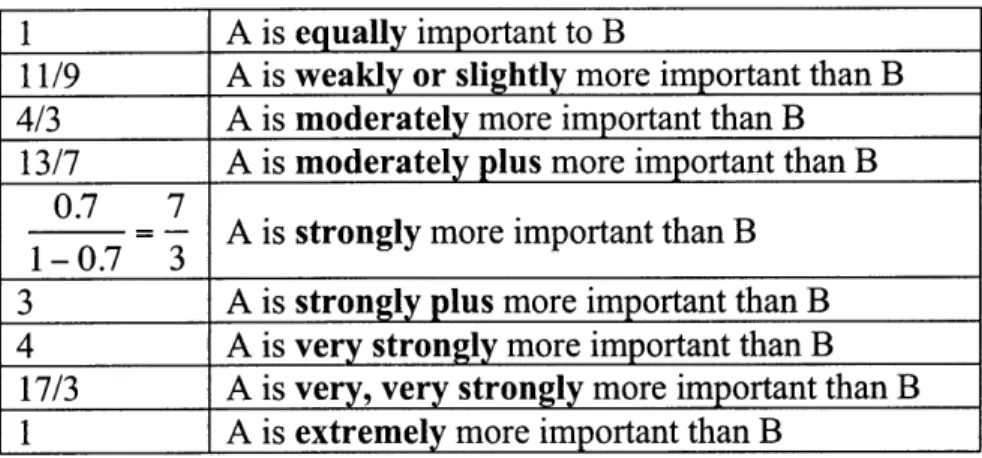
To uncover these weights, attributes are presented to a SH two at a time and he is asked to answer two questions about each pair. First, which of the items in the pair is more important and, then, how much more important it is. To answer the second question regarding the degree of preference, the individual is given a list of linguistic phrases to select from. Each phrase used must be assigned a numerical value from the scale in order for a weight vector to be determined.
Up to this point the choice of scale has been somewhat arbitrary with the most common
authors proposing many scales without any clear benchmarks against which to measure them. Yet the choice of scale is potentially very important to decision making as it can
affect not only the relative degree of importance between attributes but also their rank order.
The goal of this work with pairwise comparisons is to remove the arbitrary nature of scale choice by providing a sound theoretical basis for selecting a scale and then to make some assessment of which scale would be best to use with engineering decision problems like the PSACS problem.
Contributions to scales for pairwise comparisons
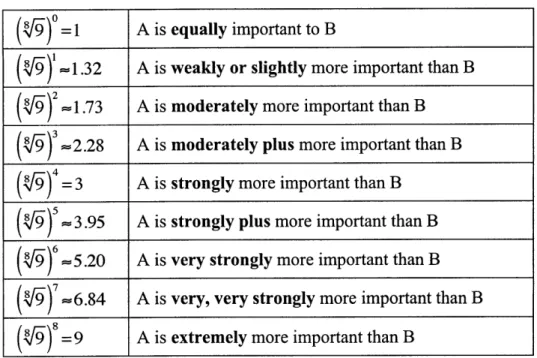
The arbitrary nature of scale choice is addressed by recognizing a connection between the pairwise comparisons between abstract attributes and the sensations that arise when the human brain processes stimuli perceived by our senses. When our eyes, for example, collect a light stimulus, information is transmitted to our brain and a sensation of that stimulus is produced. Depending on the intensity of the light, a different sensation is produced that we interpret as brightness. Each of our five senses is able to perform this function of converting different magnitudes of physical stimulus into a corresponding level of sensation. These conversions happen in a number of different ways. An exponentially increasing level of sound energy hitting our ears is interpreted as a linear increase in volume, while a linearly increasing level of light energy hitting our eyes is interpreted as a linearly increasing level of brightness.
If we view a pairwise comparison between abstract attributes as producing the stimulus
of importance we must ask how the brain interprets the sensations of varying levels of importance. The scale must therefore reflect the manner in which an importance stimulus is converted to sensation. It is found that there are three primacy ways in which the brain treats this conversion from stimulus to sensation. A linear increase in stimulus can produce a linear increase in sensation, an exponential increase in stimulus can produce a linear increase in sensation or a linear increase in stimulus can produce an exponential increase in sensation. This observation leads to three candidate families of scales that correspond to each of the three stimulus-sensation paradigms. Further investigation of the literature demonstrates that several of the existing scales are appropriate for the linear-linear and the exponential-linear paradigms, and this author develops the third family of scale for the linear-exponential paradigm. These families are referred to respectively as the integer, balanced and power families.
With a sound theoretical basis for picking three families of scale, it is recognized that a number of free parameters existed. It is proposed that these parameters be chosen assuming that individuals exhibited rational behavior in selecting between attributes. Here rational behavior is a technical term meaning that an individual acts in accordance with the Von Neumann-Morgenstern axioms of rational behavior [35]. These axioms require completeness, transitivity, continuity, and independence among preferences.
With a cognitive basis for identifying families of scales and an axiomatic basis for picking free parameters, the problem of arbitrary scale selection is solved. It is now necessary to test which of the three families of scales actually represents the manner in which individuals judge importance between attributes. To this end, a study has been
conducted of 64 individuals facing a realistic decision problem. What was found is quite interesting. Up until this point, the question being asked in the literature has been: what is the best scale to use for a particular type of decision problem? Our study reveals that this is the wrong question and that in fact the best scale is very much an individual
choice. Remarkably, from individual to individual, there are differences in the way in which importance is perceived. It has been found that almost exactly a third of the experimental group preferred each of the three scale families.
As a result of this work, the author has proposed a change in the pairwise comparison process used with the ADP. Individuals are now given a choice of scale to represent their preferences for attributes. In addition, the author hopes that this work will have a
significant impact in reducing the number of arbitrary scales that will be proposed in the future without recourse to some sound cognitive basis. The question of best scale should be thought of in terms of individuals rather than in terms of a certain decision problem.
This work is published in the journal of Reliability Engineering and System Safety [68] and is the subject of a paper and presentation that will appear in the June 2010
Probabilistic Safety Assessment and Management (PSAM) conference in Seattle, WA
[69]
Elicitation of expert opinion
When using the ADP, once decision options have been identified, it is necessary to establish the range of performance each option may achieve relative to each QPM. In the
PSACS problem, this required establishing, for example, how easily the air and water
options could be inspected or maintained. Objectively establishing ease of inspection and maintenance is not a trivial task. First, some basis or reference system must be
established so ease can be assessed relative to a standard. Then, we need to identify and measure a set of criteria or characteristics of the basis system. These would allow us to
quantify ease of inspection and maintenance. These characteristics then need to be measured in each of the candidate systems. Once these characteristics are aggregated into a summary measure we would have a QPM.
There are a number of difficulties with this objective approach. First, it is quite complex and requires significant effort. Second, it requires a very detailed understanding of the two candidate decision options. This complexity significantly limits the usefulness of the ADP as it leads decision-makers to only apply the ADP to the most significant
decision problems were the consequences are such that the effort required to complete the process is justified. The requirement for detailed understanding of the decision options is even more restrictive for our purposes as we wish to apply RIDM to the design of
engineering system, a phase in which, by definition, decision options have not been well characterized. As such, we may wish to avoid the objective evaluation of the QPMs,
when the required level of precision allows, and rely on a subjective analysis in which we elicit the opinion of experts as to the likely range of performance of the decision options.
The elicitation of expert opinion has been an active area of research and many techniques have been proposed [10]. Good expert opinion elicitation methods typically focus on issues related to training the experts to correctly express probabilistic information, insuring completeness, trading off the opinions of multiple experts, etc. These methods do an excellent job of allowing us to evaluate QPMs without having access to a fully design systems, but they do not do much to lessen the complexity of the process. As such, methods of eliciting expert opinion were studied as part of the PSACS exercise with the goal of simplifying the process while insuring a level of fidelity adequate to complete the decision making process.
Contributions to the elicitation of expert opinion
As part of working through the ADP, SHs learn to use pairwise comparisons to rank the relative importance of attributes. To use pairwise comparisons some training is required. In the past, after completing pairwise comparisons, participants would be trained on an entirely new method to collect judgments needed to evaluate the QPMs. This additional step has been eliminated. Methods have been developed that allow participants to use the same concepts they learned for pairwise comparisons and apply them to the construction of the QPMs.
The new process is conducted in a highly deliberative manner between an expert and the analyst. The expert outlines her believes about the range of reasonable performance any acceptable system might achieve. This serves as a surrogate for a basis system. The expert then relates her understanding of the characteristics of the decision options under design and, using the pairwise comparison methods, compares the decision options to the range of acceptable performance there by creating a numerical score for the options. This process is fast while still generating a traceable record of the expert's thinking and
motivations.
Such a qualitative approach to QPM development can be unsettling to engineers and so it was important to develop a case study that demonstrated the efficacy of the approach.
This was done using the PSACS decision problem. The experts used the methods described and were able to reach a logical, defensible decision. This case study has proved very useful in convincing other groups that such a method of expert opinion elicitation is viable.
These methods and the results of the PSACS study are the subject of a paper published by this author in the journal of Nuclear Engineering and Design [70] and a paper and
presentation at the 2008 ANS Probabilistic Safety Analysis (PSA) topical meeting in Knoxville, TN [71].
ADP with disbursed information
ADP is based on the principles of formal decision theory, which is an axiomatic theory
applicable to a single individual. Extensions to multiple individuals, while common due to practical necessity, depart from this axiomatic basis and require special treatment. In a large organization, such as NASA, a large group of individuals is usually involved. Each individual is familiar with a certain piece of knowledge important to the decision
problem, but he may be unaware of the overall context of the problem and he may not be an active participant in the decision-making process. In such cases, special tools and techniques are required to implement the ADP. These tools did not exist at the outset of this work and so they have been developed.
Contributions to ADP with disbursed information
As a first step, organizational relationships need to be understood. Instead of having a small number of individuals that can easily come together to discuss a decision problem, as was the case in the PSACS exercise, there are now large portions of the organization whose needs must be represented. Where before there were individual SHs, now each
SH represents the aggregate beliefs of entire segments of the organization. These
segments have a stake in the outcome of the decision, as it can enable or constrain their future capabilities, but they have little direct authority over the decision. No one segment can be expected to identify all the decision options or be intimately familiar with each. It must rely on experts across the organization to identify and analyze options and relate their relative advantages and disadvantages. In addition, another set of experts is required, who have expertise in the specific areas where consequences of the decision will be experienced, to help specify how desirable particular characteristics of a decision
option are.
These relationships lead to a number of separate rolls for individuals participating in the decision problem. For the first time, this work identified these rolls, specified the responsibilities of each and provided guidance as to how individuals in each roll will need to interact over the course of implementing the ADP.
With such a large, varied and potentially geographically distributed group of individuals participating in the ADP, new tools are required to assist in collecting information. These tools have been developed by this author in Microsoft Excel. Excel is a very desirable tool due to its ubiquity, but up until this point, had not been thought to be practical for the
ADP due to certain computational requirements. In particular, the ADP requires linear
algebra and Monte Carlo simulations that are not standard features in Excel. The
necessary algorithms have been developed and implemented in Excel, however, and, as a result, an easy to distribute and intuitive tool is available.
As a result of these innovations, the guidance and tools now exist to apply ADP for large scope decision problems affecting large organizations. This work has been reported on in two white papers by this author distributed internally within NASA.
Uncertainty Propagation using Orthogonal Polynomials
It was previously observed that the quantitative evaluation of the QPMs can require significant effort and so methods have been developed to obtain QPMs from expert opinion when appropriate. In certain cases, however, expert opinion is insufficient as the level of precision needed surpasses what experts are able to provide. In these cases, a certain amount of modeling and simulation may be required. In performing this simulation, a common problem may arise. The simulation might be computationally intensive and require a long runtime for a single realization of the input parameters. Multiple realizations are desired, however, as we wish to understand how input uncertainties effect the distribution of performance a decision option may achieve.
What is required then is a method of obtaining the distribution of performance while running as few realizations of the input parameters as possible. Monte Carlo or Latin Hypercube techniques are not appropriate for this purpose, as they require too many simulations be performed. Many methods have been proposed to do uncertainty propagation with sparse sampling. One of the more popular methods uses response surfaces. Response surfaces are very good at capturing the modal performance of a decision option but not at representing the extremes. Cases like the PSACS, where any failure may lead to catastrophic reactor meltdown, require a faithful representation of the complete range of possible system performance.
Here a new method for uncertainty propagation is proposed based on an expansion in orthogonal polynomials. This method is intended to better represent the full range of possible performance.
Contributions to uncertainty propagation using orthogonal polynomials
The use of orthogonal polynomials in solving integral or differential equations will be familiar to nuclear engineers, where a common example is the application of the P, method, using Legendre polynomials, to solve the neutron transport equation. Recently, a small number of authors have begun to apply these same principles to the propagation of uncertainties through computational models.
The principle is very simple. A family of polynomials, T, is selected that is orthogonal to the probability distribution, w, being used to represent the input uncertainties, xi, in the computational model. Recall that orthogonally is defined with respect to the inner product where
(=0,
k #1,,Tj,= LTk (XYI'(X)w(X)dX >0, k=l, (2)
The output of the model, S(X), can then be represented as an expansion in terms of these polynomials.
M-1
S(X)~ SSV,(xlI,...,1xN)3
i=1
where M governs the order at which the expansion is stopped for computational convenience. With this representation of S(X), the distribution of the model output is known analytically.
The coefficients Si are found in the usual manner
(ST),
S. = ii* ' (4)
Up until this point, polynomial expansions could only be performed in cases were the
input uncertainties were all represented by the same type of probability distribution, i.e., a lognormal distribution. If the uncertainties were represented my multiple types of
distribution, it was not possible to form an orthogonal basis except in certain cases where the complete joint distribution of the X was known. In most engineering applications, the joint distribution is not known but rather the marginal distributions are estimated along with some assessment of the linear correlation coefficients.
Here, a method has been developed to allow the propagation of arbitrary probability distributions using only the marginal distributions of each of the uncertain parameters and the linear correlation coefficients. This method makes use of an isoprobabilistic
transformation that converts the arbitrary probability distributions first to correlated Gaussian distributions and then to uncorrelated standard normal Gaussian distributions.
This method has been tested on the Pagani et al GFR model [64] that simulates the effects of a severe LOCA. In addition to this being the first application of the isoprobabilistic uncertainty propagation approach, it is also the first application of any orthogonal polynomial uncertainty propagation technique to nuclear engineering. The Pagani et al model supposes nine uncertain input parameters, reactor power, pressure, the temperature
of certain heat removal surfaces at the time of the LOCA and six other thermohydraulic parameters.
Figure 3 presents the resulting distribution of the maximum hot channel temperature, an important parameters to monitor during the LOCA, obtained from the set of nine
differently distributed, correlated uncertainties for three simulations. The first simulation is a Monte Carlo simulation that took 10,000 samples from the underlying model. This number of samples was needed to converge all percentiles to <1%. We will consider this simulation to represent the exact solution. The second simulation is a full factorial response surface requiring 256 samples from the model. The final simulation is a 3rd
u.. 0.6
0.4
U
600 800 1000 1200 (00 600 800 1000 1200
Hot Channel Temperature (degrees C Hot Channel Temperature (degrees C)
50 -100 -150 --- RS vs. MC! PC vs. MCi -200 0 20 40 60 80 100
Hot Channel Distribution Percentile
Figure 3: Results of the nine random variable simulation of the Pagani et al model. Panels A and B compare the PDFs and CDFs respectively from a Monte Carlo (MC) simulation with those of a full factorial response surface (RS) and 3rd order isoprobabilistic polynomial expansion (PC). Panel C presents the error of the response surface and chaos relative to the Monte Carlo as a function of
percentile.
Panels A and B of the figure present the PDFs and CDFs respectively for the three simulations. Panel C presents the error in degrees Celsius for the response surface and isoprobabilistic chaos relative to the Monte Carlo. Note that the response surface initially, at the 0th percentile, underestimates the hot channel temperature by about 25'C
then, by the 9 0th percentile, over estimates it by about 25*C. More disturbing however, is that by the 9 9th percentile the response surface is underestimating the hot channel
temperature by about 150'C. The isoprobabilistic polynomial expansion, on the other hand, very closely tracks the Monte Carlo solution from the 0th until the 97th percentile and then overestimates the hot channel temperature by about 25'C by the 9 9th percentile. We conclude then that even with 36 fewer samples of the underlying model, the
isoprobabilistic chaos produces superior results and may be a promising new technique for uncertainty propagation.
This work has not yet been published but is the subject of manuscript under preparation for the journal Risk Analysis.
[-MC 10,000 samples -- RS 256 samples
Table of Contents
1 DISSERTATION SUMMARY 5
2 INTRODUCTION 21
2.1 Objectives 22
3 RISK-INFORMED DECISION MAKING TO SELECT THE PSACS
ULTIMATE HEAT SINK 23
3.1 Risk-Informed Decision Making and the ADP 24
3.2 Deliberation and Results 29
3.3 Conclusions 31
4 SELECTING NUMERICAL SCALES FOR PAIRWISE COMPARISONS 33
4.1 Pairwise comparisons 35
4.2 The Scale 37
4.2.1 Integer Scales 37
4.2.2 Balanced Scales 39
4.2.3 Power Scale 40
4.3 Choosing a Scale - Normative Factors 41
4.3.1 Distribution of the Weights 41
4.3.2 Consistency of the Pairwise Comparisons 44
4.4 Choosing a Scale -Empirical Arguments 47
4.5 Study I - 64 Individuals, Hypothetical Decision Problem 49
4.5.1 The True Scale 49
4.5.2 Number of Degrees of Preference 50
4.5.3 Calibrating the Participants 52
4.6 Study 11 - 3 Individuals, Actual Decision Problem 53
4.7 Conclusions 56
5 RISK-INFORMED DECISION MAKING FOR THE ASSESSMENT OF
LUNAR SERVICE SYSTEMS PAYLOAD HANDLING 57
5.1 RIDM for LSS 57
5.2 The Analytic Deliberative Process for Large Groups 58
5.2.1 Steps in Implementing the large group ADP 60
5.3 The Role of Experts 64
5.3.1 Formulating Quantifiable Performance Measures 64
5.3.2 Identifying Measurable Consequences 65
5.3.3 Specifying the Range of Consequences 65
5.3.4 Determine the Value of a Level of Consequence 65
5.3.5 Formulating and Scoring Decision Options 67
5.4 Lunar Payload-Handling 68
5.5 Conclusions 79
6 UNCERTAINTY PROPAGATION USING ORTHOGONAL POLYNOMIALS
81
6.1 Orthogonal Polynomials 82
6.1.2 Generating Orthogonal Polynomials - Recurrence Relation 83
6.2 Uncertainty Propagation Using Orthogonal Polynomials 83
6.2.1 Independent Gaussian Random Variables 84
6.2.2 Independently distributed random variables 86
6.2.3 Dependent, differently distributed random variables 89
6.3 Calculating the Expansion Coefficients 91
6.4 Applications - A Simple Polynomial Model 92
6.5 Applications - A Simple Non-Polynomial Model 95
6.6 Applications - Nuclear Reactor Transients 97
6.7 Conclusions 102
7 REFERENCES 104
8 APPENDIX I - PSACS QPMS 110
9 APPENDIX I - THE RANDOM INDEX 113
10 APPENDIX III - SURVEY QUESTIONS 114
Table of Figures
Figure 2-1: Steps in the Analytic-Deliberative Process...25
Figure 2-2: Objectives Hierarchy and Performance Measures...25
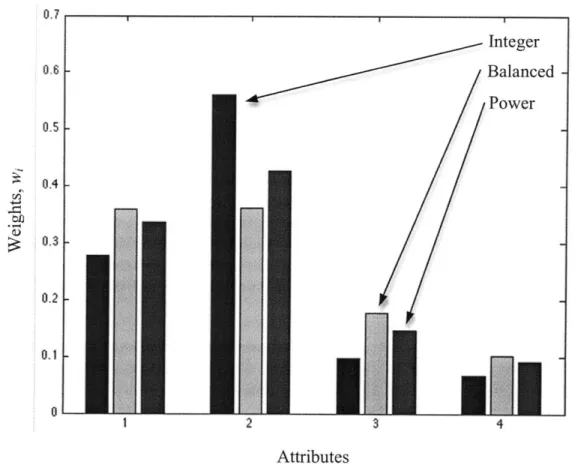
Figure 2-3: Attribute weights resulting from pairwise comparisons...28
Figure 2-4: Expected PI for PSACS Decision Options ... 30
Figure 2-5: Attribute Contributions to PI for SH 5...31
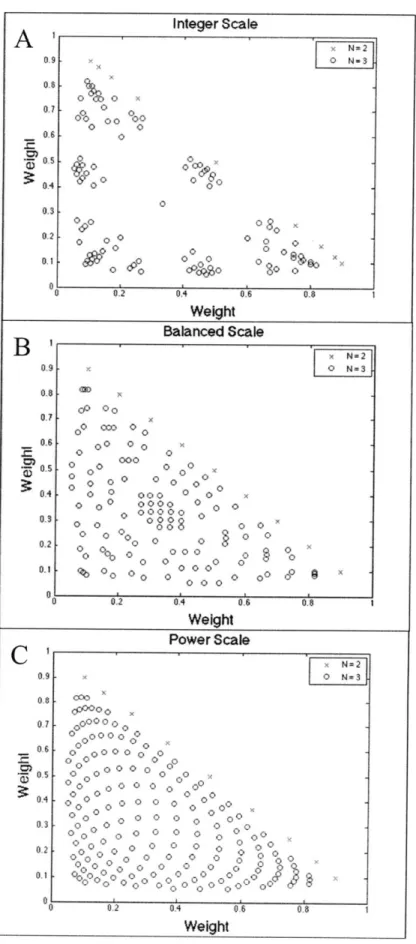
Figure 3-1: Distribution of attribute weights obtainable by the three scales for comparisons between 2 and 3 attributes. A simple computer algorithm was written to generate these distributes that iteratively evaluated the weight vectors for all possible sets of judgm ents. ... 43
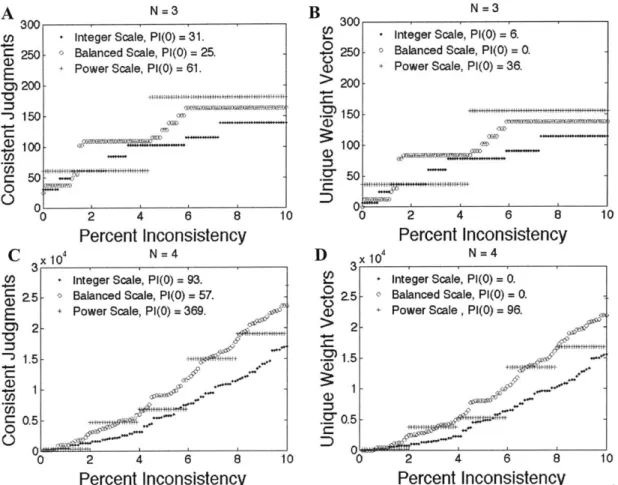
Figure 3-2: Possible number of consistent judgments and weight vectors for each of the three scales as a function of the permitted percent inconsistency as defined by the consistency ratio CR. Panels A and B are for judgments among three attributes, N=3. Panels C and D are for N = 4. Panels A and C present the total number of consistent judgments. Panel B and D present the number of unique weight vectors that arise from these consistent judgments. A unique weight vector is defined as one with N unique numerical values. The data in this figure was generated by a computer algorithm that generated the weight vectors for all possible sets of judgments and then calculated the consistency ratio corresponding to those ju d gm ents...4 6 Figure 3-3: Weight vectors calculated using the three scales. Each weight vector is one possible numerical interpretation of the relative importance of four attributes derived from a single set of judgments obtained from one individual. ... 48
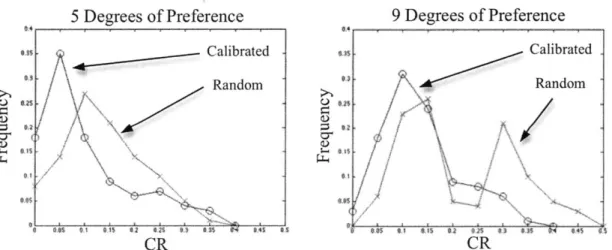
Figure 3-4: Distribution of CR for study participants. The CR for each individual was calculated using the RI from the scale that individual preferred. The left panel presents CRs for individuals given 5 degrees of preference to choose from and the right panel presents CRs for 9 degrees. The curves marked as calibrated refer to CR values from the set of individuals who were asked to first complete bounding pairs. The curves marked as random refer to CR values for individual who were presented pairs at random . ... 52
Figure 3-5:Absolute percent difference between attribute weights when calculated with the three scales. Results are presented as a function of the attribute weight calculated using the integer scale and are shown separately for the three stakeholders (S H )...54
Figure 3-6: Performance Index (PI) for the air and water ultimate heat sink options as a function of the three scales for the three stakeholders. The PI has been normalized such that the PI of the water option is unity. ... 55
Figure 4-1: Hierarchy of Decision Participants ... 59
Figure 4-2: Schematic Objectives Hierarchy [40]...61
Figure 4-3: Continuous Value Function ... 66
Figure 4-4: Lunar Payload Handling Objectives Hierarchy top level...69
Figure 4-5: Constraints attributes ... 71
Figure 4-6: Sim plicity attributes... 73
Figure 4-7: Versatility and contingency attributes ... 74
Figure 4-8: Optim ization attributes ... 76
Figure 4-10: Programmatic resources attributes... 78
Figure 5-1: Polynomial expansions with Hermite basis for a simple polynomial with standard normal uncertainties. Panel A presents the PDF of the reference solution as well and 1s' and 2"d order expansions (PC). Panel B presents the error relative to the reference solution for the 1't and second order expansions as a function of percentile
of the reference solution. ... 93
Figure 5-2: Polynomial expansions with a hypergeometric basis for a simple polynomial with uniform uncertainties. Panel A presents the PDF of the reference solution as well and 1't and 2nd order expansions (PC). Panel B presents the error relative to the
reference solution for the 1st and second order expansions as a function of percentile
of the reference solution. ... 94 Figure 5-3: Polynomial expansions with an isoprobabilistic basis for a simple polynomial
with differently distributed uncertainties. Panel A presents the PDF of the reference solution as well and 1't and 2nd order expansions (PC). Panel B presents the error relative to the reference solution for the 1st and second order expansions as a
function of percentile of the reference solution... 95
Figure 5-4: Polynomial expansions with Hermite basis for a sin wave. Panel A presents the PDF and panel B the error as a function of percentile...96 Figure 5-5: Response surface analysis for a sin wave subject to standard normal
uncertainty. Panel A presents the PDF and panel B the error as a function of p ercen tile...97 Figure 5-6: Cumulative distribution function of the average outlet temperature from the
Pagani et al model for normally distributed uncertainty in reactor power. Results for Monte Carlo, orthogonal polynomial expansion (PC) and response surface
sim ulations are show n... 98
Figure 5-7: Results of the nine random variable simulation of the Pagani et al model. Panels A, B and C compare the PDFs from a Monte Carlo simulation with those of a full factorial response surface and the 1't through 4th order orthogonal polynomial
expansions (PC). Panel D presents the error of the response surface and expansions relative to the M onte Carlo as a function of percentile. ... 101
List of Tables
Table 2-1: Definitions for PSACS Objectives Hierarchy...25
Table 2-2: Constructed Scale for Number of SSCs ... 27
Table 3-1: Phrases used in the pairwise comparison process to indicate degree of importance of item A over item B [11] ... 35
Table 3-2: Hypothetical judgments between three items. ... 36
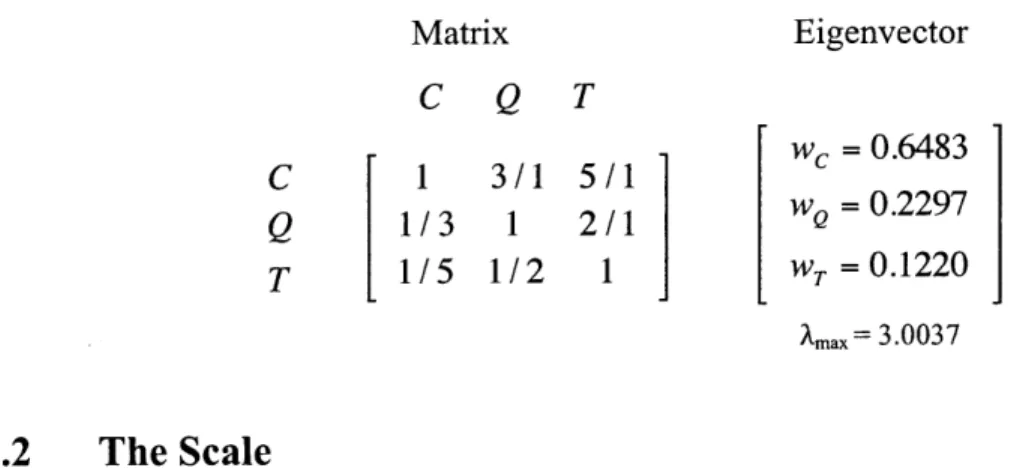
Table 3-3: Reciprocal matrix and corresponding weight vector obtained from pairwise comparisons for a hypothetical three-attribute decision problem...37
Table 3-4: Numerical Values of the Balanced Scale generated using Eq. 5 ... 40
Table 3-5: Numerical Values of the Power Scale... ... ... 41
Table 3-6: Percent of possible sets of judgments for N=4 whose corresponding weight vectors lead to different rankings among the attributes when calculated with the indicated scales. Percentages are given for rank differences regardless of the magnitude of the difference between the weights and for when the difference is greater then 5% and 10%. These results are presented without regard to the CR of the underlying judgments and using a nine-degree of preference scale...49
Table 3-7: Fraction of study participants believing each of the three scales best captured their actual attribute weights including the degree of belief over the two other scales. The degree of belief for each individual was calculated using his preferred numerical scale. The ranges supplied represent the 75% confidence interval of the responses. ...50
Table 3-8: Percentage of participant given either the 5 or 9 degree of preference elicitation scheme who believed the number of preference choices was too many, too few or just right... 51
Table 4-1: Constructed Scale - Largest mass on a single lander ... 62
Table 4-2: The W eighting Process ... 63
Table 4-3: D iscrete Q PM ... 67
Table 5-1: Several hypergeometric polynomials and their corresponding weight functions that correspond to useful probability distributions. k refers to the degree of the polynomial, x is the random variable, all other symbols are standard nomenclature from engineering applications of probability theory. ... 87
Table 5-2: Several hypergeometric polynomials and their corresponding recurrence relatio n s...8 8 Table 5-3: Distributions and associated parameters for the four x ... 94
Table 5-4: Input uncertainty distributions and correlations for isoprobabilistic basis simulation of the Pagani et al model. Correlation coefficients are designated by the parameter number in the left most column and are listed only once for each pair of correlated variables... 99
2 Introduction
The design and development of engineered systems involves many decisions that require balancing various competing programmatic and technical considerations in a manner consistent with stakeholder expectations. To assist in making these decisions, a logically consistent, formal decision-making process is required that can by deployed on an engineering scale. Decision making under these conditions has become known as risk-informed decision-making (RIDM) and this dissertation was commissioned by NASA to develop supporting methods.
RIDM is intended to assist a group of multiple stakeholders, each of whom may have different priorities, approach a decision problem in which there are a number of important objectives to achieve and numerous, significant uncertainties surrounding the decision options. It is designed to produce replicable, defensible decisions by adhering to the principles of formal decision theory. It recognizes the importance of subjective and difficult-to-quantify aspects of decision-making and so it pairs a deliberative framework with analysis in all points of the process. RIDM is scalable in that the rigor and
complexity of the analysis is commensurate with the significance of the decision that is to be made. RIDM techniques may be applied to a broad range of decision problems, but the focus here is on problems that arise in the development of engineered systems early in their design phase.
One particular subset of RIDM techniques that can be applied to these design phase decision problems is known at the Analytic-Deliberative Decision-Making Process
(ADP). ADP is a tool used for making decisions when there is adequate time for analysis
and collective discussion. It is not appropriate for real time decision-making, which requires other RIDM techniques. ADP is a methodology that has been under
development at MIT for a number of years and here we focus on RIDM techniques as they apply to the ADP.
The ADP was conceived as a decision-making process to be used by a small number of individuals and so several of its tools and techniques are inadequate for decision making on an engineering scale. In particular, four aspects of the ADP may hinder its application to engineering problems, these are:
5. The existing process of developing performance measures for decision options requires substantial effort both in modeling and simulation and in training experts in decision theory. This effort makes the ADP too complicated to apply except for the most consequential decisions.
6. The process required to rank the relative importance of attributes that contribute
to the decision problem requires a numerical scale to convert subjective
expressions of preference into numbers that may be analyzed. The existing scale is arbitrary and its implications not well understood.
7. The information necessary to make decisions is stored across many individuals.
No one person may adequately specify both the performance of a decision option and have knowledge of all the impacts that option will have on the overall system. Yet, the ADP envisions decisions being discussed only across a small group of stakeholders.
8. In cases where extensive modeling and simulation of the performance measures
cannot be avoided, long running computer models are often required. These long run times may be prohibitive.
2.1
Objectives
This dissertation addresses each of these four areas and develops the theory, methods and tools necessary to extend ADP to engineering scale decision-making. Chapter 2 presents a case study application of the ADP to nuclear fission reactor design. Through this case study, the ADP is explained in greater detail and efficient development of performance measures is addressed. It is demonstrated that the usefulness of the ADP can be preserved even when significant effort is not expended in developing performance measures.
The scale needed for ranking attributes is the subject of Chapter 3. This chapter explains the ranking process, develops the theory underling scale choice, presents a new type of
scale and then reports on the results of two experiments that test candidate scales.
Chapter 4 is built around another case study, this one related to a NASA project
designing payload handling systems for use on the Lunar surface. This project presented a true engineering scale study and so the chapter explains the use of the ADP in such an environment where decisions require participation from a large group on individuals.
In Chapter 5, the remaining issue of uncertainty propagation in long running computer codes is addressed. A new method based on orthogonal polynomial expansions is proposed. This method is compared to existing techniques in evaluating a the performance of a fission reactor system during a severe transient.
3 Risk-Informed Decision Making to Select the PSACS
Ultimate Heat Sink
As part of the Department of Energy's Nuclear Energy Research Initiative (NERI), the Department of Nuclear Science and Engineering at MIT has been studying 2400 MWth lead cooled and liquid-salt cooled fast reactors known as Flexible Conversion Ratio (FCR) reactors 0. The FCR reactors are so named as it is intended that, with minimal modifications, they will be able to operate at both a conversion ratio near zero to dispose of legacy waste, and near unity to support a closed fuel cycle. Study of these reactors indicates that the most severe transient they are likely to encounter is a station blackout, i.e., complete loss of offsite power and loss of emergency onsite ac power. To prevent core damage during such a transient, a passive decay heat removal system is desired.
To remove decay heat, FCR reactor designers developed an enhanced Reactor Vessel Auxiliary Cooling System (RVACS) similar to General Electric's S-PRISM design [3]. The RVACS is a passive safety system in that it does not require moving parts, external power, control signals or human actions to accomplish its function. The RVACS removes decay heat through the natural circulation of air over the reactor guard vessel. Further modeling indicated that, although the RVACS was sufficient for most transients, it could not maintain a peak clad temperature (PCT) below appropriate limits during a station blackout. Therefore, a supplementary decay heat removal system would be required. A number of options were considered for this supplementary system. Initially, it was proposed that the power conversion system (PCS) be relied upon to remove decay heat. This was advantageous because the PCS was already in place and would be self-powered, as the removal of decay heat would drive the turbine. This option was abandoned, however, as the design team believed it might have required that PCS and other balance of plant components be categorized as safety related, thereby significantly increasing their cost.
With the rejection of the PCS as a viable supplementary decay heat removal alternative during station blackout, two additional systems were proposed. Both were referred to as Passive Secondary Auxiliary Cooling Systems (PSACS), although they differed in the choice of ultimate heat sink. One system used air and the other water. Details are available in 0. Due to constrained time and resources, the team was only able to design one of these options in detail and so they needed to select an option to proceed without the benefit of prior study. In doing so, the team faced two challenges. They first needed to decide what metrics to use to compare these two options and then they needed to use what little information was available to evaluate the metrics. As with the consideration of the PCS, an informal decision-making process was attempted. In this case, however, the process was unable to choose between the two systems. As a result, the team turned to a formal decision-making process known as the Analytic-Deliberative Process (ADP) originally recommended in [4]. ADP is a process that helps stakeholders make risk-informed decisions. It has been used at MIT in a variety of decision-making problems
[5][6][7]. What follows describes the application of ADP to the selection of the PSACS
ultimate heat sink.
3.1
Risk-Informed Decision Making and the ADP
Decision analysis and a variety of risk-informed decision making processes have been studied extensively since the mid 1960s. In its most basic formulation, decision analysis provides the basis for making choices between competing alternatives in the face of uncertainty [8]. The type of decision problem that is of concern in this paper has two important characteristics. It is a multi-attribute or multi-criteria problem in which the benefits of any one decision alternative must be judged by its impact on a number of different objectives [9]. It also involves a significant amount of uncertainty that must be characterized by experts whose viewpoints must then be synthesized [10]. As such, the risk-informed decision-making process should bring together the decision maker, those who have a stake in the outcome of the decision (stakeholders), experts who can characterize available options, and an analyst who can gather information and facilitate
discussion. It should assist these individuals in systematically identifying the objectives of making a particular decision and defining the performance of options in the context of these objectives. The process must aggregate both objective and subjective information while keeping track of uncertainty. It should combine analytical methods with a
deliberation that scrutinizes the analytical results and it should produce a ranking of decision options and a detailed understanding of why certain options outperform others. The ADP is such a process. It consists of two parts [4]:
1. Analysis, which uses rigorous, replicable methods, evaluated under the agreed
protocols of an expert community -such as those of disciplines in the natural, social, or decision sciences, as well as mathematics, logic, and law -to arrive at answers to factual questions.
2. Deliberation, which is any formal or informal process for communication and collective consideration of issues.
As shown in Figure 3-1, the ADP begins with the analyst identifying the decision maker (DM) and stakeholders (SHs) and leading this group in framing a specific decision problem and defining the context in which the decision is to be made. For the purposes of this study, the FCR reactor (FCRR) design team is selecting a supplementary decay heat removal system to maintain PCT below a limiting value during a station blackout. The DM is a senior member of the design team and the SHs are the five remaining members of the team, each of whom also serves as an expert on a different area of the design. The analyst must ensure that these definitions and roles are clearly specified at the beginning of the process and that all individual understand their role and agree to participate in the process as appropriate. This is critical so as to guarantee that all subsequent analysis and risk characterization is done in the context of the specific decision problem at hand and that it all be directed at answering the specific questions that are of interest to the DM and SHs.
Identify Assess
Options Performance
O Measures
Rank Options
and DecideFigure 3-1: Steps in the Analytic-Deliberative Process
Once the DM and SHs specify the decision problem and the context in which it is being addressed, they must identify all of the elements that each individual believes are important to consider in evaluating decision options. Forming an Objectives Hierarchy captures this information and the hierarchy for the PSACS problem is shown in Figure
3-2 and Table 3-1. At the top of the hierarchy is the goal, i.e., a broad statement intended
to communicate the overall purpose for making the decision. It reiterates the context in which participants will determine what other elements belong in the objectives hierarchy. The analyst is responsible for making sure that all SHs and the DM agree on the goal.
Figure 3-2: Objectives Hierarchy and Performance Measures
Table 3-1: Definitions for PSACS Objectives Hierarchy
ATTRIBUTES
WI Safe and reliable for normal operations w2 Safe and reliable during SBO
w3 Accessible w4 Simple w5 Robust w6 Designable w7 Economical QPMs
vi Results of spurious actuation v2 Confidence in PCT
v3 S-CO2 circulation performance v4 Ability to inspect
vs Ability to maintain
v6 Number of active SSCs
v7 Margin to required energy removal rate
v8 Resilience against CCFs
v9 Model confidence v10 Degree of effort required v1 I Component costs
Objectives are the second tier in the hierarchy. They are the broad categories of elements that the DM and SHs feel must be achieved in order for a decision option to meet the goal. These broad objectives may be further divided into sub-objectives as needed. For this decision problem, the DM and the SHs agreed on two objectives, that the PSACS
Formulate Proble
Develop Objectives Hierarchy
SSCs: Structures, Systems and Components
CCFs: Common Cause Failures SBO: Station Blackout
must have a net benefit on overall reactor safety and that its inherent design characteristics be favorable. No sub-objectives were needed.
Below the objectives are the attributes. Attributes are the largest set of elements between which a DM or SH is indifferent' and they describe how to achieve the objectives that lie below. It is helpful to think of attributes as the most detailed level of sub-objectives the DM or SH wishes to consider. Here, seven attributes have been identified, as shown in Figure 3-2.
With input from the DM and the SHs, the analyst will attempt to create a consensus hierarchy and prepare a set of definitions for each objective and attribute. While the DM and SHs need not agree on the structure of the hierarchy, it greatly simplifies the analysis if consensus can be reached. In the case of the PSACS decision problem, the analyst was able to achieve consensus.
It is appropriate to add one qualification. In constructing objective's hierarchies for system design problems, the analyst must expect that the DM and SHs may not yet have sufficient information to specify all attributes that will eventually be determined to be relevant to the decision problem. That is, the initial hierarchy may later be seen to be incomplete. As such, the analyst should stress that results obtained reflect only the current state of knowledge and he should update the hierarchy if new information warrants. Due to the limited scope of this study, no such updating was done for the
PSACS decision problem.
The final tier in the objectives hierarchy is made up by the quantifiable performance measures (QPMs). QPMs are developed by first examining the attributes and determining a set of appropriate metrics to measure each. For example, the attribute Simple is measured by one metric, the number of active structures, systems and
components (SSCs) required by a particular PSACS design option. Once these metrics are established, the range of performance that any reasonable PSACS option might have is determined and then the relative desirability of different points in this range is
assessed. This information is captured in a value function that takes on numbers between zero, for the least desirable performance level, and unity, for the most desirable [11]. The range of performance levels and the corresponding values form a constructed scale, as shown in Table 3-2. The constructed scale can be continuous, with a unique desirability value for every possible performance level, or discrete, as in Table 3-2, with one value corresponding to a range of possible levels. Constructed scales allow any metric to be measured in terms of a common unit and they capture risk aversion to different levels of performance.
1 As an example, if a participant wants to minimize total system cost and does not care if these are capital or operating costs, then we say this individual is indifferent between capital and operating costs. Total cost is therefore an attribute. If, however, a participant thought it was more important to minimize capital costs even though this could lead to higher operating costs, then he or she is not indifferent between the two. Total cost would become an objective or sub-objective and capital and operating costs would each be their own attribute.
Table 3-2: Constructed Scale for Number of SSCs
Performance Level Value
0 1
1-3 0.3
3 or more 0
A metric and its constructed scale form a QPM. QPMs can be based on quantitative
metrics, such as the number of kg, or qualitative ones, such as a subjective understanding of a degree of complexity. They must, however, be metrics for which a constructed scale can be developed. In cases where more than one QPM is used to evaluate a single
attribute, QPMs are equally weighted to lead to a single score for the attribute.
Appendix I -PSACS QPM, presents the'constructed scales for the eleven QPMs
considered in evaluating the two different PSACS ultimate heat sink options. To accelerate the elicitation process for the QPMs, the DM and the SHs were only asked to define the upper and lower bounds of the value function and not to specify a complete set of intermediate values. Intermediate values would be added in step four of the ADP as necessary to score individual decision options. This approach saved considerable time in developing QPMs, but it still allowed for an open discussion and exchange of information between the participants.
In the context of the QPMs, the DM and the SHs must now determine how relatively important each attribute is to achieving the overall goal. To capture these preferences, the analyst conducts an elicitation exercise using a pairwise comparison process based on the Analytic Hierarchy Process (AHP) [12]. AHP requires each SH and DM to make a series of pairwise comparisons between attributes, and then objectives, stating which of the pair is more important to achieving the goal and then how much more important. The constructed scales are critical in providing the necessary context to make these
comparisons. As an example, in the absence of context, if an individual is asked to compare safety with a monetary attribute, he or she will likely report that maintaining safety is extremely more important. The constructed scale, however, may reveal that the maximum consequences to safety are minor while the maximum consequences to the monetary attribute are extreme. Within this context, the individual may weigh the two attributes differently.
The pairwise comparison process results in a set of person-specific weights, wi, for the attributes that indicate the relative importance of attribute i in the overall context of the decision problem. The weights across the entire set of attributes sum to unity. Consider Figure 3-3, in which each bar indicates the weight that the DM or a SH assigned to a particular attribute. The figure shows that the weights assigned to each attribute can differ significantly between individuals. As these weights may reveal fundamental differences in the way individuals perceive a decision problem, no attempt is made to reach consensus weights at this stage.