Crowdsourcing Corporate Water Data:
A Validity Test of a Pilot Survey Instrument to Map Public Water
Management Related Risk Worldwide
By
Cristina Alene Logg MCP
Massachusetts Institute of Technology Cambridge, MA (2018)
Submitted to the Department of Urban Studies and Planning in partial fulfillment of the requirements for the degree of
Master in City Planning at the
MASSACHUSETI'S INSTITUTE OF TECHNOLOGY June 2018
2018 Cristina Alene Logg. All Rights Reserved
The author hereby grants to MIT the permission to reproduce and to distribute publicly paper and electronic copies of the thesis document in whole or in part in any medium now known
or hereafter created.
Author Department
Signature redacted
of Urban Studie - WP(anning May 23, 2018
Certified by Accepted by MASSACHUSETTS INSTITUTE OF TECHNOLOGY JUN
18 2018
LIBRARIES
Signature redacted
Professor Lawrence Sus4kind Thesis Supervisor Department of Urban Studies and Planning
Signature redacted
Professof of the Ifractice, Ceasar McDowell Chair, MCP Committee Department of Urban Studies and Planning 1
Crowdsourcing Corporate Water Data:
A Validity Test of a Pilot Survey Instrument to Map Public Water
Management Related Risk Worldwide
By
Cristina Alene Logg
Submitted to the Department of Urban Studies and Planning on May 23, 2018, in Partial Fulfillment of the Requirements
for the Degree of Master in City Planning
As water crises continue to occur globally, it would be invaluable to have easy-to-access, comparable and localized data on public water management worldwide; unfortunately such information is not available from a single public source (Koelbel et al. 2018). Information on water risk that does exist does not cover public water management at a granularity that would be useful to industrial facilities and local utilities. Even at a national or state-level, datasets on water risk are woefully incomplete. Given these gaps, the World Resources Institute (WRI) and the Massachusetts Institute of Technology Sloan Sustainability Initiative (MIT-SSI) are seeking to crowdsource multinational companies' information on public water management and water risk to see whether a reliable, globally comparable, and centralized geodatabase can be developed by pooling information that private actors use to map and identify local water risk and public water management efforts essential to their decision-making.
WRI and MIT-SSI began an initial pilot study in 2017 with a survey of six multinational
companies and 41 of their industrial processing and manufacturing facilities in 14
countries. These corporations were selected because they operate facilities globally, pursue extensive internal environmental sustainability work, and regularly collect data on water use and discharge at the site level. The initial pilot survey instrument covered
(i) the availability of quantified, public information on water availability, demand, and quality; (2) the state of the relevant infrastructure including reliability of water supply and availability of wastewater treatment services; (3) existing water access regulations and consistency of regulatory enforcement; and (4) crisis response.
I was asked to analyze these survey responses along with the results of follow-up interviews conducted in coordination with site visits to a selection of the survey respondents from California and India. I set out to determine whether the risk
indicators used by the WRI/MIT-SSI partnership accurately portray on-the-ground public water management circumstances at the facility level for companies operating in both low and high-risk areas. I also tried to determine whether the water risk indicators developed by WRI/MIT-SSI are comparable, credible, and relevant across a range of manufacturing and industrial processing sites.
In order to assess the validity of the initial survey instrument and the data it generated, I completed 27 interviews of 32 academics, public water managers, corporate facility managers, and individuals associated with non-profit organizations engaged in water and sanitation. I also visited two facilities in Southern California and Maharashtra, India while following up with six facility and environmental managers who completed the initial surveys in these regions.
I found the pilot study responses generally reflected local public water risk management conditions and were trusted and found credible by all stakeholder groups interviewed. Furthermore, officials and stakeholders engaged in public water management, advocacy, and oversight thought the data generated by the survey instrument would be useful in a variety of ways as long as enough data points are provided and anonymity of corporate respondents is maintained. Unless responses can remain anonymous, there were fears that particular sites might be subject to litigation or regulatory retaliation. Facility managers said that they were able to answer all the survey questions based on what they already knew from their facilities' daily operations and from information regularly collected for internal environmental reporting and efficiency efforts. In my view, the responses appeared reasonably accurate and they were generated in a timely manner. Furthermore, collecting this information from corporate actors is not only feasible but is preferred in some contexts.
My recommendations for improving the survey instrument emphasize the need to expand the scope of the survey while remaining cognizant of the need to keep the instrument brief. This includes collecting data on the availability of recycled and reclaimed water and addressing the existence of regulations that require the use and treatment of wastewater on-site. Furthermore, concerns about whether the survey
respondent is qualified to answer the questions regularly arose; therefore, an additional recommendation is to provide a question to validate whether the respondent works on-site or has operating knowledge of water management in the region. WRI and the Pacific
Institute, who will be superseding MIT-SSI in the project as it moves forward, should collaborate with additional institutional and corporate partners to ensure that more data points are collected globally as this will enhance the global credibility of survey findings.
Thesis Supervisor: Lawrence Susskind
Title: Professor of Urban Studies & Planning
Acknowledgements
Cristina is thankful to have the support and mentorship of Professor Larry Susskind. His deep insight into the world of water and his guidance over the last year has been essential to the development of this
thesis.
MIT Sloan Sustainability Initiative's generousfinancial support made the completion of thefield visits and interviews possible. Cristina
will continue to encourage the mission of the MIT Sloan Sustainability Initiative as it leads the charge on developing thoughtful leadership on
sustainability across the business world.
None of this would have been possible without the vision of Julian K6lbel and Cindy Noe, the individuals behind the entire project and
lifelong advocates of sustainable water management and research. Colin Strong and Paul Reig's professional expertise has been
indispensable, as this entire project has moved
from vision into piloting
then validation and soon into implementation.
Cristina Logg is eternally gratefulfor the love and encouragement from
Tabfe of (ontent
Chapter i: Introduction ... 6
Research Question & Purpose ... 7
Project & Client Background ... 7
Key Definitions & Measurement Approach ... 9
Existing Data Gap in Water Risk & Public Water Management... 13
Pilot Study Survey Instrument Creation & Deployment ... 15
Chapter 2:Mehd oy...7
Site Identification & Visits ... 17
Interviewing Procedure & Goals ... 19
Chapter 3: Descriptive Statistics of Pilot Study Results ... 22
Location & Service Area ... 23
Inform ation Availability ... 25
W ater Infrastructure ... 29
Water Access Regulations ...---...-..---... 30
Crisis Response ...---...---... 32
Breakdown of Accuracy Analysis & Recommendation...33
Chapter 4: Survey Validation via Coded Interview Analysis ...--- 35
Interview Stakeholder Classes and Average Number of Years in Water.. -.. 36
Issues Scheduling Interviews With Government Officials in India...---...38
Analysis of Coded Interviews ... . ... ... 39
Chapter 5: Survey Validation via Geographic Case Studies... 50
Case Study 1: Los Angeles Metropolitan Area & San Diego .---.----... 50
Case Study 2: Mumbai & Maharashtra State... ...- 56
Comparing Maharashtra & California...60
Chapter 6: Recommendations for Updating the Survey Instrument..61
Summary of Key Findings on the Original Survey Instrument from Data Review, Interviews & Site Visits ... 61
Survey Limitations: Balancing Brevity, Comprehensiveness & Non-Sensitivity. 63 Key Shortcomings Identified in the Survey Instrument ... 63
Updated Survey Mechanism: A Review of Recommendations & Insights... 71
A Discussion on Substantive Survey Changes Not Recommended ... 83
Chapter 7: Limitations & Conclusion... ... ... ... 87
Bridging the Schism between Corporations & PWM & Other Findings ... 87
Limitations of the Validation Methodology & This Research ... 87
Key Findings & Conclusion ... 88
Appendix 1: Original Survey Instrument ... 91
Appendix 2: Introductory Email--.---...--... 95
Appendix 3: Interview Question Base...96
Appendix 4: Final Recommended Survey Instrument ... 99
Appendix 5: Draft Comprehensive Survey Instrument ... 111 Bibliography ... 128eoos 12
Chapter
1-
Jntrodietion
A significant proportion of the world's developing urban centers is directly or indirectly supported by private industrial production. For many of these cities, there is often a lack of a sufficient quantity and quality of clean freshwater to meet industrial, agricultural, ecosystem, and local population needs - resulting in water scarcity, stress, and risk. A key component of water risk experienced by urban centers is poor water management by individuals, corporations, and government authorities, which can exacerbate existing bleak hydrological conditions.
At this time, localized (i.e. not country or state-level) measures of public water
management, which is defined later in this thesis as "the ability of local institutions to manage water resources in such a way that water needs are met with a sustainably managed supply and water risk is limited," are unavailable in a comparable and easy-to-access format. A detailed analysis of the current data gap in existing public water
management related indices and metrics can be found in the section entitled SVe M. & , 0- -r - Appro4i #. As such, for corporations that operate
industrial production facilities in areas at risk for water-related issues, there are no functional and comparable water risk metrics available to adequately evaluate and compare the risk associated with public water management to and from industrial sites at the facility level. Yet, major multinational corporations often collect water
management related data as a matter of due course in their operations, often for integrated reporting and other environmental-related reporting initiatives, and/or to meet local, state or national government regulations.
The World Resources Institute (WRI) and the MIT Sloan Sustainability Initiative (MIT-SSI) have developed a survey instrument meant to populate a dataset capable of
assessing water risk from public water management at an individual site level. The indicators developed by WRI and MIT-SSI fall within four topical areas: (1) access to public information on water management; (2) the state of existing water infrastructure in the region; (3) existing water access regulations and consistency of regulatory
enforcement; and, (4) the mechanisms utilized by public water managers to respond to crisis situations.
The long-term goal of this thesis research is to provide an academic and practical critique of and support for the above proposed water risk indicator areas and the associated data collection instrument. This thesis also seeks to address an entire audience largely ignored by public water managers: corporate actors.
The WRI and MIT-SSI data collection effort and the subsequent development of a publicly available geodatabase will drive the advancement of both corporate water risk management and public water management as well as bridge the schism between water
1 Both the Global Reporting Initiative (GRI) and the Carbon Disclosure Project (CDP) include water-related reporting in their developed corporate disclosure guidelines. A comparison of these commonly accepted reporting styles can be found here: https://www.globalreporting.org/resourcelibrara/GRI-G4-CDP-2016-Water-Linkage-Document.Ddf
managers and corporate users. The geodatabase will allow for comparable metrics to be collected and analyzed across varying geographic, political, and economic contexts, promoting the incorporation of local conditions into corporate water risk measurement and management. It will also provide an additional trusted data source that non-profit organizations, academics, and public water managers can use to assess the existing status of public water management at a very localized level.
Researchb
Qu
estion & Pu 'pOsAs a client-linked thesis, this thesis takes the form of a published report to WRI and MIT-SSI and will test the validity of the proposed public water risk instrument. In order to do so, the following research questions directed how the research was structured, conducted, and presented:
To what extent are the proposed WRI public water management risk indicators indicative ofpublic water management at the facility level for companies operating in areas ofpotential water risk? Also, are the proposed water risk indicators and their associated survey questions
comparable,feasible, credible, non-sensitive and relevant across all potential sites of analysis?
In order to answer this, I will also need to explore the following questions:
" Do the proposed water risk indicators adequately and comprehensively measure the public water management environment in which facilities are located?
o Similarly, are any areas of public water management not covered in the
survey instrument?
o What changes should be incorporated into the indicators prior to the
survey instrument's finalization?
" Is the information collected through the survey instrument useful to and determined credible by a variety of key stakeholders?
- To what level did corporate partners provide information during the pilot study accurately?
" Is the completion of the survey instrument an undue burden on survey respondents, is the information collected non-sensitive in nature, and do the respondents have the knowledge to be able to answer the survey's questions?
Project & Cliert Rackgroind
With offices and research in over 50 countries, the World Resources Institute (WRI) seeks to understand and drive wise natural resource management across the globe. Under its Water program, WRI maintains the Aqueduct Project,2 which uses up-to-date information to develop a global water risk map. Recently WRI has sought to explore improving the WRI Aqueduct Water Risk Atlas to include indicators that assess the public management of water resources at the local level.
2 More information on the Aqueduct Project can be found here:
Originally intended to provide country and river basin rankings of water risk and stress, WRI's Aqueduct Water Risk Atlas maintains both current conditions and future
predictions for water risk based on 12 indicators (Gassert et al. 2014). These indicators fall within three sub-areas of water risk: physical risk due to inadequate quantity, physical risk due to inadequate quality, and regulatory and reputation risk as seen through media coverage, access to water, and threatened amphibians (Gassert et al. 2014). Within these indicators, there is no measure of public water management at the local level as the level of analysis used is the water catchment area.
This is where two individuals from the MIT Sloan Sustainability Initiative (MIT-SSI) became involved. Founded in 2006 at the MIT Sloan School of Business, the
Sustainability Initiative produces and highlights degree coursework around
sustainability, incorporates sustainability topics and courses into executive education, and conducts innovative projects that engage researchers and students across the institute through partnerships with businesses, governments, and other organizations (MIT Sloan School of Business n.d.).
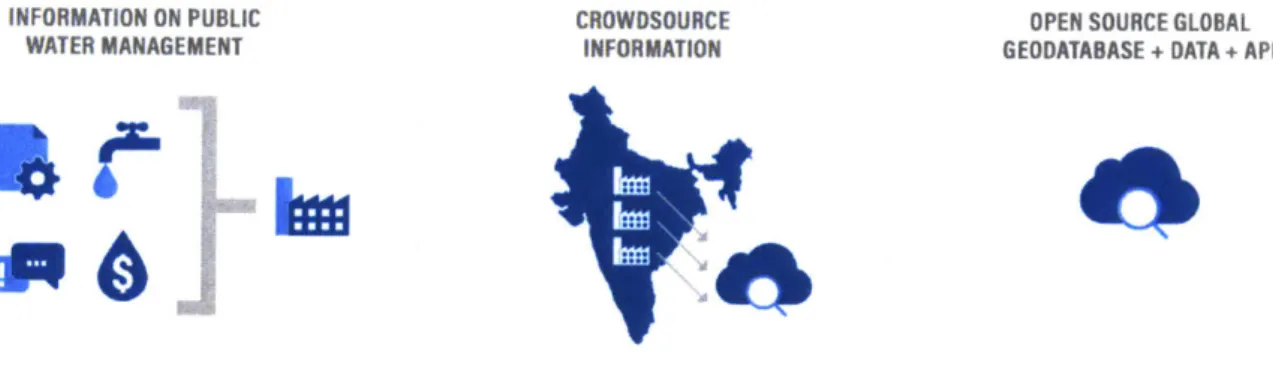
Coordinating together, a team from MIT-SSI and WRI has sought to crowdsource corporate water management information with the goal of providing a localized
snapshot of public water management at the local level, as detailed in the figure below.4 Together, researchers affiliated with MIT-SSI collaborated with the WRI Aqueduct team to draft an initial pilot study to develop and deploy a survey mechanism meant to assess public water management at the facility/site level for factories and manufacturing
facilities operated by major multinational corporations.
INFORMATION ON PUBLIC CROWDSOURCE OPEN SOURCE GLOBAL
WATER MANAGEMENT INFORMATION GEODATABASE + DATA + API
Note Corporate water users have information on public water management and collect tis in standaized faciity water risk assessments. This infornation is crowdsourced from a large number of facilities across a geography and (after anonymizaton) is made accessible in an open-source geodtabase
Figure 1: Mapping Public Water Management Data Collection Mechanism (Kolbel et al. 2018)
Through asking major corporate actors to observe public water management at sites that act as industrial water users, the project's ultimate goal is to crowdsource corporate
3 This team includes Julian Kolbel (MIT), Ross Hamilton (PI), Paul Reig (WRI), Colin Strong (WRI), and
Cindy Noe (MIT).
4 The initial request for corporate partnerships can be found here:
information to produce an open source, global geodatabase containing anonymized information related to public water management at a very localized level. This local data can then be used to inform decision makers across a variety of stakeholder groups. Detailed below is the ongoing Theory of Change for the project which argues that this crowdsourced corporate data, once mapped and indexed, will improve public water management through its use by members of civil society, financial data providers, governments at the local and national level, financing institutions, companies themselves, and also to public water management bodies (Kb1bel et al. 2018).
Civil Society liltNATIONAL GovernmentsILOCAL
PUBLIC WATER MANAGEMENT
Financial Data EVEOPMENT BAN I si TORs Information Infrastructure Regulations Crisis Response
Companies
ote: The global geodatabase would drive a variety of users to influence and imprwm public water management on a localor utility level Rather than ofer a fied 0 of act iies that actors could take, this Technical Note documents the ecosystem of actors at play and focuses primarily on companies, as they are the primary data collection mechanisms.
Figure 2: Mapping Public Water Management Theory of Change (Ko1bel et al. 2018)
Following the completion of the pilot study, the Pacific Institute (PI) became engaged, as MIT-SSI will not be participating as the next stage - data collection from
5,000-10,000 corporate facilities - moves forward. Categorizing itself as a "global water think
tank", the PI works with governments, communities, and companies to develop and promote sustainable water policies and help drive the United Nation's CEO Water Mandate (Pacific Institute n.d.). As PI will be taking the place of MIT-SSI within the Mapping Public Water Management project, even though this report is directed to MIT-SSI and WRI, I will be including PI in the language below, as appropriate.
Key Definitions & Measurement Approach
Note: This section of this thesis report was written in coordination with MIT, WRI-SSI, and PI. Its authors and contributors include Julian K6lbel (MIT), Ross Hamilton (PI), Paul Reig (WRI), Cristina Logg (MIT), Colin Strong (WRI), and Cindy Noe (MIT).
There are a variety of definitions of water management and water governance in use today (Araral & Wang 2013). To integrate this work in a useful way, WRI, MIT-SSI, and
PI provide its own definition of public water management, explains how it relates to existing definitions, and provides transparency on how to interpret the resulting indicators.
Definition of Public Water Management
For the purposes of the Aqueduct Public Water Management Atlas, public water management (PWM) describes the ability of local institutions to manage water resources in such a way that water needs are met with a sustainably managed supply and water risk5 is limited. Sustainable management of water resources includes the ability to monitor the supply, demand and quality of water resources, the capability to build and maintain infrastructure to deliver and treat water, the ability to regulate water consumption and pollution, as well as the capacity to respond effectively to crisis
situations.
Relationship with Other Definitions and Concepts
This definition is very close to the World Bank definition of water resource
management.6 However, rather than focusing on the processes of water management, we focus on abilities of water managers. The abilities of water managers are easily observed by their customers, in particular the industrial customers, who rely heavily on a sustained supply of high quality water and wastewater services in order to function. These customers are at the center of our measurement methodology.
Our definition contrasts with the concept of integrated water resource
management (IWRM)7 in the sense that PWM is focused exclusively on water and does not take into account the linkages with related resources such as land and energy. While these linkages are extremely important, the scope of IWRM is in many cases too wide to be practically useful (Biswas 2008). Therefore, we focus exclusively and directly on water management.
5 Water Risk: Water risk is "the possibility of an entity experiencing a water-related challenge (e.g.,
water scarcity, water stress, flooding, infrastructure decay, drought)... Water risks can be grouped into three general categories: Physical... Regulatory... [and] Reputational... Water risk for businesses
specifically is also sometimes divided into two categories... Risk due to company operations, products, and services... [and] Risk due to basin conditions" (Morrison et al. 2014).
6 "Water Resources Management (WRM) is the process of planning, developing, and managing water resources, in terms of both water quantity and quality, across all water uses. It includes the institutions, infrastructure, incentives, and information systems that support and guide water management. Water resources management seeks to harness the benefits of water by ensuring there is sufficient water of adequate quality for drinking water and sanitation services, food production, energy generation, inland water transport, and water-based recreational, as well as sustaining healthy water-dependent ecosystems and protecting the aesthetic and spiritual values of lakes, rivers, and estuaries. Water resource
management also entails managing water-related risks, including floods, drought, and contamination. The complexity of relationships between water and households, economies, and ecosystems, requires integrated management that accounts for the synergies and tradeoffs of water's great number of uses and values" (World Bank n.d.).
7 Integrated water resource management is "a process which promotes the coordinated
development and management of water, land and related resources, in order to maximize the resultant economic and social welfare in an equitable manner without compromising the sustainability of vital ecosystems" (Global Water Partnership n.d.).
This concept contrasts with water governance8 in the sense that PWM focuses on
relatively narrow practical aspects of providing a sustainable supply at a local level rather than the entire range of political institutions, processes, and stakeholders related to water. PWM can be seen as a sub-element of water governance, focusing on technical aspects around efficiency and control. In reference to the OECD principles for water governance, PWM belongs in the effectiveness dimension, where there are overlaps with Principle 5 (data & information) and Principle 7 (regulatory frameworks).
Our Measurement Approach
Our measurement approach is guided by two key considerations. First, we measure PWM by anonymously surveying industrial water users in a confidential manner that provides anonymity of responses. This user perspective, assuming confidentiality and anonymity, comes with the strength that water users have no conflict of interest when providing information about the quality of services the facilities receive. This strength is accompanied by the limitation that water users only have limited insight into the
processes of water management. Therefore, our measurement of PWM is limited to those elements that industrial water users can reliably observe due to the essential nature of water and wastewater services to facility operations.
Second, we measure PWM by observing a selected number of proxies that provide a robust and comparable indication of PWM abilities. The indicators we seek to measure fall within four topical areas:
1. Access to public information on water management 2. The state of existing water infrastructure in the region
3. Existing water access regulations and consistency of regulatory enforcement 4. The mechanisms utilized by public water managers to respond to crisis situations We do not seek to understand in detail how PWM is conducted in a given location; the intention is to measure whether certain fundamental PWM abilities are demonstrated. For example, the goal is not to understand how exactly a water allocation scheme is working. Instead, the goal is to observe whether there is a water allocation system in place and to gauge its level of effectiveness.
Building on these considerations, indicators were selected based on six design criteria that take into account that the data is collected from water users and is intended to serve as a robust comparable proxy for PWM.
- Relevant: Indicators must measure issues that have clear implications for public water management and, thus, for water-related business risk.
- Feasible: Indicators must be populated with information that company staff already possess or can easily obtain.
- Credible: Indicators must be credible for all stakeholders, despite being collected and shared by a company, and must rely on objective and verifiable data.
8 "Water governance refers to the range of political, social, economic and administrative systems that
are in place to develop and manage water resources, and the delivery of water services, at different levels of society" (Rogers et al. 2003).
- Comparable: Indicator values must be comparable across political and hydrological boundaries.
* Actionable: Indicators must refer to specific aspects of public water
management that can be modified and improved-given the necessary political will and funding are in place.
- Non-Company Specific: Indicators must measure critical aspects of public water management in the catchment in which a facility operates (i.e., not company performance or management practices), allowing companies to share the data freely, and the public to benefit from them.
Interpretation of the Indicators
Our assessment of PWM does not include a direct assessment of water security9 or catchment sustainability. Nevertheless, we see these as the long-term goals of water management and water governance. Our evaluation of PWM includes practical pre-requisites to achieve those goals. For example, information about water use and consumption and a functioning water allocation system are both prerequisites to maintain a catchment's water balance. Functioning infrastructure and effective crisis response are prerequisites to ensure consistent access to water for all users. As such, good PWM according to our definition is a necessary, but not a sufficient condition to reach the goals of water management and governance. Gaps in PWM, according to our definition, mean that the achievement of consistent and sufficient access to water resources and catchment sustainability is at risk.
Limitations
Inevitably, our definition and approach harbor some limitations, which we want to make transparent to avoid over-interpretation of the collected data. A number of important aspects related to water management are not included in the scope of PWM as defined:
- Equitable allocation of water resources (we want to know whether the provider is able to achieve any kind of allocation, not whether that allocation is fair,
equitable, etc.).
- Integration with other resource governance tasks, such as land and energy (e.g., the water food energy nexus).
In addition, our measurement approach does not consider a number of aspects for reasons of feasibility:
- Financial viability of water services: Water users do not generally have insight into the internal finances of water service providers.
- Flood Defense: While technically related to PWM, flood defense and
preparedness is a vast topic on its own that was left out for reasons of feasibility.
9 "Water security is the goal of water resources management. For a rapidly growing and urbanizing global population, against a backdrop of increasing climatic and non-climatic uncertainties, it is not possible to 'predict and plan' a single path to water security. To strengthen water security we need to build capacity, adaptability, and resilience for the future planning and management of water resources" (World Bank
Finally, our current data collection methodology is focused on gathering data from industrial water users. Focusing on this type of users has advantages in terms of scaling, but has limitations because industrial water users are not in a position to comment on how other types of users are regulated and served. Future iterations of this methodology are envisioned to include:
" Domestic users: Surveying domestic users, particularly vulnerable domestic users, could supply important information regarding the coverage of WASH services. This would supply important complementary data pertaining to the human right to water and SDG 6.
- Agricultural water use: Surveying agricultural users, for example by expanding the survey to the supply chains of industrial users, could supply important complementary information regarding the supply security and regulations concerning consumption and pollution in the agricultural sector.
FxistiData G (p in Water Risl< R Pihlic Water Mzanagement
The majority of the literature surrounding corporate water risk, particularly in relation to the availability of water for corporate activities and the impact these activities have upon local public water access, is from 2010 onwards. In 2010, the UNEP commissioned
a report from the Pacific Institute "to help the private sector better understand and address its impacts on and management of water resources" (Morrison, Schulte, &
Schenck 2010). Following this, additional efforts on defining and measuring water risk to and due to corporate activities were undertaken by Ceres (2012), the Carbon
Disclosure Project (2017), the World Wildlife Fund (2016), and the CEO Water Mandate (2013). These efforts are augmented by the UNEP's "User's Guide on Assessing Water Governance" which provides an 8-step assessment process for filling in a gap in the practice - data collection, assessment, and monitoring of water governance by government actors (Jacobson et al. 2013).
Additionally, in 2015 the OECD Water Governance Initiative published an inventory of
"Water Governance Indicators and Measurement Frameworks." This inventory provided brief descriptions of various methods attempted to measure and document water
governance around the world, including straight water governance indicators, water assessments that include governance variables, environmental indicators with water variables, river basin level performance indicators, existing databases with information on water management and related figures, guidelines surrounding water governance, maps assessing water governance, and existing assessment tools that can be used to assess aspects of water governance (OECD Water Governance Initiative 2015).
The five maps detailed within the OECD report are as follows: Aqueduct Water Risk Framework World Resources Institute (WRI)I0
12 Indicators in 3 Categories Basin Leveal of Water Risk (Global) Environmental World Resources 75 Legal Indicators & 24 Country
Democracy Institute (WRI) & The Supplemental Indicators Level (70
Index Access Initiative" Countries)
Environmental 24 Indicators on Country
Performance Yale University2 Environmental Health & Level (18o
Index Ecosystem Vitality Countries)
Water Brazilian National 7 Indicator Areas on Staffing, State Level Management Water Agency (ANA)13 Agency Presence & Water (Brazil
Map Management Structure Only)
Water Risk World Wildlife Basin & Company Level Risk Basin Level
Filter Foundation (WWF)14 Indicators (Global)
Overall, the closest project in terms of scope and depth of granularity to the proposed WRI/MIT-SSI Geodatabase is the WWF Water Risk Filter project. Since going live in
2012, the Water Risk Filter has grown to encompass company-collected water related
data that would have a direct financial impact on the survey user. Currently in its fourth iteration and soon to enter its fifth, the Water Risk Filter allows for localized
interpretation of existing and company-provided data for a specific facility/site location. Company data is collected through the use of the online mapping and analysis tool, which can then be incorporated with the data maintained by WWF.
The gap the WWF Water Risk Filter seeks to fill is similar to that of WRI/MIT-SSI: providing an easy means to collect data on water management at a local level and supporting the comparable analysis and assessment of such data between urban sites. Beyond this, the WRI/MIT-SSI/PI survey instrument and future geodatabase also seeks to develop a monitoring framework for corporate actors to implement to reduce the risk to their facilities and operations and for utility providers to assess perceptions on their operation.
10 The World Resources Institute Aqueduct Map can be accessed here:
http://www.wri.org/applications/maps/aqueduct-atlas
11 A Technical Note detailing the Environmental Democracy Index can be accessed here:
http://www.environmentaldemocracyindex.org/sites/default/files/files/EDI Technical%2oNote%2oFin
al%2o7 9 1,rpdf
12 The 2018 Environmental Performance Index Rankings can be accessed here:
https://epi.envirocenter.yale.edu/downloads/epi20l8policymakerssummaryvol.pdf
13 The Brazilian Government website (in Portuguese) detailing the Water Management Map for the country can be accessed here: http://progestao.ana.gov.br
14 The World Wildlife Fund's Water Risk Filter utility can be accessed here:
Pilot Study Survey Instrument Creation & Deployment
Developed by team members from both WRI and MIT-SSI, the pilot study survey instrument was structured to solicit responses in four main indicator categories: (1) the availability of information, (2) state of water infrastructure, (3) water access regulations, and, (4) crisis response. The survey was purposefully designed to ask no questions that
would elicit sensitive corporate information as the survey was only meant to collect information that corporations already know and are willing to share in regards to water management practices in the areas where industrial and manufacturing facilities
operate. Following its initial drafting, the survey instrument was sent out to over 40 experts who operate in the field of water or corporate sustainability, including individuals from Ceres, Nestle, Novartis, Pacific Institute, and The Nature Conservancy.15
A copy of the original survey instrument as it was sent out for completion to corporate
facility managers can be found in .The
original survey instrument consisted of five parts: Part 1: Location & Area
- Facility Address or Geographic Coordinates
- Name ofArea
- Type ofArea
Part 2: Information Availability
- Availability of Information on Water Availability and Demand
- Availability of Information on Water Quality
Part 3: Water Infrastructure
- Number of Days with Intermittent Supply
- Wastewater Services Provisioning
Part 4: Water Access Regulations
- Types of Water Sources Used
" Water Access Regulations Per Source(s) Used
- Enforcement and Compliance with Water Regulations
Part 5: Crisis Response
- Has a Water Crisis Occurred?
- Mechanisms to Limit and Prioritize Access
- Success of Mechanisms during Water Crisis
After its finalization, the survey was sent to six corporate partners who have had longstanding relationships with either WRI or MIT-SSI. Due to the confidentiality
requirements highlighted by the survey instrument's initial cover page and agreement with the initial six corporate partners, the identities of the six companies which had facilities around the world fill out the survey instrument during the pilot study will not
15 A full list of experts consulted by WRI and MIT-SSI can be found on page 18 of the published Technical
be disclosed in this thesis. The participating company's industry and an assigned
identifier as seen in the chart below will be used to identify them throughout this thesis.
iuompany 1
Company 2 Pharmaceuticals/Biopharmaceuticals 8
Company 3 Food & Beverages 5 3
Company 4 Household Products 5 3
Company 5 Electronics & Equipment 3 1
Company 6 Food & Beverages 1 1
Survey responses were received in either paper form (via the hand completion of a printed PDF of the survey instrument) or by an online survey operated by MIT-SSI in the Qualtrics platform. A total of 41 complete responses from six companies and 14 countries were received between July and October, 2017. Preliminary statistics of the survey responses are found in
Chapter
2-Methodology
The research I conducted for this thesis consisted of a fieldwork-based validation of the data collected by the WRI/MIT-SSI pilot study on public water management through a series of site and community visits and interviews in one international and two domestic locations. The data and feedback collected during the fieldwork and interviews is then used to test the ability of the survey instrument to collect credible and accurate
information and to determine whether additional indicators and questions should be added to the instrument to improve its comprehensiveness.
Three separate but intertwined approaches were taken to conduct the pilot survey validation, which is presented in this thesis.
1. Verify survey responses to ensure accuracy of data provided by corporate
respondents through a physical review of all 41 completed surveys and provide a descriptive analysis of the pilot survey results. This verification of survey
responses and descriptive statistics can be found in
2. Independent quantitative and qualitative data collection at each selected site and
its associated local community through interviewing local academics, non-governmental organizations, public water management officials, and facility managers on the social, political, and economic aspects of local/regional public water management. A breakdown of interviews conducted and an analysis
derived from the quantitative coding of interviews can be found in
3. Analyze the differences in data collected between interviews, site visits, and the survey instrument to determine the credibility, comparability and feasibility of the proposed water management related risk indicators between geographically distinct and distant sites. The geographic case studies from India and California
can be found in - d
Site Jdentifiction & VisTjSP
Due to the complex nature of water management and the potential for political and economic development variation in responses across the globe, this field research had to include at least one non-United States site located within the a country considered a part of the developing world.
As such, sites visited were selected upon the following criteria:
- Contain two or more survey responses within a close geographic area. - Is in a region that has experienced some form of water stress.
- Has corporate partners willing to forward interview requests to facility managers who completed the pilot survey.
Russia
Figure 3: Pilot Study Locations Worldwide
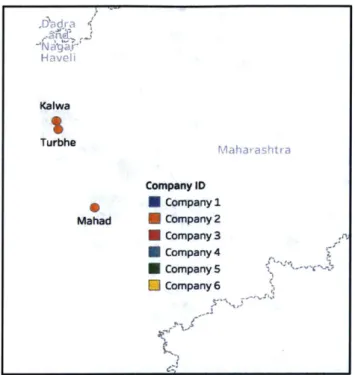
The initial survey instrument data filled out by facility managers, as seen in Figure 3, shows a series of clustered locations where companies operate facilities in regions of water risk. Upon consultation with WRI and MIT-SSI, I chose Los Angeles and San Diego (5 responses) as the domestic cities and Mumbai, Maharashtra (3 responses) as the international city to visit.
Figure 4: Pilot Study Locations in California
Canada 0 United Stat India Company 1O * ECompany 1 Company 2 *Company 3 * U Company 4 Company S Brazil Company 6 Australia San Bernardino 0 Ontario City of industry
Long Beach Company ID
*Company 1 * Company 2 * Company 3 Company 4 * Company 5 * Company 6 San Diego
tJYa dra '4 -'Na~~ Havel Kalwa Turbho Mahat ashtr a Company ID 0 Company 1 Mahad Company 2 Company 3 Company 4 Company 5 Company 6
Figure 5: Pilot Study Locations in Maharashtra, India
For each site location, I undertook a systematic approach to understanding national, regional, and local public water management and its associated risks to industry
through developing an understanding of national water policy and researching regional, local, and/or municipal water management. This included identifying public
organizations responsible for pollution control, water management, industrial economic development, wastewater services, and environmental protection.
Interviewing Procedure & Goals
I identified four key stakeholder groups to interview during the visits to the identified locations, as they could potentially provide different perspectives on the data collected by the survey instrument and the completeness of the instrument itself. They were as follows:
- National/International Corporate Actors & Local Facility Managers - Non-Profit Organizations & Local Community Actors
- Local/Regional/National Water Authorities - Academic Researchers
For each site visit location identified, I conducted a thorough search for
individuals/organizations to interview that fell within each of the identified stakeholder groups, except for corporate actors and facility managers who I also contacted through WRI or MIT-SSI channels. After identifying individuals or organizations to reach out to, I drafted an introductory email (a copy of which can be found Appendix 2:
Introductory Email), which I sent out to request an in-person, Skype, or telephone interview. Below you can find the names and/or organizations of individuals I
interviewed for this thesis research. These interviews, and the results derived from
them, should not be taken as a comprehensive representative sample of all stakeholders involved in water management at a local and national level.
California Interviews Conducted:
- George Courser, Sierra Club, San Diego Chapter
- John Amodeo, Former General Manager & Chief Engineer, Vista Irrigation District
- Dr. Edgar Tellez Foster, Senior Environmental Engineer, Chino Basin Water Master
- Staff (multiple), California State Water Resources Control Board " Staff (multiple), City of San Bernardino Water Board
- Russ Gibbon and Divian Contreras, San Diego Guaranteed Water for Industry Program
- Carolyn Schaffer, Metropolitan Water District of Southern California
- Valerie Fanning, Environmental Specialist & Compliance, Member UC Water Action Group, UC San Diego16
" Bob Tincher, Deputy General Manager, San Bernardino Valley Municipal Water District
- Dean Wang, Water Conservation Specialist, Long Beach Water District - Lauma Willis, Environmental Program Manager, Santa Ana Regional Water
Quality Control Board
- Peter Silva, Silva Silva International
- Erick Burres, Clean Water Team, Citizen Monitoring Program Manager - Jack Hawks, California Water Association
- Jocelyn Lu and Wendy Broley, WateReuse
" Pilot Study Survey Respondent, Company 1 (Site Visit) - Pilot Study Survey Respondent, Company 3
" Pilot Study Survey Respondent (Answered for All Sites), Company 5 India Interviews Conducted:
" Dr. Veena Khanduri, Executive Secretary, India Water Partnership " R. Natarajan, Gherzi Consulting
- Indra Kant Jha, EmergyEnviro, Technical Head at IIT Bombay
- Professor Pradip Kalbar, Center for Urban Science and Engineering, IIT Bombay
- Vijay Anadkat, WRI India - Sahana Goswami, WRI India - Sanket Bhale, WWF India
- Pilot Study Survey Respondent, Company 2 (Site Visit) - Pilot Study Survey Respondent, Company 2
A generic format of the interview questions asked to all interviewees from the four identified stakeholder parties can be found in Appendix :i. Interview Qestioi
Base. Interviews followed a standard format detailed below and lasted on average 40 minutes, with site visits to facilities lasting over 1 hour inclusive of the interview.
,6 As there was only one survey response in San Diego, I treated Valerie Fanning of UCSD as a facility manager who I then asked to complete the survey for UCSD's La Jolla facilities.
1. Introduction to the Project (3-5 Minutes)
2. Review of Consent to Participate Form (2 Minutes)
3. Current Role, Organization & History in Water Policy/Management (3-5
Minutes)
4. History of Water Management at the National Level (5-10 Minutes)
5. History of Water Management at the Local/Regional Level (5-10 Minutes) 6. Survey Instrument & Responses Review (5-10 Minutes)
a. Comments/Thoughts on Regional/Local Responses i. Accurate
ii. Trusted & Credible iii. Usable
b. Instrument Mechanism Overview - Recommendations for Improvement i. Comprehensive
ii. Clear & Understandable
7. Thoughts on the Future of Water Management (Regional/National/Local) & Potential Challenges Facing Industry (5 Minutes)
8. Additional Contacts/Recommendations on Organizations to Reach Out To (1 Minute)
Interview responses were analyzed in two separate ways. First, I coded the interviews and constructed brief descriptive statistics of the interviewees. This quantitative, coded interview analysis, conducted in Tableau and Excel, included analyzing the respondent's answers to my interview questions directly relating to the validation of the survey
instrument. A more detailed description of my interview process, a descriptive analysis of the results of my interviews, and external validation of perspectives provided by
interviewees
will
be explored in Cry d 0 ki N i ,L
Second, due to the geographically distinct nature of the interviews, with two thirds being conducted in California and the rest in India, I conducted a qualitative analysis of the interview responses through assessing the responses to questions about water
management in each locale and comparing these responses with formal sources of information found during desk research. This step involved double-checking many of the answers provided during the interviews with independent sources of data - all of which can be found in Ch.47 *pter 5: Stirv-v Vkiqidation v G 4rh Cae
Chapter
:
lDeseriptive Statistics
of
Pilot Study
Results
The majority of the pilot study responses were received from facilities operating in the United States, although the countries of India, China, and Spain each had three or more responses. Within the United States, five of the sites were in California, four in Texas, and the rest spread out individually in other states. In India, three of the sites were in Maharashtra state and the remaining sites in were in Andhra and Himachal Pradesh. As the charts detail below, the majority of survey respondents used delivered water, with 8o% or more sites in the United States and India using this resource. The second most common source of water was self-extracted groundwater, with approximately 58% of the sites globally using it, the majority being outside of the United States and India. Self-extracted surface water was the least used resource, with barely 7% of sites using this resource, the majority of those being outside of India and the United States.
# of Responses 41 17 5 19
# of Companies 6 4 2 5
% Delivered Water 68.3% 82.4% 8o.o% 52.6%
% Self-Extracted 58.5% 52.9% 20.0% 73-7% Groundwater % Self-Extracted 7.3% 5.9% 0.0% 10.5% Surface Water % Using Single 65.9% 58.8% 100.0% 63.2% Water Source
% Using Two Water 34.1% 41.2% 0.0% 36.8%
Sources
It is important to note that 65% of all pilot survey respondents use only a single water source, with the rest using two of the three. No single site self-reported the use of all three types of water within their operations. The most common combination of water sources used was self-extracted groundwater and delivered water, as 30% of all sites used this combination of water resources. Only two sites used delivered water and self-extracted surface water and no sites used both self-self-extracted surface water and
groundwater.
Location & Service Area
The first section of the survey mechanism asks about the location and service area for the facility responding. Respondents are asked to provide the facility address and/or the coordinates of the facility. Table 5 below details the percentage of respondents who provided addresses or coordinates as well as the self-identified type of area the Facility Managers responded. % Providing Addresses 62.9% 100.0% 60.0% 73.7% % Providing 78.0% 64.7% 8o.o% 89.5% Coordinates % Municipality 46.3% 29.4% 8o.o% 52.6% % Catchment, Basin, 17.1% 23.5% 0.0% 15.8% or Watershed % Province/County 14.6% 17.6% 0.0% 15.8% % Service Area of 4.9% 11.8% 0.0% 0.0% Provider % Other Type 17.1% 17.6% 20.0% 15.8%
Accuracy of Entered Longitude/Latitude
Coordinates
(32
Responses)
72%
0 Correctly Entered N Incorrectly Entered 0 Formatting Issue
The pie chart above details the accuracy of the longitude and latitude coordinates provided by facility managers. Of the 16% that were incorrectly entered, two were exact duplicates of each other (upon
consultation with those sites, this was an Survey Management error by the individual who typed the Recommendation: Use a built-in surveys into the Qualtrics system), one coordinate system to accurately and entry had the longitude and latitude automatically determine the switched, and the fourth had an longitude/latitude for every response incorrect negative sign in front of one conducted in the online survey system. coordinate. Due to the self-reported -
-nature of the coordinates, with the instructions providing an outside website for the survey respondent to determine their facilities coordinates, it is to be expected that errors in formatting (i.e. copy/pasting) will occur. As such, I highly recommend that the final survey incorporate the use of a built-in coordinate identification system that can be used within the survey to directly find a set of accurate coordinates for any facility.
Accuracy of Name & Type of Area Entered
40%
4
'I20%
Yes E Yes, industrial provider * Yes, for one of two water sources used * No
I determined through interviews or S Resbudlg
email follow-up with facility managers Recommendation: who filled out the survey whether the recentendfin
self-identified area was accurate. Of the Allow for the entering of provider name 41 sites, I was able to follow up or and service area for each water source. interview the pilot study respondents for
10. Three of those sites incorrectly
named and typed the area for which they Survey Restructuring answered the pilot survey questions, two Recommendation:
of which were entered by the same Incorporate a question to assess the individual from Company 5 who did not ability of the respondent to answer for work nor regularly visit the sites he/she the site being surveyed (i.e. physical site was responding for. Of the other 7 of work).
responses I was able to verify, four were completely correct, two were named correctly but were unable to select an
accurate area as the facilities were both Survey Restructuring serviced by an industrial services utility Recommendation: Add in an and located in an industrial zone, and industrial provider option for types of the final site correctly identified its area service provider.
but it used multiple sources of water.
During the interview, this facility manager noted that this meant that it was only able to enter the name of the service area and type for its primary water source, making the response from the facility woefully incomplete. Due to this pattern of inaccuracy, I recommend the updated survey instrument allows for the entering of a provider name and service area for each source used, incorporates a question assessing the ability of the respondent to answer for the site, and incorporates an additional category of service provider: industrial service providers.
Information Availability
The next section of the survey instrument contains questions meant to provide
information on the first indicator identified by WRI/MIT-SSI: Information Availability. The table below details the breakdown of responses for the public availability of
quantifiable information on water availability, demand, and quality, with the former two being condensed into one question. As can be seen, public information was
self-identified by survey respondents as being more available in the United States as
opposed to India or the rest of the world. For most sites, if information was available on demand and availability, it was also available on quality, though not completely.
In the field given in the Water Availability and Demand part of this question, 21
respondents submitted links and three wrote in text. Under Water Quality, 17 submitted
Water Availability
Demand Data is Publicly Available
Water Quality Data 53.7% 70.6% 40.0% 42.1%
is Publicly Available
Per the survey structure, if the survey respondents identified that information was publicly available, the respondents were supposed to also provide where it could be found and a link if available. Per conversation with WRI/MIT-SSI after the survey was already in the field, it was determined early on to ignore answers that consisted of "My facility and/or company collects its own information" as this does not provide any insight into the availability of public information on public water management, only on company procedure which is not germane to the scope of the survey instrument.
In order to determine the accuracy of responses within this section, I conducted the following procedure:
1. For all sites that did not select "Yes, information is publicly available", I conducted an extensive online search to determine whether I could find any quantitative information that would meet these criteria. I also reviewed my interview notes for if those locations were in regions where I conducted
interviews to determine whether interviewees noted where publicly quantitative information could be found.
a. If I was able to find information that met the criteria, I labeled it as "Inaccurate, quantifiable information does exist."
b. If I was unable to find information that met the criteria, I labeled it as "Inaccurate, quantifiable information does not exist."
2. For all sites that did select "Yes, information is publicly available" and provided a link to the resource, I checked the link provided and the resources contained therein to determine whether they provide quantitative and publicly available information on availability and demand or quality.
a. I considered this accurately entered if the link led directly to the resources being asked or pointed to a page detailing where you could find the
information requested.
b. If it did not lead directly to information or to a page that contained where you could find the information but was usable to find the actual
quantifiable information, I marked it as "Accurate, but incorrect link." c. If it did not lead to quantifiable information (for either quality or both
availability and demand), I marked it as "Inaccurate, quantifiable information does not exist."
3. For all sites that did select "Yes, information is publicly available" and did not provide a link to the resource, I conducted an extensive online search to determine whether I could find any quantitative information that would meet these criteria.
a. I marked these accurate if I was able to find, based upon the answer entered into the survey, information that is both quantifiable and publicly available.
The two charts below detail the accuracy Survey Restructuring of the information provided within the Recommendation: Separate Information Availability section of the information availability and demand survey instrument. They show my into two questions.
determination on the accuracy of each response, with each entry being
color-coded based upon the original response provided in the pilot survey. There is a small variation between the responses for water quality versus demand and availability. Under the water availability and demand chart, there are two additional responses that stated that information was publicly available, but were in fact not. These were due to the fact that for at least a few service providers and areas, quantifiable information on
availability or demand was available but not both.
Accuracy of Availability of Public, Quantifiable Water Quality Information Accurate, but incorrect link/resource provided.
Accurate, but no link provided. Completely accurate, Inaccurate, quantifiable information does not exist. Inaccurate, quantifiable information exists.
0 2 4 6 8 10 12 14 16 18 20 22 24 26 28
Number of Responses #
Accuracy of Availability of Public, Quantifiable Water Availability and Demand Information Accurate, but incorrect link/resource provided.
Accurate, but no link provided. Completely accurate. Inaccurate, quantifiable information does not exist. Inaccurate, quantifiable information exists.
0 2 4 6 8 10 12 14 16 18 20 22 24 26 28
Number of Responses #
OrigInal Survey Instrument Entry
0 My facility and/or company collects its own information
* No. therm is no quantitative information * Yes, information is publicly available
* Yes, information is publicly available & My facility and/or company collects its own information
Figure 8: Accuracy of Availability of Information Provided
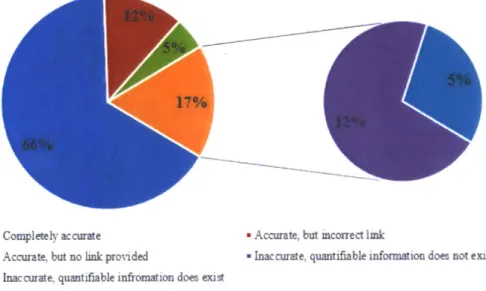
The two pie charts below detail the same information as the bar graphs above, but without the original survey responses. Overall, a little more than 80% of the responses to this section were accurate, although a few either
Data Integrity Recommendation: Conduct spot-checks of responses to and
links provided under any section requesting links to publicly provided
linked inaccurate resources or did not provide links. Of the 17% of responses that were inaccurate, differences occurred between water quality and water demand and
availability. This may be due to the fact that information on water availability in some regions was available but not information on demand.
Accuracy of Water Quality Information Provided
" Completely accurate
" Accurate, but no link provided
" Accurate, but incorrect link
" Inaccurate, quantifiable information does not exist
* Inaccurate, quantifiable infromation does exis
Figure 9: Accuracy of Water Quality Information Provided
Accuracy of Water Availability & Demand Information Provided
" Compleely accurate
-Accurate, but no link provided
mAccurate, but icorrect link
* Inac curate, quantifiable information does not exist * Inaccurate, quantifiable infromation does exist
Figure io: Accuracy of Water Availability & Demand Information Provided
As such, it is recommended that the next iteration of the survey instrument separate out availability and demand. I also recommend that spot checks be conducted of
information provided in this section to ensure that the response accuracy rate stays above whatever WRI/PI determine as an appropriate margin of error.
The next section of the survey
instrument covers information that falls
Survey Restructuring
within the Water Infrastructure
Recommendation:
indicator identified by WRI/MIT-SSI. Reduce number of options available This includes two separate sub-sections: under number of days sites experience
i) intermittency in provision and 2) rntemittenCYto 90 days from i8o. wastewater service availability. Overall,
less than 15% of the sites experienced intermittency, as detailed below. The majority of these were outside of the United States and India. Functionally, in conversation with WRI/MIT-SSI following the completion of the survey that the difference in
intermittency between 90 days and 18o days is essentially moot. This was reflected in interviews as at least two individuals noted that at 90 days, facilities would be
experiencing significant operational reduction and/or cost issues associated with finding alterative, emergency sources of water.
Almost 78% of facilities received wastewater services that collected and treated their wastewater, with every Indian facility receiving this service and the rate was close to 90% in the United States. The rates in the rest of the world were much lower, with almost 40% of sites in outside of the
United States and India receiving no Survey Restructuring collection or collection and partial or no Recommendation:
treatment of wastewater. + + +1k + It A LI + +
remove how the wastewater service When speaking with facility managers, provider treats water after it leaves the at least two expressed concern that not facility and ask who provides all individuals in their position may wastewater services to the facility. know what happens to their wastewater
after it leaves the facility, as that is not
germane to the operation of the facility itself. At least one facility manager noted that their wastewater service provider was different than their water provider. Individuals I interviewed in India and California did not find any of the responses provided by facility managers about wastewater services in their areas surprising, with the answers provided by facility managers considered completely accurate. I was unable to complete an
accuracy check of all responses provided under this question section due to being unable to ascertain who provides wastewater services to all facilities entered.
Intermittency up to 7.3% 5.9% 0.0% 10.5% 7 days Intermittency up to 2.4% 0.0% 0.0% 5.3% 30 days Intermittency up to 2.4% 0.0% 20.0% 0.0% 90 days Intermittency up to o.0% 0.0% 0.0% 0.0% 180 days Intermittency more 2.4% 0.0% 0.0% 5.3%
than 18o days
% Receive 78.% 88.2% 100.0% 63.2%
Collection &
Treatment
% Receive 2.4% 0.0% 0.0% 5.3%
Collection & Partial
Treatment % Receive 2.4% 0.0% 0.0% 5.3% Collection & No Treatment % Neither Collection 17.1% 11.8% 0.0% 26.3% nor Treatment
Water Access Regulations
The section of the survey instrument containing questions regarding the third indicator, Water Access Regulations, is much more extensive than previous sections. This section
starts off asking what types of water
sources are used at the facility level. The Surey Restructuring
answers provided to this question were Recommendation:
analyzed in the first section of this Ask the type of water sources used at chapter. In interviews, multiple the facility site much earlier in the individuals questioned why identifying survey and use this as the basis for the types of water sources used were so asking questions related to the far into the survey. They thought this management of said water sources. question should be moved much higher
in the survey as the provider of water and/or regulator of access to water
resources is highly dependent on the
Recommendation:
type of resource used.Reo edai :
Separate water access regulations and pricing structure for every section.