HAL Id: hal-01660275
https://hal.archives-ouvertes.fr/hal-01660275
Submitted on 28 Mar 2019
HAL is a multi-disciplinary open access
archive for the deposit and dissemination of
sci-entific research documents, whether they are
pub-lished or not. The documents may come from
teaching and research institutions in France or
abroad, or from public or private research centers.
L’archive ouverte pluridisciplinaire HAL, est
destinée au dépôt et à la diffusion de documents
scientifiques de niveau recherche, publiés ou non,
émanant des établissements d’enseignement et de
recherche français ou étrangers, des laboratoires
publics ou privés.
Flame-vortex interaction: Effect of residence time and
formulation of a new efficiency function
F. Thiesset, G. Maurice, F. Halter, N. Mazellier, C. Chauveau, I. Gökalp
To cite this version:
F. Thiesset, G. Maurice, F. Halter, N. Mazellier, C. Chauveau, et al.. Flame-vortex interaction:
Effect of residence time and formulation of a new efficiency function. Proceedings of the Combustion
Institute, Elsevier, 2017, 36 (2), pp.1843 - 1851. �10.1016/j.proci.2016.06.172�. �hal-01660275�
Flame-vortex interaction : e
ffect of residence time and formulation of a
new e
fficiency function
F. Thiesseta, G. Mauricea,b, F. Halter∗a, N. Mazellierb, C. Chauveaua, I. G¨okalpa aCNRS ICARE, Avenue de la Recherche Scientifique, 45072 Orl´eans Cedex 2 France bUniversity of Orl´eans, INSA de Bourges, PRISME, EA 4229, 45072 Orl´eans, France
Abstract
In this study, a combined experimental and numerical investigation of a toroidal vortex interacting with a stag-nation premixed flame is carried out with the aim of quantifying the ability of such a vortex to stretch the flame. By scrutinizing the literature, it was found that, although inferred from exactly similar numerical simulations, existing parametric expressions for the efficiency function (the ratio of the flame stretch to vortex strain) do not agree in the way the latter should behave when the ratio of the vortex rotational velocity Uθto the laminar flame speed SL
is increased. These expressions also appear to be unequally accurate when compared to experimental data and do not feature the non monotonic evolution of the efficiency function with Uθ/SLwhich is observed in both
experi-mental data and numerical simulations of a ’isothermal’ propagating interface. In addition, whilst previous studies have focused only on the impact of Uθ/SLand Rv/δL(Rvbeing the vortex typical size and δLthe laminar flame
thickness) our study reveals the importance of other parameters, the most important of which being the residence time of the vortex associated with its convection velocity. These results yield a new formulation for the efficiency function which compares favourably well with experimental data.
Keywords: Flame vortex interactions, Flame stretch, Vortex strain, residence time
∗
Corresponding author at: CNRS ICARE, Avenue de la Recherche Scientifique, 45072 Orl´eans Cedex 2 France Email: fabien.halter@cnrs-orleans.fr (F. Halter)
∗∗Colloquium : TURBULENT FLAMES
Total length= 6126 words (Method 2) Main text= 4231 words
Nomenclature= 0 word References= 253 words Figure 1 to 10= 198, 207, 132, 161, 136, 147, 191, 125, 191, 154 words Tables= 0 word No color reproduction
1. Introduction
1
Understanding and predicting the different
mech-2
anisms at play in turbulent premixed flames is a
3
tremendously difficult challenge. The main reason
4
is that there is still a lack of knowledge of the
tur-5
bulent flow structure which features a large variety
6
of turbulent scales. A given eddy thus experiences
7
many different processes induced by turbulent scales
8
of different sizes, such as vortex stretching and
sweep-9
ing, diffusion by viscosity, these effects being
partic-10
ularly arduous to model. In addition, when reacting
11
flows are concerned, the flame does not act as a
pas-12
sive scalar because of its propagative character and
13
the inherent heat release that locally modifies the fluid
14
physical properties. The high local flame curvature
15
and strain, also impact its local consumption or
dis-16
placement speed in a way which remains poorly
un-17
derstood.
18
There is thus a need for fundamental investigations
19
of the interactions between the fluid motion and a
20
flame in simplified and well controlled situations. One
21
of these is the case of a flame interacting with a single
22
vortex dipole (see the review by Renard et al. [1]).
Pi-23
oneer studies of Flame-Vortex Interactions (hereafter
24
abbreviated by FVI) emerged in the 90’s with notably
25
Poinsot et al. [2], Roberts and Driscoll [3], Wu and
26
Driscoll [4], Roberts et al. [5], Lee and Santavicca [6]
27
and more recently with Renard et al. [1], Colin et al.
28
[7], Charlette et al. [8], Bougrine et al. [9].
29
Although some effects such as vortex stretching,
30
sweeping, tilting are not present, FVI are expected to
31
mimic, at least partly, the processes at play in real
tur-32
bulent flames. The aforementioned investigations on
33
FVI have led notably to the construction of the
so-34
called spectral diagrams which allows to identify the
35
conditions needed for a vortex to stretch the flame, to
36
create pockets of fresh gas or to locally quench the
37
flame. In addition, these results yielded expression of
38
efficiency functions, i.e. the transfer function between
39
vortex strain and flame stretch. In this prospect, Colin
40
et al. [7], Charlette et al. [8] have focused on the
ef-41
fect of vortex size Rvrelative to the flame thickness δL
42
and vortex rotational velocity Uθrelative to the flame
43
speed SL. More recently, the effect of Lewis number
44
has been incorporated by Bougrine et al. [9]. These
45
efficiency functions are extremely valuable as they are
46
widely used in LES of turbulent premixed combustion
47
in order to model the sub-grid scale wrinkling factor
48
[7–9].
49
The aim of the present study is to explore one
par-50
ticular aspect of the interaction between the flow
mo-51
tion and a flame, which we referred to as the
strain-52
sweeping competition(see for instance the review by
53
Driscoll [10]). This competition can be
conceptu-54
ally described in terms of time-scales. Based on
phe-55
nomenological arguments [11], the strain-based time
56
scale τs of a scale r with characteristic velocity ur is
57
τs ∝ r/ur ∝ r2/3. This time-scale is generally
re-58
ferred to as the eddy turn-over time. Previous studies
59
devoted to FVI investigations [2–9] indicate that the
60
smaller this time scale, the larger is the flame stretch.
61
On the other hand, Tennekes [12] suggested that
an-62
other relevant time scale in a turbulent flow relates to
63
the sweeping effect by energy-containing eddies. He
64
pointed out that a given scale of size r is convected
65
by the large scales, i.e. with characteristic velocity
66
of the order of u0, the root-mean-square of the
veloc-67
ity fluctuations. The sweeping time scale as called by
68
Tennekes [12] thus writes τc ∝ r/u0. This has been
69
verified experimentally by e.g. Poulain et al. [13]. It
70
is worth stressing that these two phenomenology both
71
lead to the same prediction for the scaling exponent
72
of the energy spectra and are therefore
undistinguish-73
able in spectral space. In the field of combustion the
74
sweeping time scale is somehow related to the
resi-75
dence time [10] and basically describes the duration
76
of the interaction of a vortex located in the vicinity
77
of the flame. As far as the sweeping (or residence)
78
time scale is concerned, FVI [3, 4] corroborates the
79
intuitive statement that the smaller this time scale, the
80
smaller the flame stretch since the vortex spends less
81
time in the vicinity of the flame for rolling it up. In
tur-82
bulent flames, there is thus a competition between
tur-83
bulent strain and turbulent convection, the latter
phe-84
nomenon acts in decreasing the flame stretch whereas
85
the former has the opposite effect. It is thus worth
86
investigating these effects independently in order to
87
give further insight into their respective influence on
88
the flame. Further, a more complete expression for
89
the efficiency function which accounts for both strain
90
and residence time effects could be derived and used
91
in LES.
92
In the present study, a new experimental set-up was
93
designed in the goal of quantifying the degree of the
94
interactions between a vortex dipole and a stagnation
95
premixed flame. Some simple numerical simulations
96
based on the ’isothermal’ G-equation, have been
fur-97
ther carried out and validated against experimental
98
data. Such simulations allow to assess the effect of
99
the convection velocity and rotational velocity
inde-100
pendently. Finally, the respective effect of these two
101
phenomena on flame stretch are separately quantified,
102
incorporated into a new formulation for the efficiency
103
function, and compared to experimental data.
104
2. Experimental apparatus
105
Investigations are carried out in a single jet
stagna-106
tion flame configuration which is a modified version
107
of that used by Bouvet et al. [14]. A schematic of the
108
burner is provided in Fig. 1. A laminar strained flame
109
is stabilized against a 4-mm-thick stainless steel plate.
110
The stagnation plate is attached to an alumina foam
111
plug selected for its insulating properties. The fuel
112
and oxidizer are introduced through the side of the
113
burner. A so-called ’particle diffuser cone’ filled with
114
6 mm glass beads is used to ensure a homogeneous
115
mixture in the nozzle plenum. The reactive mixture
116
then flows into the burner plenum through a 5 mm
117
thick aluminium grid. It is finally accelerated in the
118
Figure 1: Schematic of the experimental setup
converging section with a D= 15mm outflow
diame-119
ter, creating an upward-oriented jet with a nearly top
120
hat velocity profile at the burner exit. The
burner-to-121
stagnation plate distance L was fixed to 25mm, given a
122
L/D ratio greater than unity as usually recommended.
123
Moreover, it allows to stabilize flames sufficiently far
124
from the plate to track the flame/vortex interaction
125
without being affected by the plate. To avoid external
126
perturbations and improve flame stability, a laminar
127
coaxial shroud of nitrogen is used. The nitrogen flow
128
rate was set so that the coflow exit velocity closely
129
matches that of the main flow. In the present study,
130
the wall stagnation configuration is preferred over the
131
classical opposed jet configuration for the following
132
reasons: (i) the experimental apparatus can be
im-133
plemented and controlled easily (no need for upper
134
burner) and (ii) wall-stabilized flames are generally
135
found to be more stable than counterflow ones.
136
The toroidal vortex is generated by applying a
sud-137
den pressure discharge of reactive mixture of same
138
equivalence ratio than the main flow in a tube of 2mm
139
in diameter located on the centerline of the flow and
140
35mm upstream the burner outlet (Fig. 1). The
in-141
tensity of the vortex is controlled by varying the
pres-142
sure magnitude within a pressurized tank located
up-143
stream. To control the duration of the pressure
dis-144
charge, it was necessary to use two electro-valves
145
placed one after another because the time needed for
146
a single electro-valve to open and close was too large.
147
First, the upstream electro-valve is kept closed while
148
the second placed downstream is opened. Then, for
149
generating the vortex, the first valve is opened while
150
the second one is closed with a small time delay, so
151
that the pressure discharge duration was about 5ms.
152
Three equivalence ratios for the reactive
methane-153
air mixture φ= 1, 0.9, 0.8 have been considered. The
154
Figure 2: Time sequence of Mie scattering images of a typ-ical FVI (Uθ/SL = 1.43). The flame contours and
vortic-ity field are superimposed. The top of each image has been cropped to show only the first 20mm. The line corresponds to the flame contours with area A(t,∆) estimated over a domain of width∆. Uθ, Ucare the vortex rotational and convection
respectively, whilst Rvis the vortex core-to-core distance.
laminar flame speed and thickness have been
eval-155
uated using the GRI-mech 3.0 mechanism together
156
with the stagnation flame module of the CHEMKIN
157
Pro software. The temperature of the wall, measured
158
by Bouvet et al. [14], was set to 800K. It was found
159
that SL = 40.3, 36.5, 30.6cm.s−1and δL = 433, 463,
160
525µm respectively for φ= 1, 0.9 and 0.8. The strain
161
rate was respectively 90, 86 and 77s−1for φ= 1, 0.9
162
and 0.8.
163
The flame front is tracked by means of Mie
scat-164
tering laser tomography. Seeding of the flow is made
165
by silicon oil droplets supplied by an atomizer.
Typ-166
ical size of droplets is about 1µm. It was checked
167
that the flame location was the same when the seeding
168
was turned off suggesting that the laminar flame speed
169
was not altered by the addition of silicon droplets in
170
the flow. Then, use is made of a continuous Coherent
171
Verdi G20 Laser which delivers up to 20W at 532nm.
172
The light scattered by the droplets is then captured by
173
a Phantom V1210 camera, equipped with a 105mm
174
F2.8 lens, working at an acquisition rate of 23005Hz
175
with a field of view of 704×640 pixels2and the
reso-176
lution was 38µm/px.
177
The flame contour is then extracted as follows.
178
Firstly, a contrast-limited adaptive histogram
equal-179
ization (CLAHE) is applied to the original images in
180
order to optimize the contrast in the images. Then, to
181
limit the pixelization associated with the CLAHE,
im-182
ages are filtered using a Gaussian filter of size equal
183
to 4 times the spatial resolution. For the binarizing
184
procedure, we use a standard threshold-based
tech-185
nique. More precisely, the histogram of the gray scale
186
is calculated. The latter reveals two distinct peaks
cor-187
responding to the fresh and burned gas respectively.
188
The threshold value for discriminating the flame
tour is set as the average value between the gray scale
190
of these two peaks. This yields estimations for the
191
progress variable, noted c, which is by definition 0 and
192
1 in the unburned and burned gas respectively. The
ve-193
locity field within the unburned mixture is estimated
194
by classical 2D-2C Particle Image Velocimetry (PIV).
195
For this purpose, the Matlab subroutines of Thielicke
196
and Stamhuis [15] were used. A time sequence of Mie
197
scattering images at four distinct instants is shown in
198
Fig. 2. The vorticity field and flame contours are
su-199
perimposed. The time t0= 0 was set arbitrarily as the
200
time t where the vortex center was 2.5mm downstream
201
the burner outlet. One observes that at a time t=4ms,
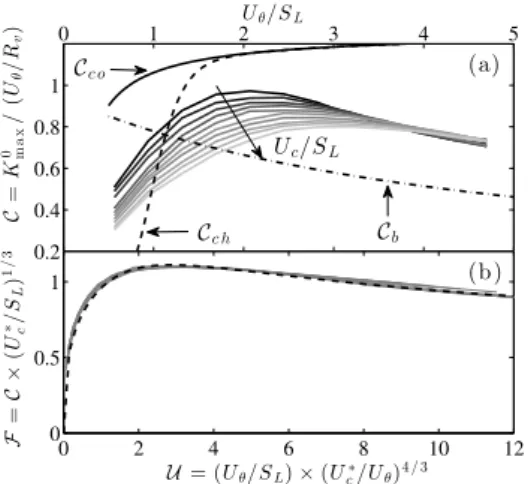
202
the flame is rather flat suggesting that the vortex
gen-203
erator is sufficiently far from the burner outlet for not
204
creating a wake. As the vortex is convected (t=6ms
205
and 8ms), the flame is increasingly stretched. Its area
206
then reaches a maximum before decreasing (t=10ms)
207
while the flame goes back to its original position.
208
The vortex parameters, i.e. the circumferential
ve-209
locity Uθ, the convection velocity Uc and the
core-210
to-core distance Rv, have been inferred from PIV by
211
fitting the velocity field calculated with an Oseen
vor-212
tex. Our experimental set-up allows to cover the
213
range 0.5 . Uθ/SL . 2.5 whereas Rv/δL slightly
214
varies around 6.5. Our database thus lies between
215
the no-effect limit and the quenching limit assessed
216
by Roberts et al. [5].
217
3. Experimental results
218
3.1. Domain size effects
219
The focus of this paper is on the flame stretch
as-220
sociated with the interaction with a vortex. Given the
221
vortex rotational velocity Uθand the distance between
222
vortex cores Rv(see Fig. 2), the vortex strain is
gener-223
ally estimated as Uθ/Rv[7–9]. On the other hand, the
224
flame stretch is evaluated as
225
K(t,∆) = 1 A(t,∆)
∂A(t, ∆)
∂t (1) where, thanks to axisymmetry, A(t,∆) =
226
R
y(s)px02+ y02ds is the flame area at a time t
227
evaluated over a domain of width ∆ (see Fig. 2).
228
s is the curvilinear parameter, y and x are the
229
flame contour spatial coordinates and the prime
230
denotes derivatives with respect to s. Then the
231
efficiency function is defined as in [7–9], viz.
232
C(∆) = Kmax(∆)/ (Uθ/Rv), where Kmax(∆) is the
233
maximum value of K(t,∆). The appearance of
234
∆ in the efficiency function is new. In previous
235
numerical studies [7–9] a given value for∆ ≈ 6Rv
236
corresponding to the size of the simulation domain
237
was chosen. However, it appears straightforward
238
that Kmaxdepends on∆. Indeed, because the portion
239
of flame interacting with the vortex is constant (i.e.
240
there exists a∆ above which ∂A/∂t is independent of
241
∆), we expect Kmax to decrease with∆2since A(t,∆)
242
monotonically increases with∆2. Figure 3 presents
243 1 2 3 4 5 6 0 0.5 1 1.5 2 ∆/Rv C = Km a x / (U θ / Rv ) Fit Eq. ( 2) Expe r ime nt s
Figure 3: Evolution of Kmaxwith∆ for Uθ/SL= 1.43.
Sym-bols represent experimental data whilst the line corresponds to the fit using Eq. (2).
the evolution of Kmax with respect to∆. It clearly
244
appears that Kmax rapidly decreases with respect to
245
∆ and for ∆ sufficiently large (i.e. for ∆ larger to a
246
certain∆i), it is found that Kmaxfollows the relation
247 Kmax= Kmax0 "∆ i−∆0 ∆ − ∆0 #2 . (2)
In Eq. (2), ∆i represents the domain width above
248
which ∂A/∂t is constant and∆0is interpreted as a
vir-249
tual origin, i.e. K−1
max → 0 when∆ → ∆0. From our
250
experimental database, it was found that ∆i/Rv and
251
∆0/Rvwere constant and are equal to 2.5 ± 0.05 and
252
−0.5 ± 0.1 respectively.
253
Figure 3 emphasizes that the values for the
effi-254
ciency function that were previously provided notably
255
by Colin et al. [7], Charlette et al. [8], Bougrine et al.
256
[9], were inferred for a given value of∆/Rvwhereas
257
they should depend on∆. In other words, if they had
258
chosen a different value for the simulation domain,
259
they would have obtained different values. Moreover,
260
the no-effect limit assessed by Poinsot et al. [2] which
261
”corresponds to vortices which induce a maximum
262
modification of the total reaction rate of about 5
per-263
cent”, should also depend on∆.
264
3.2. Impact of vortex intensity
265
We now turn our attention to the effect of the
vor-266
tex strength on the flame stretch. Figure 4 depicts the
267
evolution of C0 = K0
max/(Uθ/Rv) as a function Uθ/SL
268
(hereafter the superscript0 on C will be removed for
269
the sake of simplicity). Experimental results are also
270
compared to the predictions provided by Colin et al.
271
[7], Charlette et al. [8], Bougrine et al. [9] which are
272
respectively noted Cco, Cch and Cb. Their respective
273
analytical expressions are not recalled here but the
274
reader can refer to [7–9] for more details.
275
Experimental uncertainties have been estimated as
276
follows. The precision of the subpixel interpolation of
277
the PIV algorithm is generally about 0.05 pixel. The
278
uncertainty on the velocity field is therefore constant
279
and equals to about 0.04m.s−1provided the resolution
280
and sampling frequency of our images. The error on
281
the estimation of Rvprovided by fitting experimental
282
0.5 1 1.5 2 2.5 0.75 1 Uθ/SL C = K 0 ma x / (U θ / Rv ) Cc h Cb Cc o
Figure 4: Efficiency function C = K0
max/(Uθ/Rv) as a
func-tion of Uθ/SL. The lines labbeled Cco, Cch, Cb correspond
respectively to the parametric expressions provided by Colin et al. [7], Charlette et al. [8], Bougrine et al. [9], corrected us-ing Eq. (2) to obtain K0
max. The circle symbols correspond to
the present measurements whilst the square symbol is taken from Bougrine et al. [9]
data with an Oseen vortex was generally of about 4%.
283
The uncertainty in the determination of Kmaxwas
sup-284
posed to be negligible by comparison with the errors
285
on both Uθand Rvsince A is readily measurable.
286
A careful analysis of Fig. 4 first reveals that,
al-287
though rather limited, some departures between
ex-288
perimental data and the predictions of either [7–9]
289
can be observed. By comparison with experiments,
290
the efficiency function of Colin et al. [7] appears to
291
be the more appropriate. These differences might be
292
explained by several parameters. First, it is worth
293
recalling that our configuration is axisymetric whilst
294
DNS of [7–9] are 2D (planar). Secondly, in [7–9],
295
the flame stretch is estimated from the heat release
296
Q, i.e. K = Q−1dQ/dt which implicitly suggests
297
that Refs. [7–9] considered that the flame
consump-298
tion speed was unaltered by the flame stretch. Such
299
an hypothesis is consistent with LES models based
300
on the flame density concept for which the heat
re-301
lease or fuel consumption is calculated through the
302
laminar flame speed multiplied by the flame surface
303
density. This assumption is however not consistent
304
with LES that employs skeletal or analytical
chem-305
istry which explicitly accounts for the effect of stretch
306
on the flame consumption speed.
307
Fig. 4 also suggests that though based on exactly
308
similar simulations, existing parametric expressions
309
do not agree in the way C should behave with
re-310
spect to Uθ/SL. Indeed, Colin et al. [7], Charlette
311
et al. [8] both predict an increasing tendency of C
312
with respect to Uθ/SL whereas Cb leads to the
op-313
posite trend. Although slightly scattered, our
exper-314
imental data further suggest that the evolution of C is
315
non monotonic, i.e. C first increases before decreasing
316
slightly for Uθ/SLlarger than about 1.5. The
decreas-317
ing tendency of C was also observed in the DNS of
318
Bougrine et al. [9] when the vortex strength was
en-319
hanced from Uθ/SL= 0.8 to 8 (note that there is a nice
320
agreement between our experiments and the DNS data
321
of Bougrine et al. [9] for Uθ/SL = 0.8, Rv/δL = 5).
322
This observation can be readily explained by recalling
323 0 0.5 1 1.5 2 2.5 3 0 0.5 1 1.5 Uθ/SL { Uc − U u(X c )} / SL (Uθ/SL)2 / 3
Figure 5: Convection velocity Uc− Uu(Xc), where Uu(Xc) is
the streamwise velocity of the unperturbed flow at the vortex center location Xc, as a function of Uθ. The dotted line is given by 0.5(Uθ/SL)2/3.
that an intense vortex will create high local curvatures
324
which act in decreasing the total stretch of the flame.
325
In other words, increasing the vortex strength can be
326
less efficient since it leads to too high curvatures that
327
globally reduces the flame stretch.
328
Roberts and Driscoll [3] were first to realize that
329
the flame stretch is also driven by the convection
ve-330
locity Ucof the vortex dipole. More precisely, they
331
suggested that for a given Uθ, increasing Uc yields
332
a smaller flame stretch because the residence time of
333
the vortex in the vicinity of the flame decreases. This
334
intuitive statement was further confirmed by Wu and
335
Driscoll [4] on the basis of numerical simulations of
336
a propagating surface. There is thus a need for
incor-337
porating these two opposed effects (convection vs
ro-338
tational velocity) into a more complete expression of
339
the efficiency functions. However, in our experiments,
340
it was observed that increasing Uθirremediably led to
341
a higher convection velocity consistently with
analyt-342
ical studies (see [1] and references therein). It was
343
found experimentally (Fig. 5) that the convection
ve-344
locity Uc− Uu(Xc) (Uu the streamwize velocity
ex-345
perienced by the vortex located at Xc) scales as Uθ2/3.
346
Therefore, it is not possible from experiments to
as-347
sess independently the respective influence of Uθand
348
Uc.
349
Consequently, following e.g. Wu and Driscoll [4]
350
or Lee and Santavicca [6], we decided to perform
sim-351
plified numerical simulations of the same burner in
352
the goal of studying the effect of Ucand Uθ
indepen-353
dently. These simulations have been widely used in
354
the past mainly because they are extremely low-cost
355
in terms of computational resources. Indeed, they
356
consider the flame as a ’passive’ propagating
(ther-357
mally neutral) interface, which tremendously reduces
358
the problem complexity. Such simulations neglect the
359
heat release and therefore many physical mechanisms
360
are not taken into account. First, the higher viscosity
361
due to high temperature in the burnt gas, resulting in
362
a larger dissipation rate is not accounted for.
Baro-363
clinic effects as evidenced by [5] are also neglected.
364
However, with this limitations in mind, one aspect of
365
the present work is to investigate in detail how
0 0.002 0.004 0.006 0 0.5 1 1.5 2 t[s ] Rv 2[mm] Uc[m/s ] Xc[c m] Uθ[m/s ] Uc−Uu( Xc) [m/s ]
Figure 6: Time evolution of the vortex parameters for a given case in the database. The vortex core-to-core distance Rv, the
convection velocity Ucand Uc− Uu(Xc), the vortex center
streamwize position Xc, and the rotational velocity (black)
are represented as a function of time. Symbols are experi-mental data whilst lines stand for the simulation.
istic these (widely used) simulations could be when
367
compared to experiments. In other words, handling
368
such a comparison helps in giving further insights into
369
the importance of heat release and associated physical
370
mechanism during a FVI.
371
4. Simulations of a vortex interacting with a
372
propagating interface
373
4.1. Implementation and validation
374
Present numerical simulations consider the flame
375
as a two-dimensional (axisymmetric) propagating
in-376
terface convected by the fluid motion U while
advanc-377
ing at the laminar flame speed SL. The kinematic
re-378
lationship between the flame and the flow field is then
379
given by the G-equation which writes [4, 6]
380
∂G
∂t +U.∇G = SL|∇G|. (3)
In the present case, the Navier-Stokes are not
ex-381
plicitly resolved and the velocity field is set as
fol-382
lows. First, Uu and Vu, i.e. the velocity component
383
in the streamwise x and transverse y direction of
un-384
perturbed flow (before the generation of the vortex)
385
is given by Uu(x, y) = −2 R a(x)dx and Vu(x, y) =
386
a(x) × y, where U0 = 1.23m.s−1is the inlet velocity
387
of the burner and a(x)= ∂Vu/∂y(y = 0) is the
trans-388
verse strain of the unperturbed flow. a(x) was fitted
389
from experiments using a second order polynomial.
390
The coefficients of the polynomial were adjusted for
391
each equivalence ratio.
392
Secondly, the vortex velocity field was added to Uu
393
and Vuand set using the Oseen expression. The
in-394
put parameters for the Oseen vortex are Uθ, Xc (the
395
streamwize location of the vortex center) and Rv, the
396
core-to-core distance. In the present case, by
analyz-397
ing experimental data (see Fig. 6), it was found that
398
Uθ does not vary with time and was therefore set to
399
a constant. The vortex center Xcwas convected at a
400
velocity Uc, viz. ∂Xc/∂t = Uc, where Uc− Uu(Xc)
401 0.002 0.004 0.006 0.008 0.01 0.012 −100 −50 0 50 100 time t [s ] K (t ) # s − 1 $ 0 10 20 30 40 A (t ) − A (t0 ) [m m 2] G e quat ion Expe r ime nt s Uθ/SL= 1.43 Uθ/SL= 1.83 Uθ/SL= 0.94 Uθ/SL= 0.94 Uθ/SL= 1.43 Uθ/SL= 1.83
Figure 7: Time evolution of the flame area A(t,∆) (a) and stretch K(t,∆) (b) for ∆ = 10mm, for three different ratio of Uθ/SL= 0.94, 1.43, 1.83. Dashed and full lines correspond
respectively to experimental and numerical data
0 100 200 300 400 0 100 200 300 400 K0 m a x#s− 1$ measur ed K 0 ma x # s − 1 $ G e q u a ti o n 0 1 2 3Uθ SL
Figure 8: Maximum stretch K0
max assessed by experiments
versus K0maxinferred from numerical simulations. Symbols
are coloured by Uθ/SL
was found to be constant (see Fig. 6). The time
evolu-402
tion of the vortex ring diameter Rvfollows the relation
403
[16] R−1
v ∂Rv/∂t = a(Xc). In Fig. 6, the time
evolu-404
tion of vortex parameters issued from the experiments
405
are compared to that prescribed in the numerical
sim-406
ulations. All quantities compare extremely well and
407
thus validate the procedure for establishing the
veloc-408
ity field.
409
The G-field was initialized as a signed distance
410
with the iso-value G = G0 = 0 located at the
411
streamwize location x at which Uu(x)= S
L.
Equa-412
tion (3) is resolved using a fifth-order WENO
dis-413
cretization scheme in space and 4th-order
Runge-414
Kutta scheme for time advancement. The usual
reini-415
tialization procedure is also applied at each time step
416
so that the G-field remains a signed distance. The
417
mesh size is 500×500 corresponding to a domain
418
size of 25×25mm2. It was checked that increasing
419
the mesh size up to 1000×1000 points yielded only
420
marginal differences.
421
Numerical simulations have been validated against
422
experimental data. Results for three different values
423
0 1 2 3 4 5 0.2 0.4 0.6 0.8 1 Uθ/SL C = K 0 ma x / (U θ / Rv ) 0 2 4 6 8 10 12 0 0.5 1 U= (Uθ/SL) × (Uc∗/Uθ)4 / 3 F = C × (U ∗/c SL ) 1 / 3 (b) (a) Cc h Cc o Cb Uc/SL
Figure 9: (a) Efficiency function as a function of Uθ/SLfor
different values of Uc/SL. The arrow indicates increasing
values of Uc/SL. (b) Rescaled efficiency function as a
func-tion of a rescaled velocity ratio. The black dashed line rep-resent the fit using Eq. (4)
of Uθ/SL = 0.94, 1.43, 1.83 are presented in Fig. 7.
424
The increase of A(t,∆) is very nicely reproduced by
425
the simulation, whilst some slight departures are
ob-426
served close to the maximum of A(t,∆). This
indi-427
cates that the early stage of the interaction (i.e. before
428
the vortex reaches the burnt gas) relies mainly on a
429
kinematic interaction and that the heat release does
430
not play a significant role at this stage. The simulated
431
flame stretch compares favourably well with
experi-432
ments for the three cases represented in Fig. 7. A
433
scatter plot between the measured and simulated K0 max
434
for the entire database is further given in Fig. 8. Here
435
again, a nice agreement is observed. Departures
be-436
tween numerical and experimental data for K0 max lies
437
within 20% on average.
438
4.2. Formulation of a new efficiency function
439
By use of such numerical simulations, the effect of
440
Ucand Uθon Kmax0 can thus be studied independently
441
with the aim of incorporating these parameters in a
442
more complete expression for the efficiency function.
443
In Fig. 9(a), are provided the numerical results
444
for the efficiency function as a function of Uθ/SLfor
445
0.6SL≤ Uc− Uu(Xc) ≤ 4.7SL. Noticeable is the non
446
monotonic evolution of C with respect to Uθ/SLthat
447
was previously observed in the experiments (see Fig.
448
4). Furthermore, one clearly sees a dependence of C
449
on Uc. Note that for Uθ/SL > 3.5 the effect of Ucis
450
almost negligible. In Fig. 9(b), it is shown that the
451
evolution of C with respect to Ucand Uθcan collapse
452
on a single curve, when the rescaled efficiency
func-453
tion F = C × (U∗
c/SL)1/3is plotted as a function of
454
a rescaled velocity ratio U = (Uθ/SL) × (U∗c/Uθ)4/3,
455
where U∗
c = Uc− Uu(Xc)+ SL is the relative
ve-456
locity between the flame and the vortex centers [4].
457
This curve highlights a first zone for U < 2.5 where
458 0 100 200 300 400 0 100 200 300 400 0 100 200 300 400 0 100 200 300 400 0 100 200 300 400 100 200 300 400 K0 m a x[s− 1] meas ur ed C × Uθ / Rv # s − 1 $ 1 1.5 2 2.5 1 1.5 2 2.5 1 1.5 2 2.5 0 100 200 300 4000 100 200 300 400 1 1.5 2 2.5 (a) (c) (b) (d) Colin et al. Present Charlette et al. Bougrine et al. Uθ SL Uθ SL Uθ SL Uθ SL
Figure 10: Scatter plot of the experimental vs modelled flame stretch using the present efficiency function (a), that of Colin et al. [7] (b), Charlette et al. [8] (c) and Bougrine et al. [9] (d). Symbols are coloured by Uθ/SL
F scales as U1/3, and a second zone at larger U
459
for which F decreases as U−1/4. This trend can be
460
well fitted by the following parametric expression (the
461
black dashed line in Fig. 9(b))
462 F = U1/3 1+ U Umax !2 −7 24 , (4) from which C = F × (U∗ c/SL)−1/3can be recovered. 463
Umaxis the rescaled velocity ratio for which the
bend-464
ing of F is observed and was found to be equal to 2.5.
465
The ability of this expression for modelling the flame
466
stretch from the vortex strain is emphasized in Fig.
467
10. Departures between modelled and measured K0 max
468
are similar to Fig. 8, i.e. within 20%. The present
469
formulation for C further appears to be more adequate
470
than either that of Colin et al. [7], Charlette et al. [8]
471
or Bougrine et al. [9].
472
5. Conclusion
473
The present study is devoted to the exploration
474
of the flame stretch induced by a vortex dipole with
475
special emphasis on the strain-sweeping competition.
476
Both experiments and numerical simulations of a
stag-477
nation flame have been carried out, with the aim of
as-478
sessing the ability of available parametric expression
479
for describing the efficiency function. The outcomes
480
of the present study can be summarized as follows:
481
• It was first shown that, though based on the same
482
numerical data, C provided by both Colin et al.
483
[7], Charlette et al. [8] predict an increase of C
484
with respect to Uθ/SLwhereas that of Bougrine
485
et al. [9] emphasizes the opposite trend. In
addi-486
tion, all these expressions fail in describing the
487
non-monotonic evolution of C with respect to
488
Uθ/SLwhich is observed in both experimental
489
and numerical data.
• Secondly, by comparing experiments to
simpli-491
fied numerical simulations based on the
’isother-492
mal’ G-equation, it was shown that the early
493
stage of interaction is driven by a kinematic
in-494
teraction between the vortex and the flame. The
495
maximum flame stretch issued from such
nu-496
merical simulations is in agreement with
exper-497
iments.
498
• Finally, these simulations allow the effect of the
499
residence time of the vortex in the vicinity of the
500
flame to be investigated. A new parametric
ex-501
pression for the efficiency function is proposed
502
and compares favourably well with
experimen-503
tal data.
504
As mentioned in the introduction, strain and
sweep-505
ing effects are respectively representative of rather
506
small (ur) and large scales (u0) phenomena. This
in-507
dicates a priori that in a LES, C can be evaluated,
508
using the sub-grid scale velocity for Uθ and the
to-509
tal (resolved+ sub-grid scale) velocity for Uc. The
510
residence time also requires the knowledge of the
vor-511
tex sweeping direction compared to the flame normal
512
direction, for which a sub-model has yet been
devel-513
oped. Another important point concerns the fact that
514
in LES, the efficiency functions have to be integrated
515
over all the sub-grid scales. In previous studies, e.g.
516
[8], the integration was done in spectral space. It is
517
worth stressing that the integration over available
tur-518
bulent scales might not be necessary by keeping the
519
description in physical space (that of the structure or
520
correlation functions), in which the notion of
cumula-521
tive over turbulent scales is implicit (see e.g. [17]).
In-522
deed, in Ref. [17], use was made of an expression for
523
the turbulent strain (Eq. (1) in [17]) which represents
524
the strain due to the combined effect of all smaller
525
scales (as the structure function does, see e.g. [18]
526
p.11, or [19] p 366). This expression is thus
equiv-527
alent to the subgrid scale strain. Consequently, the
528
multiplication of the efficiency function by the latter
529
expression for the strain directly represents the flame
530
stretch of all smaller scales than the scale considered.
531
i.e. the subgrid flame stretch and there is no need for
532
spectral integration.
533
Further work will be devoted to exploring the
im-534
pact of the ratio R/δLon C by changing the diameter
535
of the vortex generator. We also plan to study in
de-536
tail the effect of fuel composition and especially the
537
Lewis number effects.
538
Acknowledgements
539
The financial support from the Agence National de
540
la Recherche under the project IDYLLE is gratefully
541
acknowledged. In this respect, we would like to thank
542
especially S. Richard, L. Selle and T. Poinsot for
fruit-543
ful discussions. We are also thankful to the CNRS,
544
the University of Orl´eans, and the French
Govern-545
ment Program ”Investissements d’avenir” through the
546
LABEX CAPRYSSES. FT acknowledges EADS for
547
its financial support. We also benefited from the
com-548
puting resources provided by CaSciModOT. We thank
549
Laurent Catherine for his technical assistance. We
550
are grateful to Seong Young Lee for providing us the
551
CHEMKIN PRO results.
552
References
553
[1] P.-H. Renard, D. Thevenin, J.-C. Rolon, S. Candel, 554
Prog. Energ. Combust. 26 (2000) 225–282. 555
[2] T. Poinsot, D. Veynante, S. Candel, J. Fluid Mech. 228 556
(1991) 561–606. 557
[3] W. L. Roberts, J. F. Driscoll, Combust. Flame 87 558
(1991) 245–256. 559
[4] M.-S. Wu, J. F. Driscoll, Combust. Flame 91 (1992) 560
310–322. 561
[5] W. L. Roberts, J. F. Driscoll, M. C. Drake, L. P. Goss, 562
Combust. Flame 94 (1993) 58–69. 563
[6] T.-W. Lee, D. Santavicca, Combust. Sci. Technol. 90 564
(1993) 211–229. 565
[7] O. Colin, F. Ducros, D. Veynante, T. Poinsot, Phys. 566
Fluids 12 (2000) 1843–1863. 567
[8] F. Charlette, C. Meneveau, D. Veynante, Combust. 568
Flame 131 (2002) 159–180. 569
[9] S. Bougrine, S. Richard, O. Colin, D. Veynante, Flow, 570
turbul. combust. 93 (2014) 259–281. 571
[10] J. F. Driscoll, Prog. Energ. Combust. 34 (2008) 91– 572
134. 573
[11] A. Kolmogorov, Proc. USSR Ac. of Sci. 30 (1941) 574
299–303. 575
[12] H. Tennekes, J. Fluid Mech. 67 (1975) 561–567. 576
[13] C. Poulain, N. Mazellier, L. Chevillard, Y. Gagne, 577
C. Baudet, Eur. Phys. J. B 53 (2006) 219–224. 578
[14] N. Bouvet, D. Davidenko, C. Chauveau, L. Pillier, 579
Y. Yoon, Combust. Flame 161 (2014) 438–452. 580
[15] W. Thielicke, E. J. Stamhuis, Journal of Open Research 581
Software 2 (2014) 30. 582
[16] R. Trieling, J. Van Wesenbeeck, G. Van Heijst, Phys. 583
Fluids 10 (1998) 144–159. 584
[17] F. Thiesset, G. Maurice, F. Halter, N. Mazellier, 585
C. Chauveau, I. G¨okalp, Combustion Theory and Mod-586
elling 20 (2016) 1–17. 587
[18] A. A. R. Townsend, The structure of turbulent shear 588
flow, Cambridge Univ Press, 1976. 589
[19] P. A. Davidson, Turbulence: an introduction for scien-590
tists and engineers, Oxford University Press, 2015. 591